. 2018 Nov 6;9(6):e01318-18.
doi: 10.1128/mBio.01318-18.

Hypoxia Promotes Immune Evasion by Triggering β-Glucan Masking on the Candida albicans Cell Surface via Mitochondrial and cAMP-Protein Kinase A Signaling

Affiliations

Hypoxia Promotes Immune Evasion by Triggering β-Glucan Masking on the Candida albicans Cell Surface via Mitochondrial and cAMP-Protein Kinase A Signaling

Arnab Pradhan et al. mBio. .

Abstract

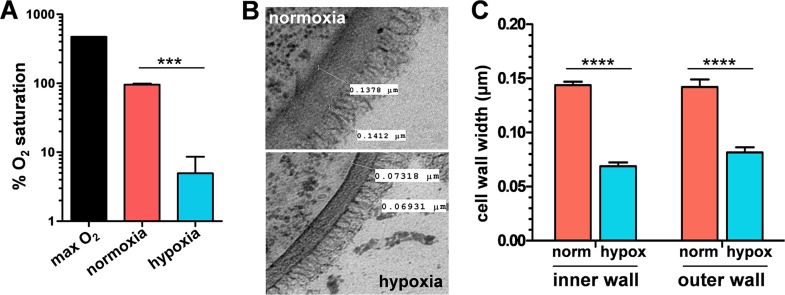
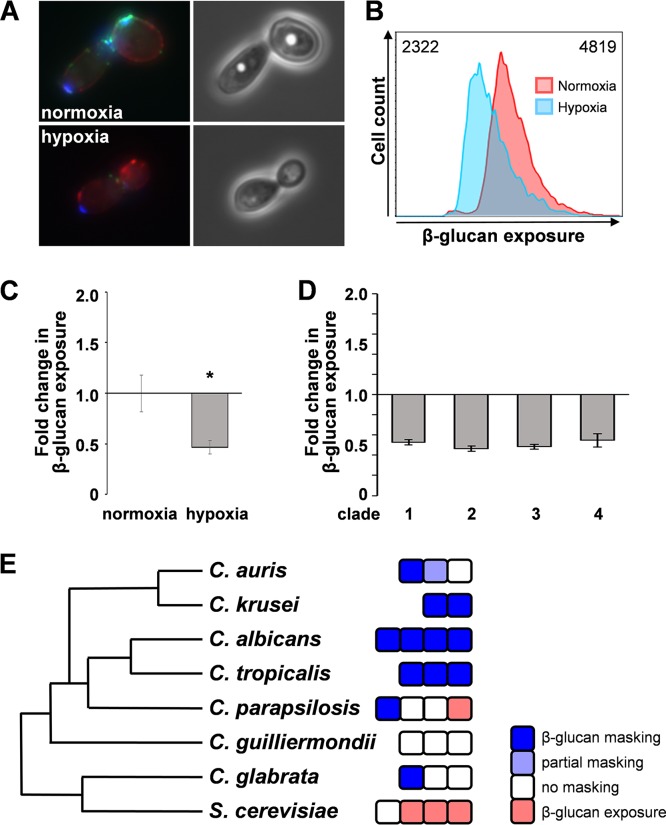
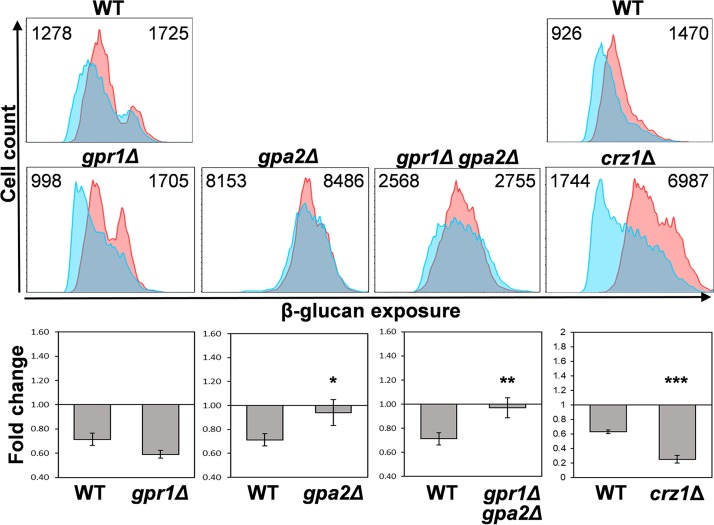
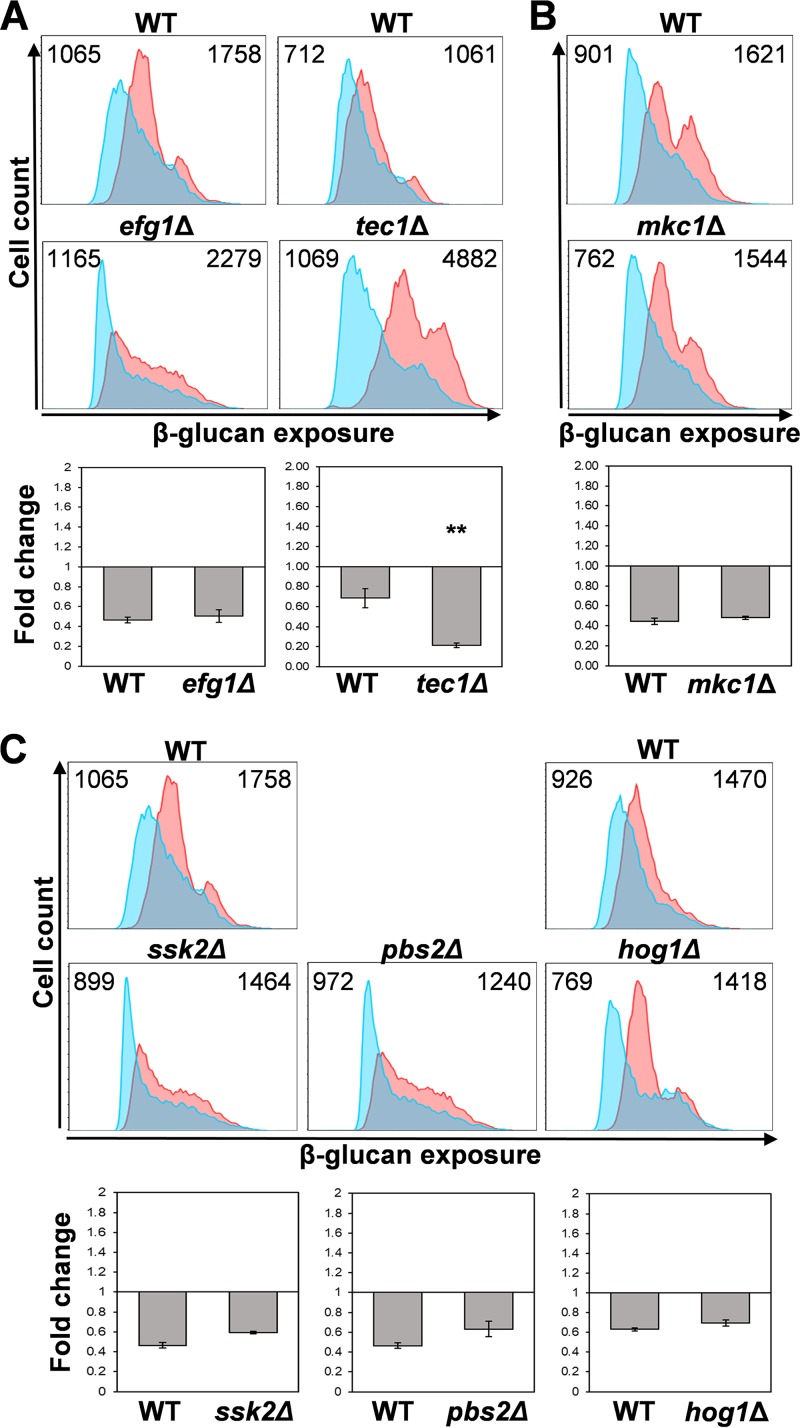
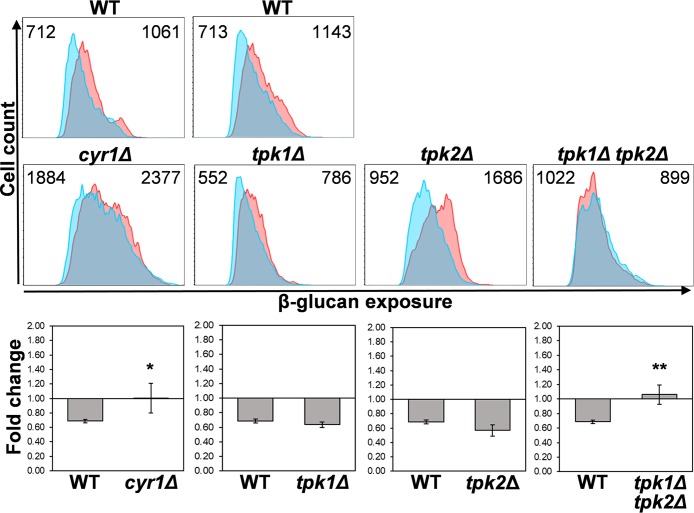
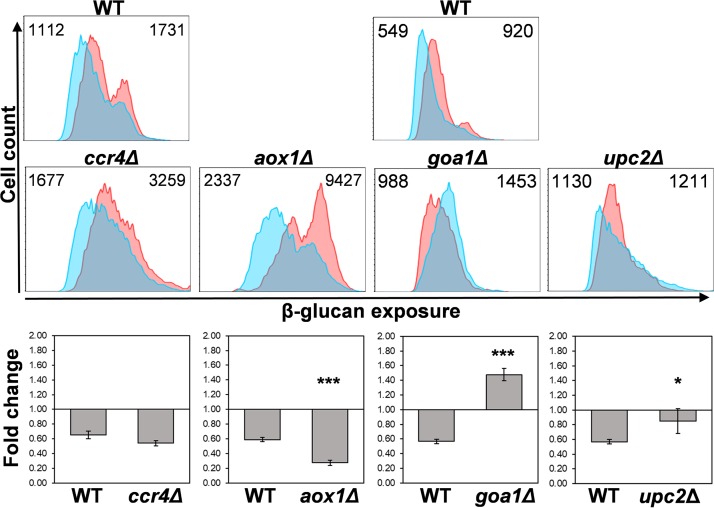
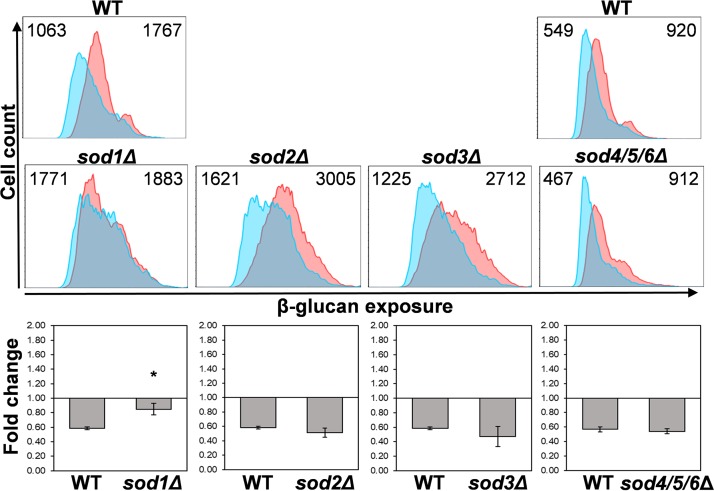
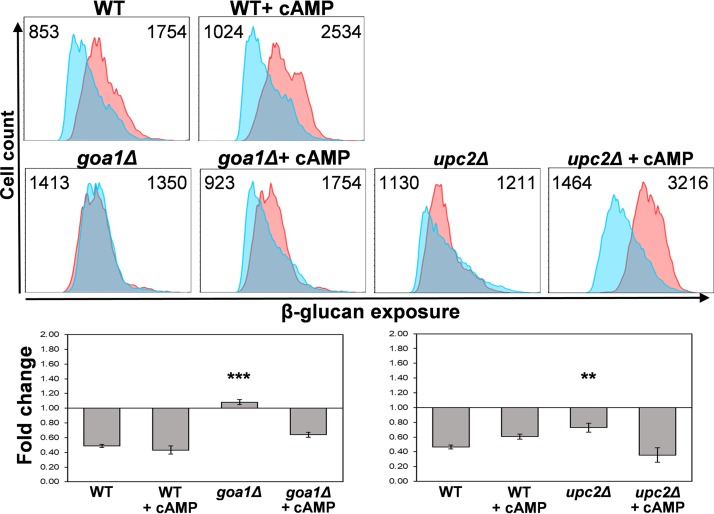
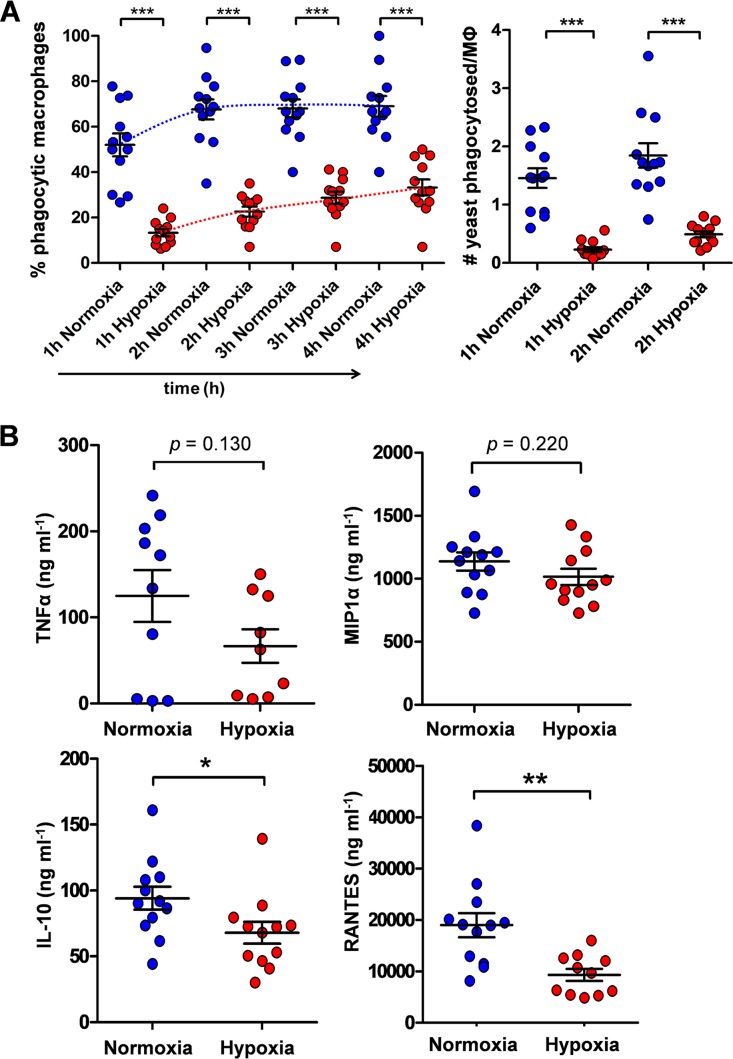
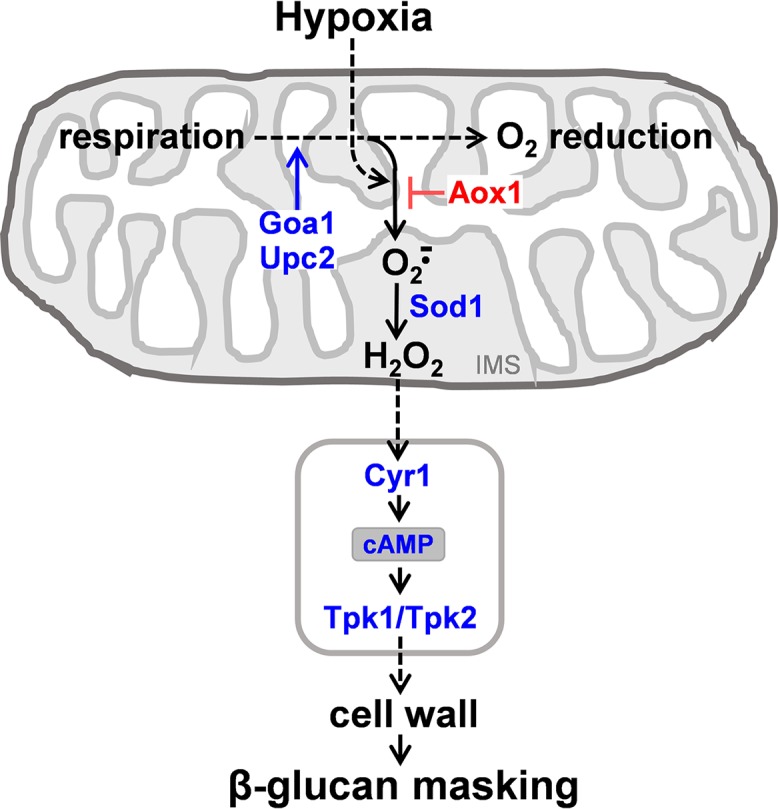
Organisms must adapt to changes in oxygen tension if they are to exploit the energetic benefits of reducing oxygen while minimizing the potentially damaging effects of oxidation. Consequently, organisms in all eukaryotic kingdoms display robust adaptation to hypoxia (low oxygen levels). This is particularly important for fungal pathogens that colonize hypoxic niches in the host. We show that adaptation to hypoxia in the major fungal pathogen of humans Candida albicans includes changes in cell wall structure and reduced exposure, at the cell surface, of β-glucan, a key pathogen-associated molecular pattern (PAMP). This leads to reduced phagocytosis by murine bone marrow-derived macrophages and decreased production of IL-10, RANTES, and TNF-α by peripheral blood mononuclear cells, suggesting that hypoxia-induced β-glucan masking has a significant effect upon C. albicans-host interactions. We show that hypoxia-induced β-glucan masking is dependent upon both mitochondrial and cAMP-protein kinase A (PKA) signaling. The decrease in β-glucan exposure is blocked by mutations that affect mitochondrial functionality (goa1Δ and upc2Δ) or that decrease production of hydrogen peroxide in the inner membrane space (sod1Δ). Furthermore, β-glucan masking is enhanced by mutations that elevate mitochondrial reactive oxygen species (aox1Δ). The β-glucan masking defects displayed by goa1Δ and upc2Δ cells are suppressed by exogenous dibutyryl-cAMP. Also, mutations that inactivate cAMP synthesis (cyr1Δ) or PKA (tpk1Δ tpk2Δ) block the masking phenotype. Our data suggest that C. albicans responds to hypoxic niches by inducing β-glucan masking via a mitochondrial cAMP-PKA signaling pathway, thereby modulating local immune responses and promoting fungal colonization.IMPORTANCE Animal, plant, and fungal cells occupy environments that impose changes in oxygen tension. Consequently, many species have evolved mechanisms that permit robust adaptation to these changes. The fungal pathogen Candida albicans can colonize hypoxic (low oxygen) niches in its human host, such as the lower gastrointestinal tract and inflamed tissues, but to colonize its host, the fungus must also evade local immune defenses. We reveal, for the first time, a defined link between hypoxic adaptation and immune evasion in C. albicans As this pathogen adapts to hypoxia, it undergoes changes in cell wall structure that include masking of β-glucan at its cell surface, and it becomes better able to evade phagocytosis by innate immune cells. We also define the signaling mechanisms that mediate hypoxia-induced β-glucan masking, showing that they are dependent on mitochondrial signaling and the cAMP-protein kinase pathway. Therefore, hypoxia appears to trigger immune evasion in this fungal pathogen.

Keywords: Candida albicans; cAMP-protein kinase A signaling; cell wall; hypoxia; mitochondrial signaling; β-glucan masking.


Figures

FIG 1
FIG 1
Hypoxia affects the architecture of the C. albicans cell wall. (A) Oxygen levels under the normoxic (pink) and hypoxic (blue) growth conditions used in this study. Means and standard deviations from three independent replicate experiments are shown. (B) Transmission electron micrographs of the cell walls of wild-type C. albicans cells (SC5314; see Table S1 in the supplemental material) grown under these normoxic and hypoxic conditions. (C) Quantification of the thickness of the inner and outer layers of the C. albicans cell wall using ImageJ from TEM images of SC5314 cells such as those shown in panel B. Means and standard deviations from images of cells (n = >30) from three independent replicate experiments are shown. The data were analyzed using ANOVA with Tukey’s multiple-comparison test and are indicated by asterisks as follows: *, P ≤ 0.05; **, P ≤ 0.01; ***, P ≤ 0.001; ****, P ≤ 0.0001.
FIG 2
FIG 2
Hypoxia induces β-glucan masking in C. albicans. (A) Fluorescence microscopy of β-glucan exposure on C. albicans wild-type cells (SC5314: Table S1) grown under normoxic or hypoxic conditions and stained for exposed β-glucan (Fc-dectin-1; green), mannan (concanavalin A; red), and chitin (wheat germ agglutinin; blue). (B) Analysis of β-glucan exposure on C. albicans SC5314 cells grown under normoxic or hypoxic conditions by Fc-dectin-1 staining and flow cytometry. The median fluorescence intensity (MFI) for each population is indicated. (C) The fold change in β-glucan exposure for C. albicans SC5314 cells grown under hypoxic conditions was calculated relative to the values for control normoxic cells. Means and standard deviations from three independent replicate experiments are shown, and the data were analyzed using ANOVA with Tukey’s multiple-comparison test: *, P ≤ 0.05. (D) Quantification of hypoxia-induced β-glucan masking in C. albicans clinical isolates from four major clades: clade 1, SC5314; clade 2, IHEM16614; clade 3, J990102; clade 4, AM2005/0377 (Table S1). (E) Analysis of hypoxia-induced β-glucan masking in other pathogenic Candida species and in S. cerevisiae. Each box represents a different isolate (Table S1) (the data for C. albicans were taken from panel D). Masking was defined as a change in β-glucan exposure to <0.6 fold change (dark blue); partial masking was defined as a decrease in β-glucan exposure to between 0.6- and 0.8-fold change (light blue); no masking was defined as a change in β-glucan exposure between 0.8- and 1.2-old change decrease (white); β-glucan exposure was defined as an increase in β-glucan exposure to >1.4-fold change (pink).
FIG 3
FIG 3
Hypoxia-induced β-glucan masking is not dependent on Gpr1 or Crz1. Analysis of β-glucan exposure on C. albicans mutants by flow cytometry of Fc-dectin-1-stained cells grown under normoxic (pink) or hypoxic conditions (cyan). The median fluorescence intensity (MFI) for each population is shown at the top right and left of each panel, respectively: WT, wild type, SC5314; gpr1Δ, LR2; gpa2Δ, NM6; gpr1Δ gpa2Δ, NM23; crz11Δ, DSY2195 (Table S1). The wild-type control for each experiment is shown above the mutants examined in that same experiment. The gpr1Δ and gpa2Δ mutants (middle panels) were compared together in the same experiment with the wild-type control (upper left panel), whereas the crz1Δ mutant (middle panel) was compared with wild-type cells in a different experiment (upper right panel). The fold changes in β-glucan exposure for each strain (lower panels) were calculated by dividing the MFI under hypoxic conditions by the MFI for the corresponding normoxic cells. Means and standard deviations from three independent replicate experiments are shown, and the data were analyzed using ANOVA with Tukey’s multiple-comparison test: *, P ≤ 0.05; **, P ≤ 0.01; ***, P ≤ 0.001.
FIG 4
FIG 4
Hypoxia-induced β-glucan masking is not dependent on key regulators of morphogenesis, cell integrity, or stress adaptation. Analysis of β-glucan exposure on C. albicans mutants by flow cytometry of Fc-dectin-1-stained cells (upper panels) grown under normoxic (pink) or hypoxic conditions (cyan). Median fluorescence intensities (MFIs) for hypoxic and normoxic cell populations are shown (top right and left of each panel, respectively). The corresponding wild-type control is shown above each mutant. The fold change in β-glucan exposure (lower panels) for each strain was calculated by dividing the MFI under hypoxic conditions by the MFI for the control normoxic cells. Means and standard deviations from three independent replicate experiments are shown, and the data were analyzed using ANOVA with Tukey’s multiple-comparison test: *, P ≤ 0.05; **, P ≤ 0.01. (A) Select morphogenetic mutants are shown in WT (wild type) (SC5314) and efg1Δ (HLC52) and tec1Δ (CaAS18) mutants (Table S1). Additional mutants are shown in Fig. S1. (B) Cell integrity pathway in the WT (SN95) and mkc1Δ (CaLC700) cells. (C) Stress-activated protein kinase pathway in WT (SC5314) and ssk2Δ (JC482), pbs2Δ (JC74), and hog1Δ (JC50) mutants. The efg1Δ, ssk1Δ, and pbs2Δ strains were analyzed in the same experiment against the same wild-type control.
FIG 5
FIG 5
Hypoxia-induced β-glucan masking is dependent on cAMP-PKA signaling. Cytometric analysis of β-glucan exposure on C. albicans cAMP-PKA mutants by Fc-dectin-1 staining of cells grown under normoxic (pink) or hypoxic conditions (cyan) (upper panels). Median fluorescence intensities (MFIs) for hypoxic and normoxic cell populations are shown. The corresponding wild-type control is shown above each mutant: WT, wild type (SN152) and cyr1Δ (CR323), tpk1Δ, tpk2Δ, and tpk1Δ tpk2Δ mutants (Table S1). The fold change in β-glucan exposure (lower panels) for each strain was calculated by dividing the MFI under hypoxic conditions by the MFI for the corresponding control normoxic cells. Means and standard deviations from three independent replicate experiments are shown, and the data were analyzed using ANOVA with Tukey’s multiple-comparison test: *, P ≤ 0.05; **, P ≤ 0.01.
FIG 6
FIG 6
Mutations that perturb mitochondrial functionality affect hypoxia-induced β-glucan masking. Quantification of β-glucan exposure on C. albicans mutants by Fc-dectin-1 staining and flow cytometry of cells grown under normoxic (pink) or hypoxic conditions (cyan) (upper panels): WT, wild type (DAY185), ccr4Δ (YCAT39), aox1Δ (WH324), goa1Δ (GOA31), upc2Δ (UPC2M4A) (Table S1). Additional mutants are shown in Fig. S1. The cytometry data for the corresponding wild-type control is shown above each set of mutants analyzed in the same experiment. Median fluorescence intensities (MFIs) for hypoxic and normoxic cell populations are shown. The fold change in β-glucan exposure (lower panels) for each strain represents the MFI under hypoxic conditions divided by the MFI for the corresponding normoxic cells. Means and standard deviations from three independent replicate experiments are shown, and the data were analyzed using ANOVA with Tukey’s multiple-comparison test: *, P ≤ 0.05; **, P ≤ 0.01; ***, P ≤ 0.001.
FIG 7
FIG 7
Sod1 is required for hypoxia-induced β-glucan masking. C. albicans superoxide dismutase mutants were grown under normoxic (pink) or hypoxic conditions (cyan), stained with Fc-dectin-1, and analyzed by flow cytometry to examine their β-glucan exposure (upper panels). Median fluorescence intensities (MFIs) for hypoxic and normoxic cell populations are shown. The corresponding wild-type control is shown above each set of mutants, the triple sod4-6Δ mutant having been analyzed in a separate experiment from the other sodΔ mutants: WT, SC5314; sod1Δ, CA-IF003; sod2Δ, CA-IF007; sod3Δ, CA-IF011 single mutants; sod4/5/6Δ triple mutant, CA-IF070 (Table S1). The fold change in β-glucan exposure (lower panels) for each strain represents the MFI under hypoxic conditions relative to the MFI for the corresponding normoxic control. Means and standard deviations from three independent replicate experiments are shown, and the data were analyzed using ANOVA with Tukey’s multiple-comparison test: *, P ≤ 0.05.
FIG 8
FIG 8
Exogenous dibutyryl-cAMP suppresses the defects in hypoxia-induced β-glucan masking caused by mitochondrial mutants. C. albicans (wild type [SC5314] [Table S1]), goa1Δ (GOA31), and upc2Δ cells (UPC2M4A) were grown under normoxic (pink) or hypoxic conditions (cyan) for 5 h, as described above, with 0 or 5 mM dibutyryl-cAMP (cAMP). The cells were then stained with Fc-dectin-1 and analyzed by flow cytometry to quantify their β-glucan exposure (upper panels). Median fluorescence intensities (MFIs) are shown. The fold changes in β-glucan exposure are shown (lower panels): means and standard deviations from three independent replicate experiments are analyzed using ANOVA with Tukey’s multiple-comparison test: *, P ≤ 0.05; **, P ≤ 0.01; ***, P ≤ 0.001.
FIG 9
FIG 9
Growth under hypoxia attenuates immune responses against C. albicans. Wild-type C. albicans cells (SC5314 [Table S1]) were grown for 5 h under normoxic (blue) or hypoxic conditions (red) and fixed. (A) At t = 0, these C. albicans cells were mixed with murine bone marrow-derived macrophages (BMDMs) at a ratio of 3:1 (yeast cells/macrophages), and the host-fungus interactions monitored by time-lapse video microscopy. The proportion of BMDMs that had phagocytosed at least one C. albicans cell (percent phagocytic macrophages) was quantified at t = 1, 2, 3, and 4 h. Also, the number of C. albicans cells phagocytosed per BMDM were quantified at t = 1 and 2 h. (B) Duplicate samples of human PBMCs from 6 different individuals were mixed with the C. albicans cells (ratio of 5:1, yeast cells/PBMCs), and TNF-α, MIP-1α, IL-10, and RANTES levels were assayed after 24 h. These data were analyzed using ANOVA with Bonferroni’s post hoc test: *, P ≤ 0.05; **, P ≤ 0.01; ***, P ≤ 0.001.
FIG 10
FIG 10
Mechanisms by which hypoxia induces β-glucan masking in C. albicans. Combining our observations with those of others, we propose the following working model. Hypoxia triggers an increase in the formation of mitochondrial superoxide by the respiratory apparatus (57, 58). Inactivating Goa1 or Upc2, which promote mitochondrial functionality, reduces overall respiration rates and hence mitochondrial ROS production. The alternative oxidase (Aox1) acts to limit mitochondrial ROS production (60–62) and therefore inactivating Aox1 enhances the signal. Superoxide dismutase within the mitochondrial inner membrane space (IMS) converts superoxide into diffusible hydrogen peroxide, which leads to the generation of a mitochondrial signal that transduces to the cytoplasm (see text). This possibly leads to the activation of adenylyl cyclase (Cyr1) and cAMP-PKA (Tpk1/2) signaling, which triggers remodelling of the cell wall and masking of cell surface β-glucan by mechanisms that remain to be elaborated.

References

    1. Brown GD, Denning DW, Gow NA, Levitz SM, Netea MG, White TC. 2012. Hidden killers: human fungal infections. Sci Transl Med 4:165rv13. doi: 10.1126/scitranslmed.3004404. - DOI - PubMed
    1. Hardison SE, Brown GD. 2012. C-type lectin receptors orchestrate antifungal immunity. Nat Immunol 13:817–822. doi: 10.1038/ni.2369. - DOI - PMC - PubMed
    1. Erwig LP, Gow NA. 2016. Interactions of fungal pathogens with phagocytes. Nat Rev Microbiol 14:163–176. doi: 10.1038/nrmicro.2015.21. - DOI - PubMed
    1. Dambuza IM, Levitz SM, Netea MG, Brown GD. 2017. Fungal recognition and host defense mechanisms. Microbiol Spectr 5(4). - PMC - PubMed
    1. Lionakis MS, Levitz SM. 2018. Host control of fungal infections: lessons from basic studies and human cohorts. Annu Rev Immunol 36:157–191. doi: 10.1146/annurev-immunol-042617-053318. - DOI - PubMed

Publication types