. 2019 Feb;24(2):294-311.
doi: 10.1038/s41380-018-0292-1. Epub 2018 Nov 6.

Reversal of proliferation deficits caused by chromosome 16p13.11 microduplication through targeting NFκB signaling: an integrated study of patient-derived neuronal precursor cells, cerebral organoids and in vivo brain imaging

Affiliations

Reversal of proliferation deficits caused by chromosome 16p13.11 microduplication through targeting NFκB signaling: an integrated study of patient-derived neuronal precursor cells, cerebral organoids and in vivo brain imaging

Mandy Johnstone et al. Mol Psychiatry. 2019 Feb.

Abstract

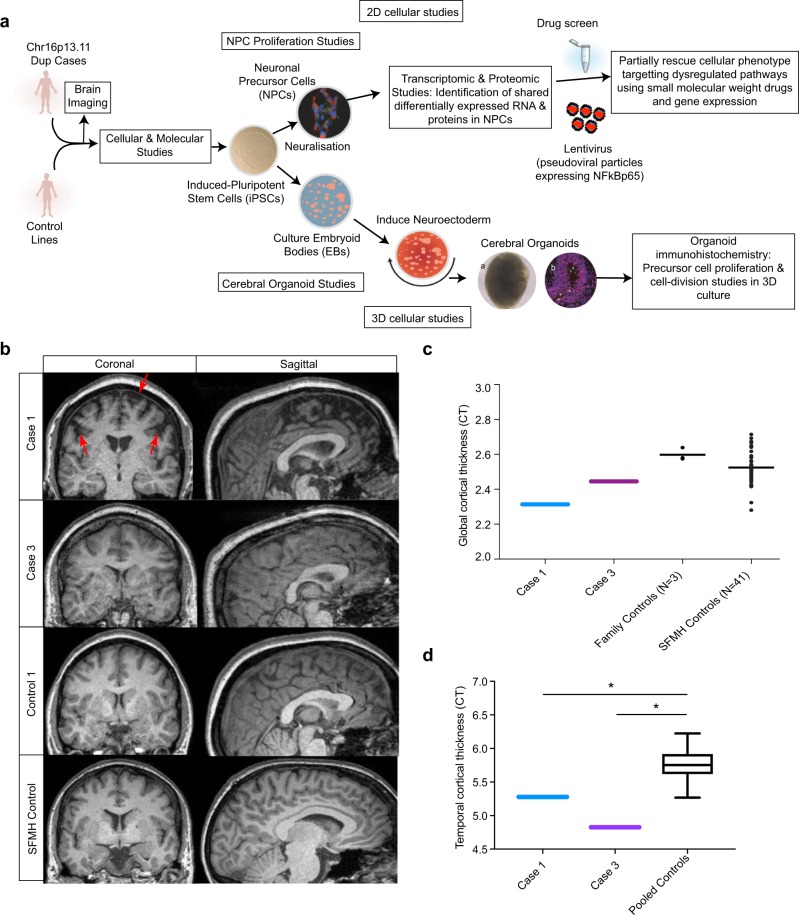
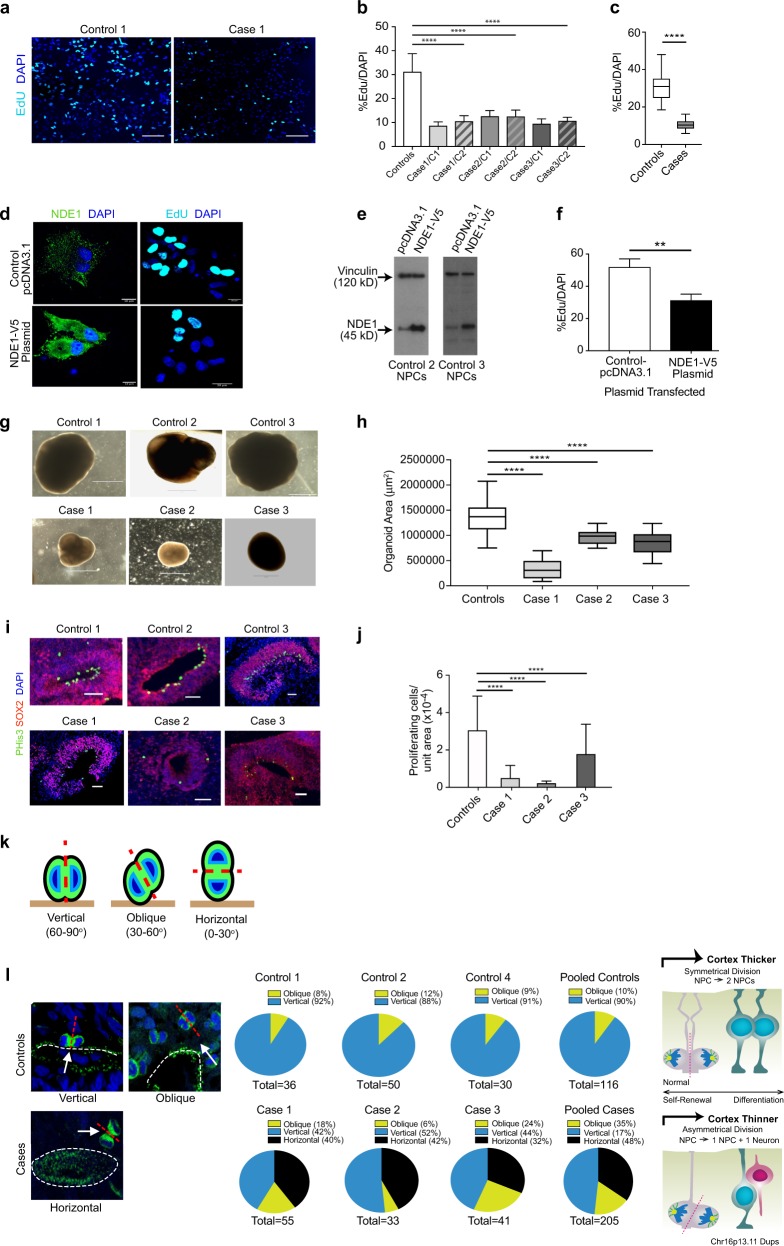
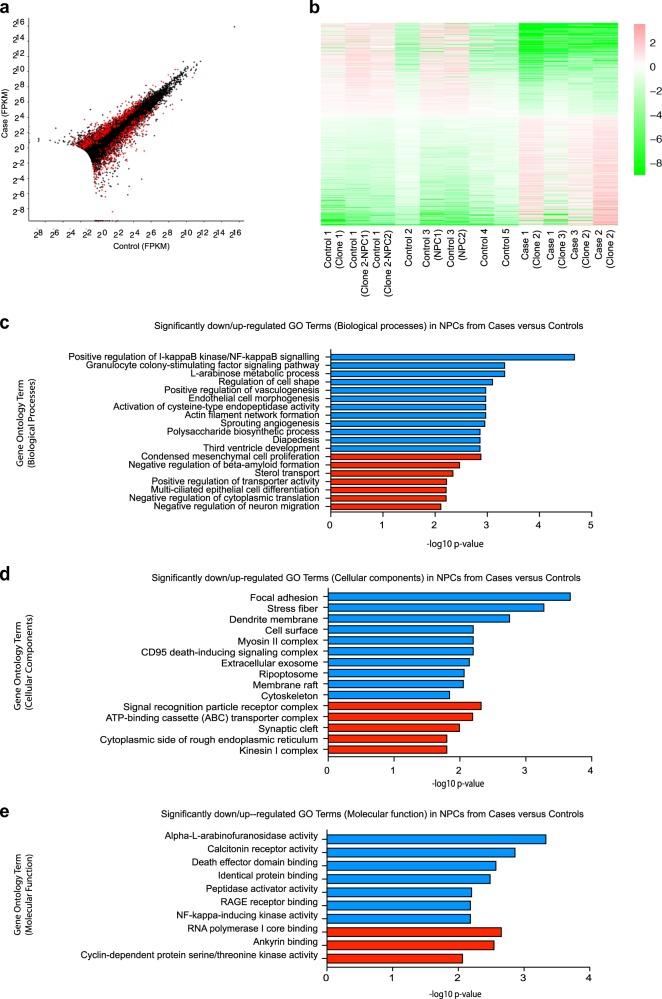
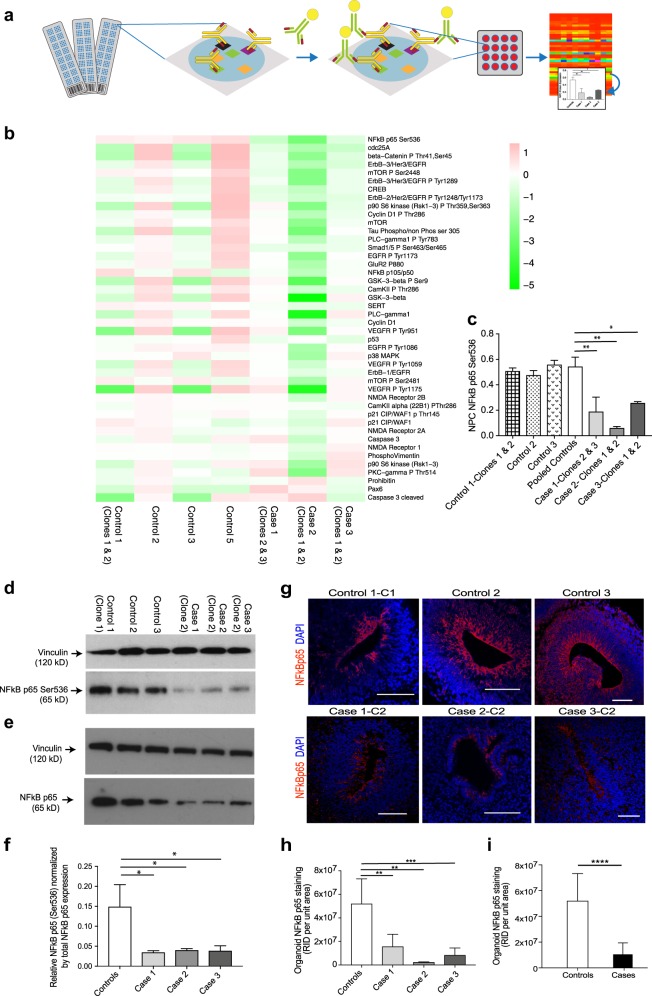
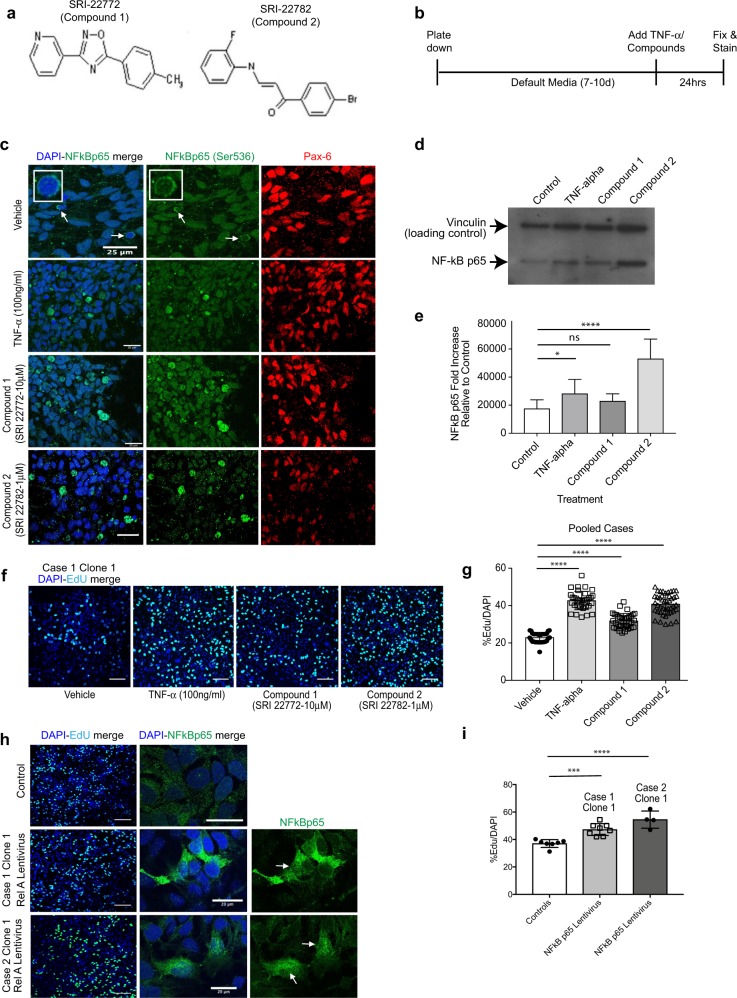
The molecular basis of how chromosome 16p13.11 microduplication leads to major psychiatric disorders is unknown. Here we have undertaken brain imaging of patients carrying microduplications in chromosome 16p13.11 and unaffected family controls, in parallel with iPS cell-derived cerebral organoid studies of the same patients. Patient MRI revealed reduced cortical volume, and corresponding iPSC studies showed neural precursor cell (NPC) proliferation abnormalities and reduced organoid size, with the NPCs therein displaying altered planes of cell division. Transcriptomic analyses of NPCs uncovered a deficit in the NFκB p65 pathway, confirmed by proteomics. Moreover, both pharmacological and genetic correction of this deficit rescued the proliferation abnormality. Thus, chromosome 16p13.11 microduplication disturbs the normal programme of NPC proliferation to reduce cortical thickness due to a correctable deficit in the NFκB signalling pathway. This is the first study demonstrating a biologically relevant, potentially ameliorable, signalling pathway underlying chromosome 16p13.11 microduplication syndrome in patient-derived neuronal precursor cells.


Conflict of interest statement

The authors declare that they have no conflict of interest.

Figures

Fig. 1
Fig. 1
Overview of the study design and MR imaging shows cortical deficits in carriers of the chr16p13.11 duplication. a Schematic summary of the study. b Coronal and sagittal MRI views demonstrate significant volume reduction of cortical brain tissue in an affected carrier of the 16p13.11 microduplication (case 1) evident in both the coronal (areas of significant cortical volume reduction are marked by red arrows) and sagittal views. Representative scans are also shown from an in-family control (control 1) and from an age and gender matched participant in the Scottish Mental Health Research study (SFMH) control group. Representative MRI images are also shown for case 3. Case 2 was unable to tolerate the MR scan due to extreme anxiety and agitation. c Global cortical thickness measures show significant differences between case 1 and a group of 41 control individuals from the SMHR study. Significance testing on the differences between case 1’s score and the SFMH control sample are as follows based on N-of-1 statistics [67]: control sample t = −2.305; one-tailed probability = 0.013; two-tailed probability = 0.026. Estimated percentage of normal population falling below individual's score = 1.32%. 95% lower confidence limit on the percentage = 0.17%. 95% upper confidence limit on the percentage = 4.14%. The value for mean global CT is also marked in this graph for case 3. d Temporal lobe cortical thickness measures show significant differences between cases 1 and 3 and a group of 41 control individuals from the SMHR study
Fig. 2
Fig. 2
Proliferation studies of NPCs and cerebral organoids. a Representative images of the mean proliferation values of case 1 compared to control 1. Scale bar: 50 µm. NPCs from case and control lines were plated down and grown in default media for 7–10 days prior to Click-IT EdU proliferation assays being undertaken. b NPCs from affected cases carrying the Chr16p13.11 microduplication show significantly reduced proliferation compared to control lines. Two NPC lines derived from two independent iPSC clones from each case were compared to a panel of NPC lines derived from five control individuals. c Graph showing values for pooled control NPC lines compared to pooled case NPC lines. Graphs shows mean  ± sem, controls: 31.26 ± 1.14%, cases 10.5 ± 0.298%, ****p < 0.0001 (unpaired two-tailed t-test with Welch’s correction). d NPCs from control individuals (control 2 and 3) were transfected either with full-length human V5-tagged NDE1 (pcDNA3.1NDE1-WT-V5 construct) or with the plasmid alone (pcDNA3.1). NDE1 staining shows intense signal of NDE1 in the cytoplasm of cells which had been transfected with the NDE1-V5 construct compared to NPCs transfected with control plasmid. e Immunoblotting shows that NPCs, derived from healthy controls and transfected with pcDNA NDE1-WT-V5 construct, expressed significantly more NDE1 compared to NPCs transfected with pcDNA3.1-control plasmid alone. Proliferation assays post-transfection: Electroporated cells were plated down and 48 h later EdU was added to measure the proliferation rate of transfected cells (right hand panel of d). f Graph shows that cells transfected with full-length wild-type human NDE1 display significantly reduced proliferation over a 10-h time-period compared to empty vector transfected cells. Graph shows mean  ± sem, **p < 0.005 (p = 0.0036, paired t-test; mean = 51.98% EdU/DAPI for empty vector control transfected NPCs compared to mean = 31.3% EdU/DAPI for NPCs transfected with full-length NDE1). g Representative images of cerebral organoids from controls and cases at 1 month of age. Scale bar: 1000 μm (1 mm). g  Plot of organoid sizes (organoid area μm2) from controls and cases at 1 month. Data represented as box plots with central bar representing mean  ± sem shown by whiskers; ****p < 0.0001, ordinary one-way ANOVA with Dunnett’s multiple correction test. Case 1 organoids are significantly smaller than controls (mean area of 326,550 μm2 for case 1 organoids compared to mean of 1,364,157 μm2 for controls. Case 2 and 3 organoids were less severely stunted in their growth rates with mean areas of 973,586 and 856,846 μm2, respectively). Organoid n = 30 + per case. i Representative images of proliferative zones of 1-month-old organoids from control compared to case iPSC lines. Scale bar: 50 µm. Graph of proliferating cells (P-His+ve) quantified in sectioned organoids showing pooled values of different clones for each case. Organoids were sectioned, stained and quantified using Image J by two independent blinded examiners. Family control organoids are from n = 3 individuals. Data represented as mean  ± sem; ****p < 0.0001, ordinary one-way ANOVA with Dunnett’s multiple correction test. Chr16p13.11 microduplications result in a switch from symmetrical to asymmetrical cell division. k Schematic diagram illustrating RG division in one of three orientations: 60–90 degrees (vertical); 30–60 degrees (oblique) and 0–30 degrees (horizontal). l Cerebral organoids were sectioned and stained with antibodies to phospho-histone H3 and/or phospho-vimentin. Quantification of RG division orientations is displayed in pie charts next to representative images for case and control organoids examined showing the proportion of cells in one of three bins (vertical, oblique or horizontal) n = 30–50 anaphase cells from a minimum of five cerebral organoids from each line. Schematic diagram (right) illustrating potential consequences to cortical thickness following a switch from symmetric to asymmetric cell division in affected carriers of Chr16p13.11 microduplications
Fig. 3
Fig. 3
RNA-sequencing data highlights differences in I-kappaB kinase and NF-kappaB signalling pathways as well as focal adhesion, regulation of cell shape, actin filament network, cytoskeleton, and alpha-l-arabinofuranosidase activity. a Representation of the differential expression results. Each cross is a gene, plotted with its mean abundance (measured in “fragments per kilobase per million mapped reads” (FPKM)) in cases versus controls. Very low abundance genes (those with mean FPKM across all samples < 0.5) have been filtered out. Red crosses are those genes that were called as differentially expressed. Genes with zero mean FPKM are drawn superimposed on the axes. b Heatmap of differentially expressed genes. Colours indicate log2(gene abundance in sample/mean abundance for this gene). Ordering is from most downregulated in cases to most upregulated. Graphs showing the most significantly downregulated (blue) or upregulated (red) gene ontology (GO) terms for (c) biological processes, (d) cellular components and (e) molecular function
Fig. 4
Fig. 4
NFκB p65 protein levels are significantly downregulated in NPCs and cerebral organoids from cases compared to controls. a Schematic overview of RPPA. b RPPA heatmap for the pooled data, i.e. each block is representing the value log2(protein abundance in line/mean abundance for this protein). Data are ordered by decreasing values of (mean protein abundance in cases)/(mean protein abundance in controls). Note that NFκB appears as the top “downregulated” protein in the cases. c Graph of anti-phospho-NFκB p65 (Ser536) expression in NPCs from case lines versus control lines determined by RPPA (Note that in the RPPA experiments we tested 2 clones for each of cases 1, 2 and 3; 2 clones for control 1; and one clone each from controls 2, 3 and 5. Each clone was run in triplicate). Statistics: mean  ± sem is shown; *p = 0.05; **p < 0.005 (ordinary one-way ANOVA with Dunnett’s multiple comparisons test). d Immunoblot of cell lysates from case-derived NPCs compared to controls stained with anti-phospho-NFκB p65 (Ser536) and anti-vinculin loading control antibody. e Immunoblot of cell lysates from case-derived NPCs compared to controls stained with total NFκB p65 antibody and anti-vinculin loading control antibody. f Quantification of immunoblots showing anti-phospho-NFκB p65 (Ser536) normalized by total NFκB p65 in pooled cases compared to controls. Statistics: mean  ± sem is shown; *p = 0.05 (ordinary one-way ANOVA with Dunnett’s multiple comparisons test). g Representative images of proliferative zones of 1-month-old organoids from individual control iPSC lines compared to individual case lines stained with anti-NFκB p65 (red). Scale bar: 100 µm. h Graph of NFκB p65 staining of cerebral organoids from three individual cases compared to three individual controls and also i graph of NFκB p65 staining of cerebral organoids from pooled cases compared to pooled controls. Raw integrated density (the sum of the values of the pixels per unit area of organoid) was determined by capturing organoid images at the same magnification and calculated using Image J. Statistics: mean  ± sem is shown; **p < 0.005; ***p < 0.0005; ****p < 0.0001 (Mann–Whitney test)
Fig. 5
Fig. 5
NFκB p65 activator compounds cause p65 nuclear translocation in NPCs and reverse the proliferation deficit in case-derived NPCs. a Structures of NFκB p65 activators compound 1 (SRI-22772) and compound 2 (SRI-22782). b NPCs (from controls and cases) were plated down in default media (without mitogens) and 7–10 days later TNF-α or compounds 1 or 2 were added to the media for 24 h. c NPCs treated with either TNF-α (positive control) or compounds 1 or 2 showed significantly increased anti-phospho-NFκB p65 (Ser536) localising to the nucleus compared to vehicle-treated. d Nuclear extracts were prepared from NPCs treated with vehicle (DMSO control), TNF-α and compounds 1 and 2 and immunoblotted with anti-phospho-NFκB p65 (Ser536). e Bands were quantified and normalised to the levels of vinculin (loading control). Compound 2 treatment resulted in significant increase in nuclear NFκB p65 Ser536 expression (ordinary one-way ANOVA. Values plotted are the mean  ± sem; *p < 0.05; ns non-significant; ****p < 0.0001). f Representative images of proliferation assays of case NPCs (case 1, clone 1) following treatment with vehicle (DMSO), TNF-α, compounds 1 and 2. g Graph showing proliferation of all case NPCs (pooled) showing significant rescue of proliferation deficits following treatment with TNF-α and compounds 1 and 2 (ordinary one-way ANOVA with Dunnett’s multiple comparison test. Values plotted are the mean  ± sem; ****p < 0.0001). Representative images of case NPCs infected with NFκB p65 (RELA) Lentivirus or vector alone (control) demonstrate that cells infected with RELA express increased NFκB p65 and exhibit increased proliferation i compared to NPCs from the same patient infected with the vector alone

Similar articles

Cited by

References

    1. ISC. Rare chromosomal deletions and duplications increase risk of schizophrenia. Nature. 2008;455:237–41. doi: 10.1038/nature07239. - DOI - PMC - PubMed
    1. Kirov G, Grozeva D, Norton N, Ivanov D, Mantripragada KK, Holmans P, et al. Support for the involvement of large copy number variants in the pathogenesis of schizophrenia. Hum Mol Genet. 2009;18:1497–503. doi: 10.1093/hmg/ddp043. - DOI - PMC - PubMed
    1. Ingason A, Rujescu D, Cichon S, Sigurdsson E, Sigmundsson T, Pietilainen OP, et al. Copy number variations of chromosome 16p13.1 region associated with schizophrenia. Mol Psychiatry. 2011;16:17–25. doi: 10.1038/mp.2009.101. - DOI - PMC - PubMed
    1. Mefford HC, Clauin S, Sharp AJ, Moller RS, Ullmann R, Kapur R, et al. Recurrent reciprocal genomic rearrangements of 17q12 are associated with renal disease, diabetes, and epilepsy. Am J Hum Genet. 2007;81:1057–69. doi: 10.1086/522591. - DOI - PMC - PubMed
    1. Ullmann R, Turner G, Kirchhoff M, Chen W, Tonge B, Rosenberg C, et al. Array CGH identifies reciprocal 16p13.1 duplications and deletions that predispose to autism and/or mental retardation. Hum Mutat. 2007;28:674–82. doi: 10.1002/humu.20546. - DOI - PubMed

Publication types

MeSH terms