. 2018 Nov 6;8(1):16373.
doi: 10.1038/s41598-018-34744-6.

Super-resolution imaging using nano-bells

Affiliations

Super-resolution imaging using nano-bells

Rafael Fuentes-Domínguez et al. Sci Rep. .

Abstract

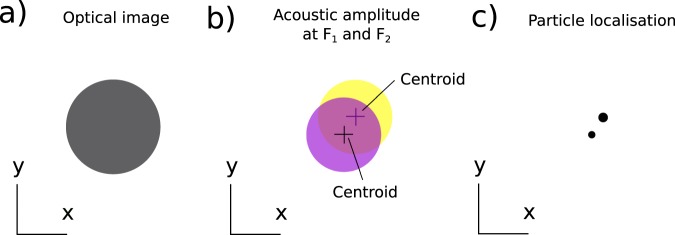
In this paper we demonstrate a new scheme for optical super-resolution, inspired, in-part, by PALM and STORM. In this scheme each object in the field of view is tagged with a signal that allows them to be detected separately. By doing this we can identify and locate each object separately with significantly higher resolution than the diffraction limit. We demonstrate this by imaging nanoparticles significantly smaller than the optical resolution limit. In this case the "tag" we have used is the frequency of vibration of nanoscale "bells" made of metallic nanoparticles whose acoustic vibrational frequency is in the multi-GHz range. Since the vibration of the particles can be easily excited and detected and the frequency is directly related to the particle size, we can separate the signals from many particles of sufficiently different sizes even though they are smaller than, and separated by less than, the optical resolution limit. Using this scheme we have been able to localise the nanoparticle position with a precision of ~3 nm. This has many potential advantages - such nanoparticles are easily inserted into cells and well tolerated, the particles do not bleach and can be produced easily with very dispersed sizes. We estimate that 50 or more different particles (or frequency channels) can be accessed in each optical point spread function using the vibrational frequencies of gold nanospheres. However, many more channels may be accessed using more complex structures (such as nanorods) and detection techniques (for instance using polarization or wavelength selective detection) opening up this technique as a generalized method of achieving super-optical resolution imaging.


Conflict of interest statement

The authors declare no competing interests.

Figures

Figure 1
Figure 1
How nano-bells work. (a) Shows a representation of an optical image of metallic particles where the particles can not be resolved. (b) Shows a representation of an acoustic amplitude image of the same particles at a single frequency F1 and F2. (c) Localisation of the particles from the centroids of the PSF of each frequency. The centroids obtained at frequencies F1 and F2 lead to the localisation of the particles with greater precision than the optical system used to image them. The size is obtained by the vibrational frequency of each particle.
Figure 2
Figure 2
Modelled response of nano-bells. (left) Schematic of the experiment from the nanoparticles’ point of view. The particle sits on the transparent substrate and is illuminated by the pump beam and probe beam from below. The scattered light is collect in transmission from above. (a) The optical absorption cross section for the gold nanoparticles used in the experiment calculated using Mie theory for the pump wavelength. (b) The optical scattering cross section calculated for the probe wavelength, (c) the derivative of (b) with respect to size, and (d) the vibration frequencies of the particles as a function of size.
Figure 3
Figure 3
(a) Raw signal centred on the particle, (b) signal after processing to extract the change in scattering cross section as the particle vibrates (inset frequency content), (c) SEM of the particle and (d) optical image of same particle. Scale bars in (c) and (d) 500 nm.
Figure 4
Figure 4
Images of three particles. (a) Optical image, (b) SEM, (c) acoustic amplitude, (d) acoustic frequency and (e) localisation of the particles with better precision than the diffraction limit. One is well separated from the others and can easily be resolved optically. The other two are ~200 nm apart and cannot be resolved optically, however, the acoustic signals clearly identifies the size and location of the particles allowing accurate reconstruction of the image shown in the SEM.
Figure 5
Figure 5
(Left) 50 × 50 μm area image showing ~150 nanoparticles and their predicted sizes where the particles are shown at 300% of their measured size for clarity at this scale. (Right) (a,c,e) SEMs of nanoparticles overlaid with their optical images and (b,d,f) SEMs of the nanoparticles shown in (a,c,e) overlaid with the acoustic reconstruction where super-optical resolution is shown. False colour in (b,d,f) indicates particle size on the same color scale as the left figure.
Figure 6
Figure 6
Schematic of the super-resolving phononic microscope.

References

    1. Rayleigh L. Xxxi. investigations in optics, with special reference to the spectroscope. The London, Edinburgh, Dublin Philos. Mag. J. Sci. 1879;8:261–274. doi: 10.1080/14786447908639684. - DOI
    1. Pérez-Cota, F. et al. High resolution 3d imaging of living cells with sub-optical wavelength phonons. Sci. reports6 (2016). - PMC - PubMed
    1. Hell SW. Nanoscopy with focused light (nobel lecture) Angewandte Chemie Int. Ed. 2015;54:8054–8066. doi: 10.1002/anie.201504181. - DOI - PubMed
    1. Hell SW, Wichmann J. Breaking the diffraction resolution limit by stimulated emission: stimulated-emissiondepletion fluorescence microscopy. Opt. Lett. 1994;19:780–782. doi: 10.1364/OL.19.000780. - DOI - PubMed
    1. Rust MJ, Bates M, Zhuang X. Sub-diffraction-limit imaging by stochastic optical reconstruction microscopy (storm) Nat. methods. 2006;3:793–796. doi: 10.1038/nmeth929. - DOI - PMC - PubMed

Publication types