. 2018 Nov 6;8(1):16410.
doi: 10.1038/s41598-018-34745-5.

Temporal changes of Sall4 lineage contribution in developing embryos and the contribution of Sall4-lineages to postnatal germ cells in mice

Affiliations

Temporal changes of Sall4 lineage contribution in developing embryos and the contribution of Sall4-lineages to postnatal germ cells in mice

Naoyuki Tahara et al. Sci Rep. .

Abstract

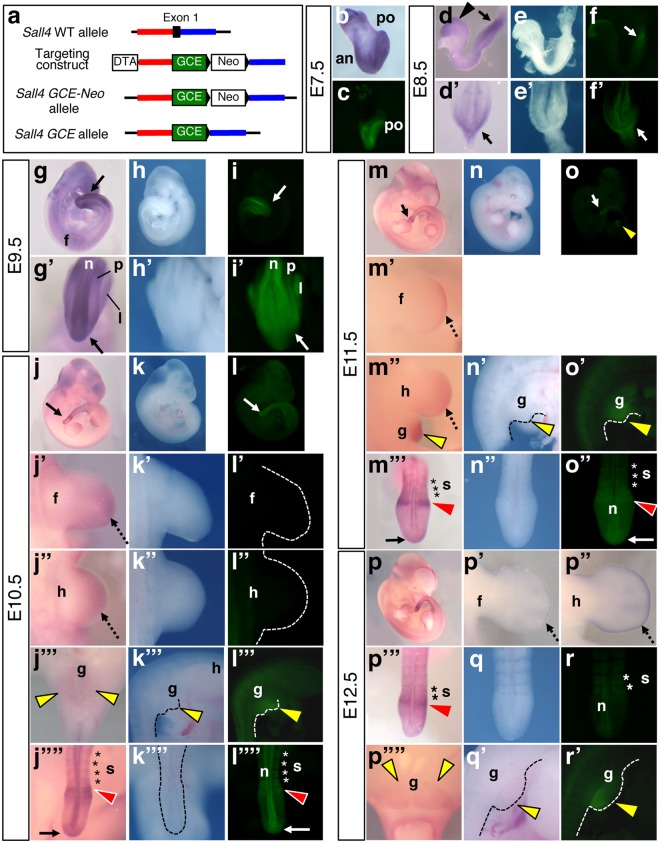
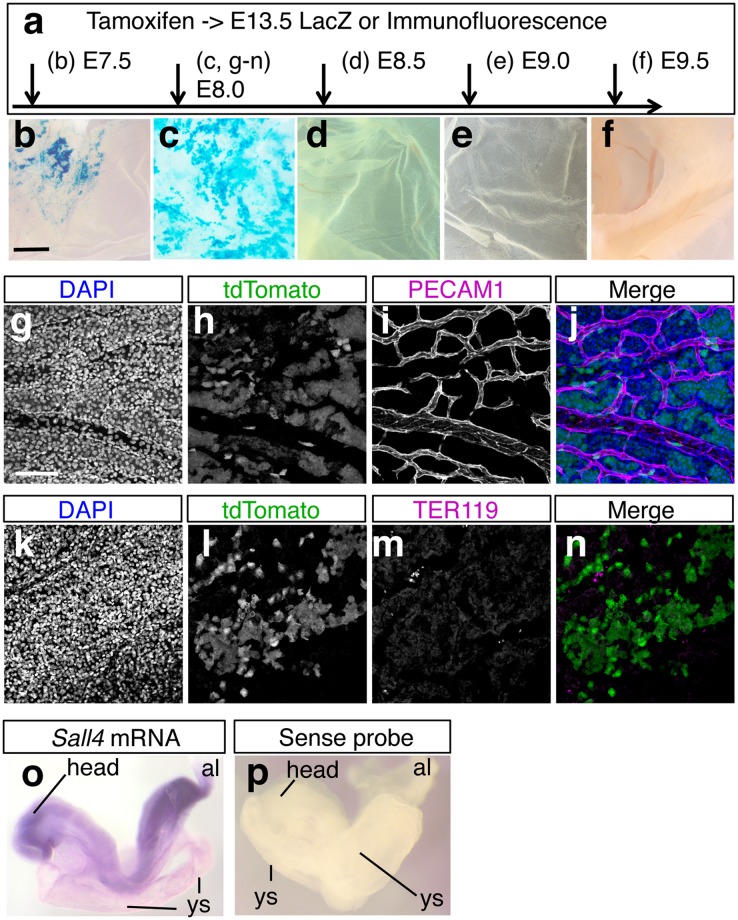
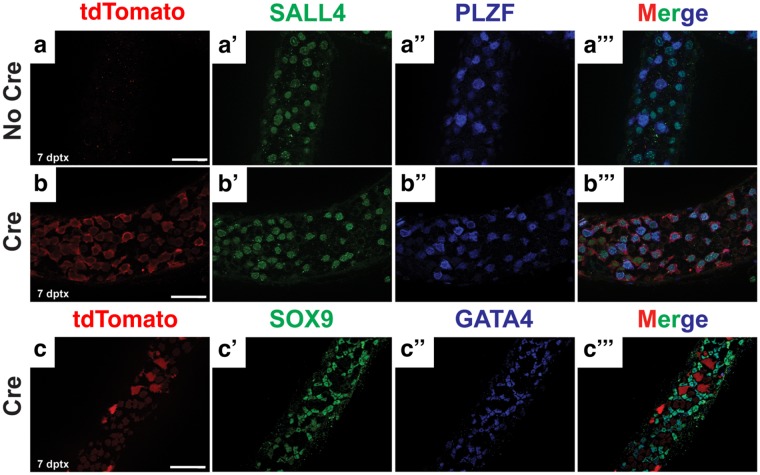
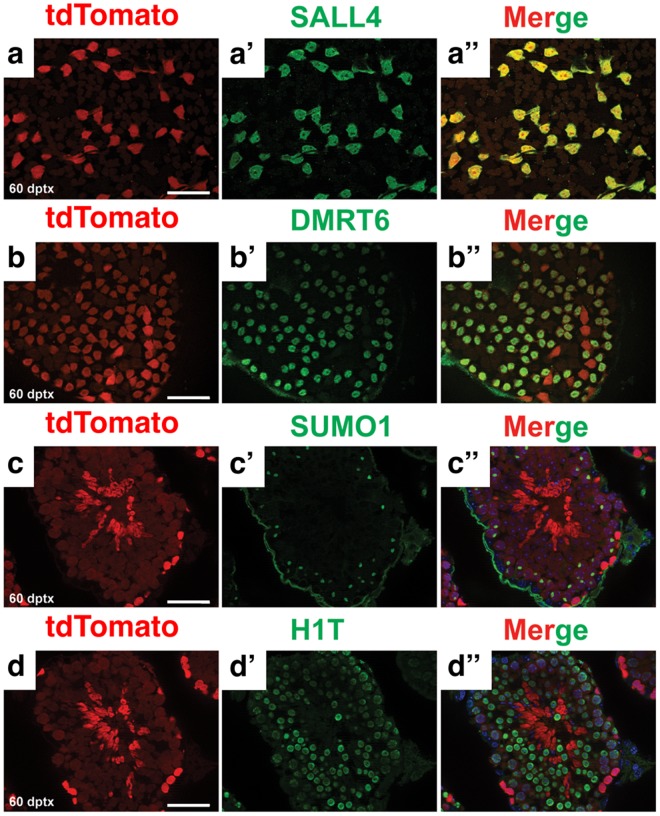
Mutations in the SALL4 gene cause human syndromes with defects in multiple organs. Sall4 expression declines rapidly in post-gastrulation mouse embryos, and our understanding of the requirement of Sall4 in animal development is still limited. To assess the contributions of Sall4 expressing cells to developing mouse embryos, we monitored temporal changes of the contribution of Sall4 lineages using a Sall4 GFP-CreERT2 knock-in mouse line and recombination-dependent reporter lines. By administering tamoxifen at various time points we observed that the contributions of Sall4 lineages to the axial level were rapidly restricted from the entire body to the posterior part of the body. The contribution to forelimbs, hindlimbs, craniofacial structures and external genitalia also declined after gastrulation with different temporal dynamics. We also detected Sall4 lineage contributions to the extra-embryonic tissues, such as the yolk sac and umbilical cord, in a temporal manner. These Sall4 lineage contributions provide insights into potential roles of Sall4 during mammalian embryonic development. In postnatal males, long-term lineage tracing detected Sall4 lineage contributions to the spermatogonial stem cell pool during spermatogenesis. The Sall4 GFP-CreERT2 line can serve as a tool to monitor spatial-temporal contributions of Sall4 lineages as well as to perform gene manipulations in Sall4-expressing lineages.


Conflict of interest statement

The authors declare no competing interests.

Figures

Figure 1
Figure 1
The GFP signals of Sall4 GCE embryos were detectable in cells/tissues with high levels of Sall4 mRNA expression. (a) Schematic of targeting strategy to knock-in the GCE cassette into the exon 1 of the Sall4 gene. (b,d,d’,g,g’,j–j””,m–m’”,p–p””) Sall4 mRNA expression pattern of indicated stages by whole mount in situ hybridization. Bright field images (e,e’,h,h’,k–k””,n–n”,q,q’) and the GPF images (f,f’,i,i’,l–l””,o–o”,r,r’) of Sall4 GCE embryos at indicated stages. At E8.5 (d–f’) and E9.5 (g–i’), arrowheads and arrows point to the head and the posterior tip of the body. Panels in b,c,d,e,f,g,h and i show lateral views of the whole embryo. Panels in d’,e’,f’,g’,h’ and i’ show dorsal views of the posterior part of the body. At E10.5–E12.5, dashed black arrows point to the signal at the distal part of the limb buds in dorsal views with the anterior to the top (j’,j”,m’,m”,p’,p”). Arrows point to the posterior tip of the tail (j,j””,l,l””,m,m”’,o,o”). Red arrowheads point to the anterior presomitic mesoderm in dorsal views (j””,l””,m’”,o”,p’”). Yellow arrowheads point to the external genital primordium (j’”,k’”,l’”,m”,n’,o,o’,p””,q’,r’). The genital primordia are shown in the ventral views (j’”,p””) or lateral views (k’”,l’”,m”,n’,o’,q’,r’). Asterisks in j””,l””,m’”,o”,p’” and r indicate signals in the somites. Abbreviations. an: anterior, f: forelimb bud, g: external genital primordium, h: hindlimb bud, l: lateral plate mesoderm, n: neural tube, p: paraxial mesoderm, po: posterior, s: somites.
Figure 2
Figure 2
Sall4 lineage contribution to E13.5 embryos. Schematic of tamoxifen injections at different time points of embryonic development. The stages of tamoxifen injection are indicated. (bg) Whole mount images of LacZ-stained E13.5 embryos. Red arrowheads in c-g point to the anterior margin of LacZ staining. The embryo in panel e exhibits exencephaly. (b’–g’) Dorsal views of forelimbs of embryos shown in (bg). Black arrowheads in e’ point to sparsely stained LacZ-positive areas. In panel b’, the autopod region (au) and the zeugopod region (ze) are indicated by brackets. (b”–g”) Dorsal views of hindlimbs of embryos shown in (bg). Black arrowhead and arrow in f” point to LacZ-positive anterior digit and anterior zeugopod, respectively. Anterior is to the top and posterior is to the bottom in b’–g’ and b”–g”. Abbreviations: au: autopod region, fl: forelimbs, hl: hindlimbs, ze: zeugopod region. Scale bar in panel b: 1 mm. Panels b to g are in the same scale.
Figure 3
Figure 3
Sall4 lineage contribution to the craniofacial structures. Schematic of tamoxifen injections at different time points of embryonic development. (b–d’) Lateral views (bd) and frontal views (b’–d’) of Sall4 mRNA expression at indicated stages. (e–g’) Lateral views (eg) and frontal views (e’–g’) of LacZ stained E13.5 embryos. Asterisks indicate LacZ signals in the midbrain. Black arrowheads and arrows point to signals in the nasal region and the lower jaw, respectively. Abbreviations: ba1: branchial arch 1, fb: forebrain, fnp: front nasal process, m: midbrain, mnp: medial nasal process, np: nasal process. Scale bar in panel e: 1 mm. Panels e to g’ are in the same scale.
Figure 4
Figure 4
Sall4 lineage contribution to the external genital primordium. Schematic of tamoxifen injections at different time points of embryonic development. (b–g’) Lateral views (bg) and frontal views (b’–g’) of external genitalia of LacZ stained E13.5 embryos. Black arrowheads point to the broadly stained external genitalia, labelled at E7.5–E9.5. Arrows point to the LacZ-stained posterior of external genitalia, labeled at E10.5–12.5. Scale bar in panel b: 1 mm. Panels b to g’ are in the same scale.
Figure 5
Figure 5
Sall4 lineage contribution to the yolk sac stroma in a narrow time window. Schematic of tamoxifen injections at different time points of embryonic development. (bf) LacZ-stained yolk sac. The staining was broadly detected when tamoxifen was injected at E8.0. Scale bar in panel b: 1 mm. Panels b to f are in the same scale. (gn) Immunofluorescence images of DAPI (g,k), tdTomato (h,l), PECAM (i) and TER119 (m). (j) and (n) show merged images of (gi) and (km), respectively. The tdTomato signals do not overlap with PECAM and TER119. Scale bar in panel g: 100 µm. Panels g to n are in the same scale. (o,p) Lateral views of E8.5 embryos hybridized with antisense (o) or sense (p) Sall4 probes. Sall4 is expressed in the yolk sac (ys) and the allantois (al), in addition to the embryo. Control sense probe generated no signals. Abbreviations. al: allantois, ys: yolk sac.
Figure 6
Figure 6
Sall4 lineage contribution to peri-vascular mesenchyme in the umbilical cord. Schematic of tamoxifen injections at different time points of embryonic development. (bd) Cross section of LacZ-stained umbilical cord. Scale bar in panel b: 100 µm. Panels b to d are in the same scale. (eh) Immunofluorescence images of DAPI (e), tdTomato (f), VEGFR2 (g) and merged image (h). The tdTomato signals do not overlap with VEGFR2. Scale bar in panel e: 100 µm. Panels e to h are in the same scale. (il) Whole mount in situ hybridization of Sall4 (i,k) and Tbx4 (j,l) of E8.5 embryos. Ventral views (i,j) and lateral views (k,l) of the allantois are shown. (mq) Double detection of SALL4 immunoreactivities (magenta) and Tbx4 mRNA (green) on allantois sections. Panels n–q show closeup of the dotted square in (m). Panels n, o and p are shown in a black/white mode. Dotted lines in (oq) indicate the border between the allantois and the embryo. Scale bar in m: 200 µm. Abbreviation. al: allantois, em: embryo, ne: neuroectoderm of the head region, ve: vessel.
Figure 7
Figure 7
Sall4 GCE is active in undifferentiated spermatogonia. Immunofluorescence of wholemount seminiferous tubules. (a–a’”) Rosa26-tdTomato and (b–b’”,c–c’”) Sall4 GCE; R26-tdTomato testis 7 days post-tamoxifen treatment stained for tdTomato (red), SALL4 (green), SOX9 (green), PLZF (blue), GATA4 (blue). Scale bars in panels a,b,c: 100 µm. All panels are in the same scale.
Figure 8
Figure 8
Sall4 GCE is active in SSCs. Immunofluorescence of wholemount (a–b”) and cross sections (c–d”) of seminiferous tubules. Sall4 GCE; R26-tdTomato testis 60 days post-tamoxifen treatment stained for tdTomato (red), SALL4 (green), DMRT6 (green), SUMO1 (green) and H1T (green). Scale bars in panel a,b,c,d: 100 µm. All panels are in the same scale.

References

    1. De Celis JF, Barrio R. Regulation and function of Spalt proteins during animal development. The International journal of developmental biology. 2009;53:1385–1398. doi: 10.1387/ijdb.072408jd072408jd. - DOI - PubMed
    1. Sweetman D, Munsterberg A. The vertebrate spalt genes in development and disease. Developmental biology. 2006;293:285–293. doi: 10.1016/j.ydbio.2006.02.009. - DOI - PubMed
    1. Kohlhase J, et al. Okihiro syndrome is caused by SALL4 mutations. Human molecular genetics. 2002;11:2979–2987. doi: 10.1093/hmg/11.23.2979. - DOI - PubMed
    1. Al-Baradie Raidah, Yamada Koki, St. Hilaire Cynthia, Chan Wai-Man, Andrews Caroline, McIntosh Nathalie, Nakano Motoi, Martonyi E. Jean, Raymond William R., Okumura Sada, Okihiro Michael M., Engle Elizabeth C. Duane Radial Ray Syndrome (Okihiro Syndrome) Maps to 20q13 and Results from Mutations in SALL4, a New Member of the SAL Family. The American Journal of Human Genetics. 2002;71(5):1195–1199. doi: 10.1086/343821. - DOI - PMC - PubMed
    1. Becker K, Beales PL, Calver DM, Matthijs G, Mohammed SN. Okihiro syndrome and acro-renal-ocular syndrome: clinical overlap, expansion of the phenotype, and absence of PAX2 mutations in two new families. J Med Genet. 2002;39:68–71. doi: 10.1136/jmg.39.1.68. - DOI - PMC - PubMed

Publication types