. 2018 Nov 6;8(1):16370.
doi: 10.1038/s41598-018-34760-6.

The effects of in ovo administration of encapsulated Toll-like receptor 21 ligand as an adjuvant with Marek's disease vaccine

Affiliations

The effects of in ovo administration of encapsulated Toll-like receptor 21 ligand as an adjuvant with Marek's disease vaccine

Jegarubee Bavananthasivam et al. Sci Rep. .

Abstract

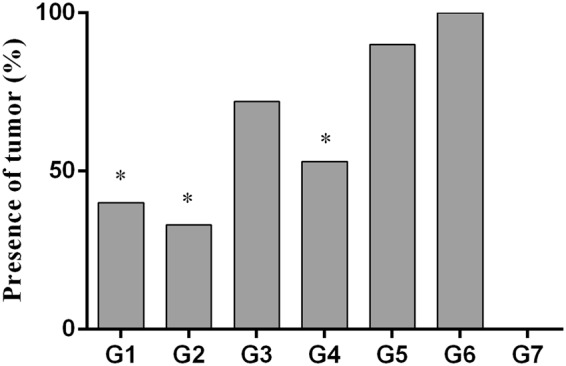
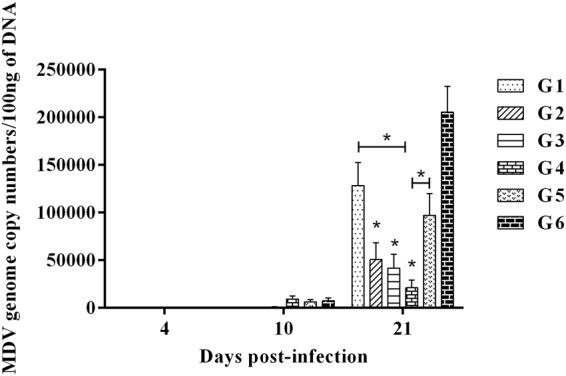
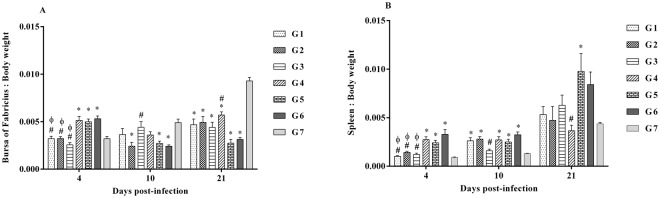
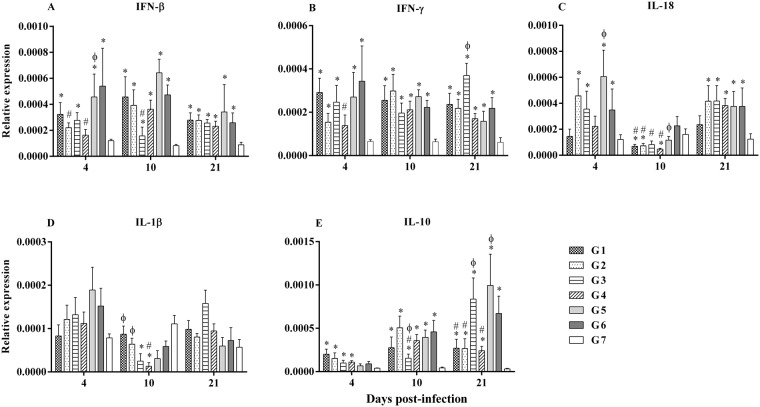
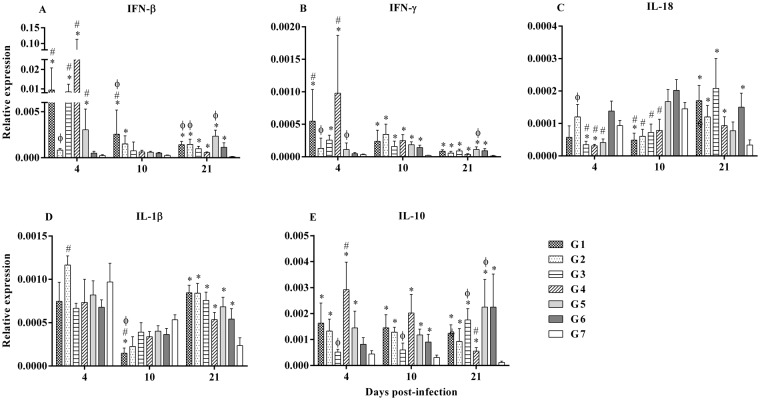
Marek's Disease Virus (MDV) is the causative agent of a lymphoproliferative disease, Marek's disease (MD) in chickens. MD is only controlled by mass vaccination; however, immunity induced by MD vaccines is unable to prevent MDV replication and transmission. The herpesvirus of turkey (HVT) vaccine is one of the most widely used MD vaccines in poultry industry. Vaccines can be adjuvanted with Toll-like receptor ligands (TLR-Ls) to enhance their efficacy. In this study, we examined whether combining TLR-Ls with HVT can boost host immunity against MD and improve its efficacy. Results demonstrated that HVT alone or HVT combined with encapsulated CpG-ODN partially protected chickens from tumor incidence and reduced virus replication compared to the control group. However, encapsulated CpG-ODN only moderately, but not significantly, improved HVT efficacy and reduced tumor incidence from 53% to 33%. Further investigation of cytokine gene profiles in spleen and bursa of Fabricius revealed an inverse association between interleukin (IL)-10 and IL-18 expression and protection conferred by different treatments. In addition, the results of this study raise the possibility that interferon (IFN)-β and IFN-γ induced by the treatments may exert anti-viral responses against MDV replication in the bursa of Fabricius at early stage of MDV infection in chickens.


Conflict of interest statement

The authors declare no competing interests.

Figures

Figure 1
Figure 1
Presence of tumors in different treatment groups. Experimental groups were as follows: G1-ECpG and HVT were administered at ED18 and the second dose of ECpG was injected at 14 dpi. G2-ECpG and HVT were administered at ED18. G3-HVT was administered at ED18 and ECpG was given at 14 dpi. G4-HVT was administered at ED18. G5-ECpG was injected at 14 dpi. G6-Untreated, MDV-infected group. G7-PBS control group. Chickens in all groups were infected with MDV at d5 except G7. Presence of tumors was recorded at 21 dpi. Data were statistically analyzed by Fisher’s exact test in GraphPad Prism 6.04. p ≤ 0.05 (*) was considered statistically significant compared to G6.
Figure 2
Figure 2
MDV genome copy numbers in feathers in different treatment groups. MDV genome copy numbers per 100 ng of DNA were calculated from feathers collected at 4, 10 and 21 dpi. The different experimental groups were: G1-ECpG and HVT were administered at ED18 and the second dose of ECpG was injected at 14 dpi. G2-ECpG and HVT were administered at ED18. G3-HVT was administered at ED18 and ECpG was given at 14 dpi. G4-HVT was administered at ED18. G5-ECpG was injected at 14 dpi. G6-Untreated, MDV-infected group. G7-PBS control group. Chickens in all groups were infected with MDV at d5 except G7. Data were statistically analyzed by Kruskal-Wallis test in GraphPad Prism 6.04. p ≤ 0.05 was considered statistically significant (*). Comparisons were made between groups as indicated or with positive control group G6. Error bars indicate the standard errors of the mean.
Figure 3
Figure 3
BF:BW and spleen:BW ratios in different treatment groups. BF, spleen and body weight were recorded at 4, 10 and 21 dpi, and (A) BF:BW and (B) Spleen:BW ratios were calculated. The different experimental groups were: G1-ECpG and HVT were administered at ED18 and the second dose of ECpG was injected at 14 dpi. G2-ECpG and HVT were administered at ED18. G3-HVT was administered at ED18 and ECpG was given at 14 dpi. G4-HVT was administered at ED18. G5-ECpG was injected at 14 dpi. G6-Untreated, MDV-infected group. G7-PBS control group. Chickens in all groups were infected with MDV at d5 except G7. Data were statistically analyzed by one-way ANOVA and followed by Tukey’s multiple comparison test in GraphPad Prism 6.04. p ≤ 0.05 was considered statistically significant when compared to G7 (*) or G6 (#) or G4 (ϕ). Error bars indicate the standard errors of the mean.
Figure 4
Figure 4
Relative expression of genes in spleen in different treatment groups. (A) IFN-β (B) IFN-γ (C) IL-18 (D) IL-1β and (E) IL-10 expression were determined relative to β-actin at 4, 10 and 21 dpi in spleen. The different experimental groups were: G1-ECpG and HVT were administered at ED18 and the second dose of ECpG was injected at 14 dpi. G2-ECpG and HVT were administered at ED18. G3-HVT was administered at ED18 and ECpG was given at 14 dpi. G4-HVT was administered at ED18. G5-ECpG was injected at 14 dpi. G6-Untreated, MDV-infected group. G7-PBS control group. Chickens in all groups were infected with MDV at d5 except G7. Data were logarithmically transformed and analyzed using general linear model (Proc GLM) and followed by Duncan’s multiple range test in Statistical Analysis Software version 9.3 (SAS, Cary, NC). The Kruskal-Wallis test was used when data were not normally distributed. Gene expression results were presented as geometric mean of relative expression ± standard error of mean. p ≤ 0.05 was considered statistically significant when compared to G7 (*) or G6 (#) or G4 (ϕ).
Figure 5
Figure 5
Relative expression of genes in the bursa of Fabricius in different treatment groups. (A) IFN-β (B) IFN-γ (C) IL-18 (D) IL-1β and (E) IL-10 expression were determined relative to β-actin at 4, 10 and 21 dpi in BF. The different experimental groups were: G1-ECpG and HVT were administered at ED18 and the second dose of ECpG was injected at 14 dpi. G2-ECpG and HVT were administered at ED18. G3-HVT was administered at ED18 and ECpG was given at 14 dpi. G4-HVT was administered at ED18. G5-ECpG was injected at 14 dpi. G6-Untreated, MDV-infected group. G7-PBS control group. Chickens in all groups were infected with MDV at d5 except G7. Data were logarithmically transformed and analyzed using general linear model (Proc GLM) and followed by Duncan’s multiple range test in Statistical Analysis Software version 9.3 (SAS, Cary, NC). The Kruskal-Wallis test was used when data were not normally distributed. Gene expression results were presented as geometric mean of relative expression ± standard error of mean. p ≤ 0.05 was considered statistically significant when compared to G7 (*) or G6 (#) or G4 (ϕ).

References

    1. Osterrieder N, Kamil JP, Schumacher D, Tischer BK, Trapp S. Marek’s disease virus: from miasma to model. Nat. Rev. Microbiol. 2006;4:283–294. doi: 10.1038/nrmicro1382. - DOI - PubMed
    1. Baigent, S. J. & Davison, F. In Marek’s Disease: An Evolving Problem (eds Davison, F. & Nair, V.) 62–77 (Elsevier Academic Press, 2004).
    1. Calnek BW. Lymphomagenesis in Marek’s disease. Avian Pathol. 1998;27:54–64. doi: 10.1080/03079459808419293. - DOI
    1. Gurung A, Kamble N, Kaufer BB, Pathan A, Behboudi S. Association of Marek’s Disease induced immunosuppression with activation of a novel regulatory T cells in chickens. PLOS Pathog. 2017;13:e1006745. doi: 10.1371/journal.ppat.1006745. - DOI - PMC - PubMed
    1. Nair V. Evolution of Marek’s disease – A paradigm for incessant race between the pathogen and the host. Vet. J. 2005;170:175–183. doi: 10.1016/j.tvjl.2004.05.009. - DOI - PubMed

Publication types