. 2018 Jun;64(3):363-392.
doi: 10.1093/cz/zoy036. Epub 2018 Apr 26.

Sex roles and sexual selection: lessons from a dynamic model system

Affiliations

Sex roles and sexual selection: lessons from a dynamic model system

Trond Amundsen et al. Curr Zool. 2018 Jun.

Abstract

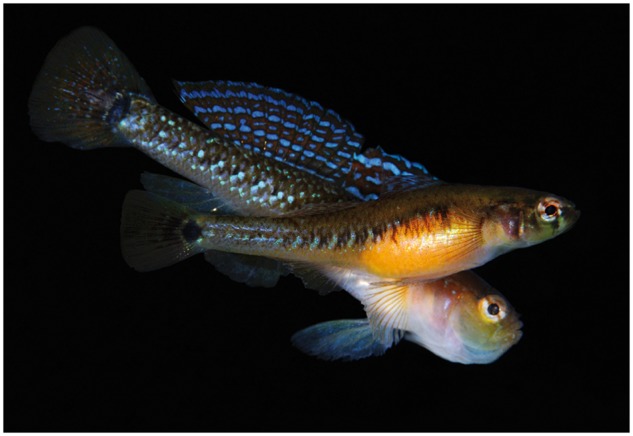
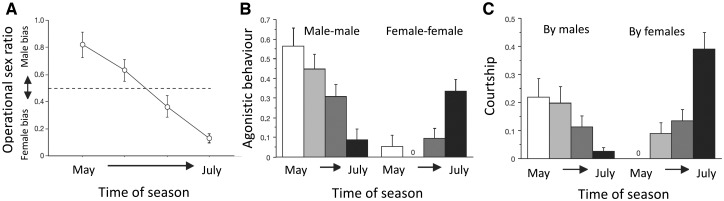
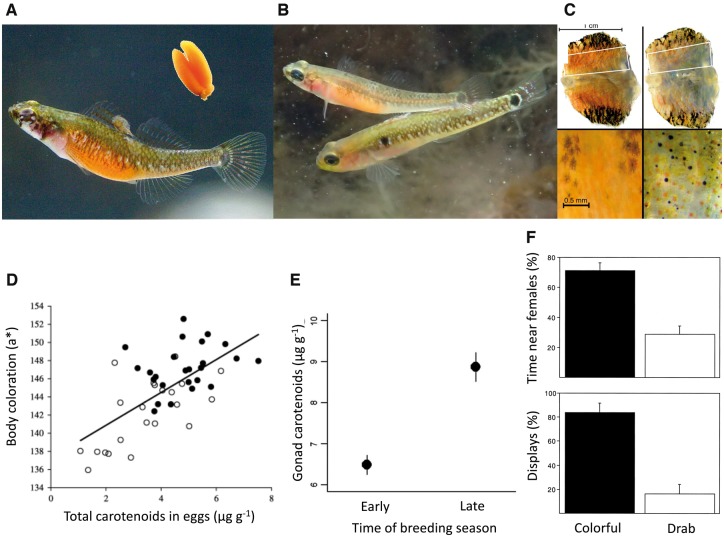
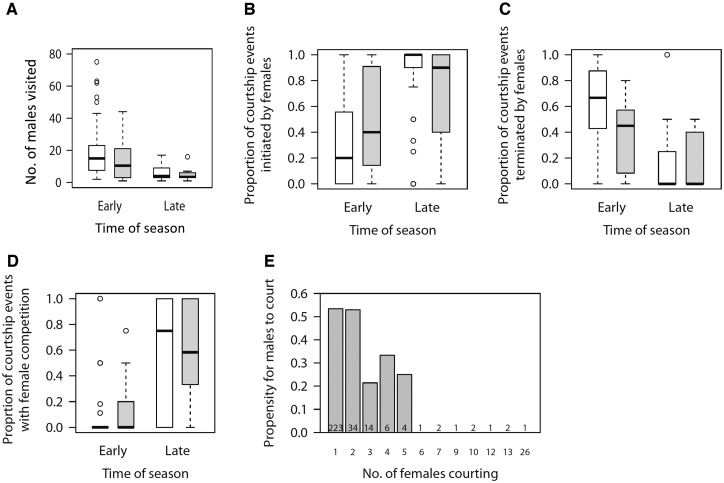
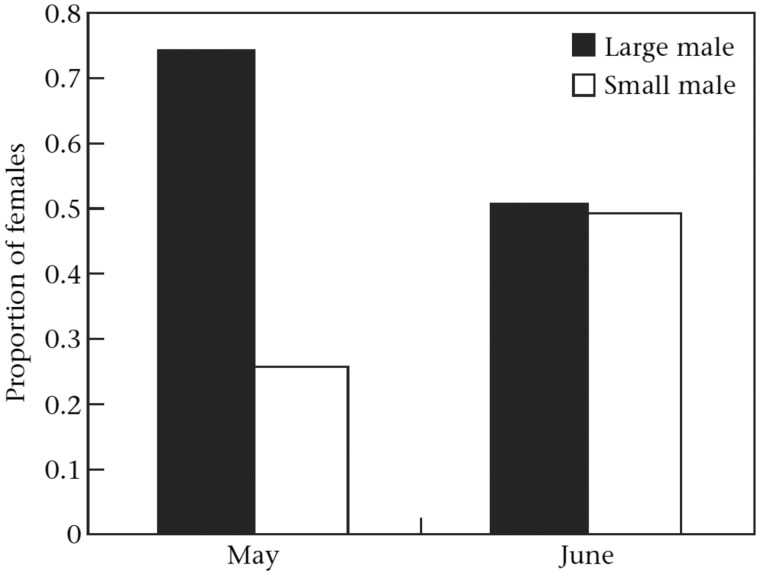
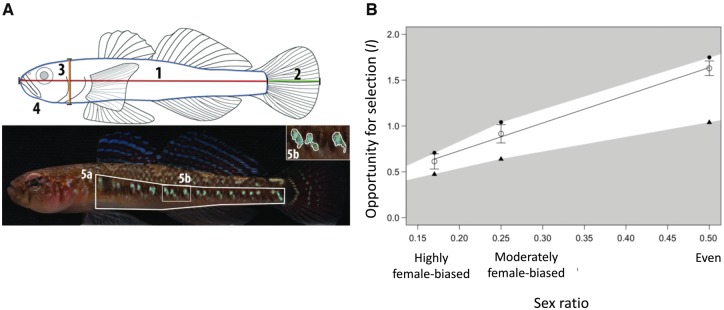
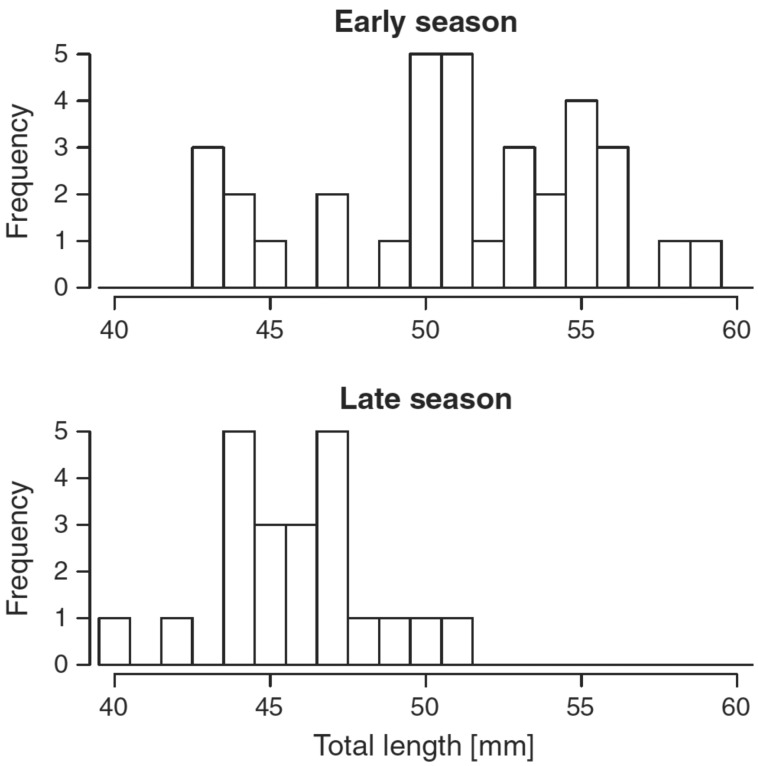
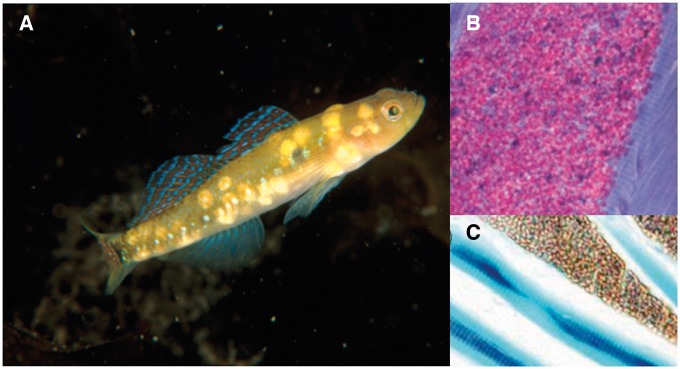
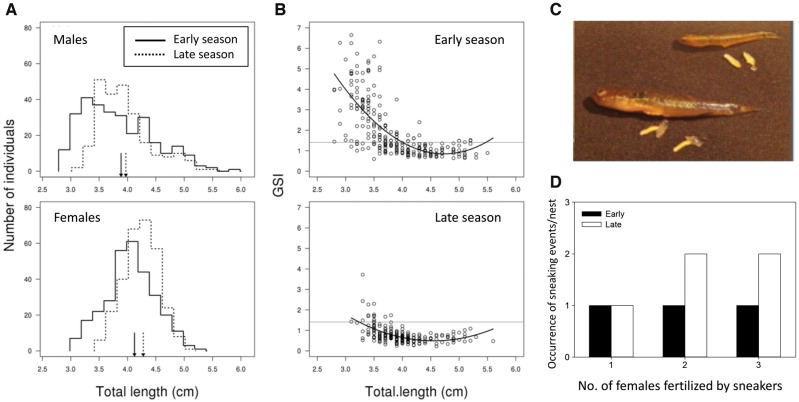
Our understanding of sexual selection has greatly improved during the last decades. The focus is no longer solely on males, but also on how female competition and male mate choice shape ornamentation and other sexually selected traits in females. At the same time, the focus has shifted from documenting sexual selection to exploring variation and spatiotemporal dynamics of sexual selection, and their evolutionary consequences. Here, I review insights from a model system with exceptionally dynamic sexual selection, the two-spotted goby fish Gobiusculus flavescens. The species displays a complete reversal of sex roles over a 3-month breeding season. The reversal is driven by a dramatic change in the operational sex ratio, which is heavily male-biased at the start of the season and heavily female-biased late in the season. Early in the season, breeding-ready males outnumber mature females, causing males to be highly competitive, and leading to sexual selection on males. Late in the season, mating-ready females are in excess, engage more in courtship and aggression than males, and rarely reject mating opportunities. With typically many females simultaneously courting available males late in the season, males become selective and prefer more colorful females. This variable sexual selection regime likely explains why both male and female G. flavescens have ornamental colors. The G. flavescens model system reveals that sexual behavior and sexual selection can be astonishingly dynamic in response to short-term fluctuations in mating competition. Future work should explore whether sexual selection is equally dynamic on a spatial scale, and related spatiotemporal dynamics.

Keywords: Gobiusculus flavescens; OSR; adult sex ratio; female ornament; male ornament; mate choice; mate search; mating competition; operational sex ratio; two-spotted goby.


Figures

Figure 1.
Figure 1.
The model organism Gobiusculus flavescens (two-spotted goby) in mutual courtship display. The female in front. Photo: © Nils Aukan.
Figure 2.
Figure 2.
Study sites, habitats, and nest substrates of G. flavescens in Scandinavia. (AD) Study locations in West Sweden (A), West Norway (B), mid-Norway (C) and South Finland (D). (EH) Diversity of kelp and seaweed habitats, dominated by Saccharina latissima (E), Laminaria hyperborea (F), Fucus serratus (G), and filamentous algae (H), respectively. (IL) Diversity of nesting subtrates: blue mussel M. edulis (I), base of S. latissima (J), atop dead bryozoans on L. digitata (K), and acetate sheet inside artificial PVC nest (L). All photos: © Trond Amundsen.
Figure 3.
Figure 3.
Geographic distribution of G. flavescens. Reprinted from International Union for Conservation of Nature (IUCN) 2014. Gobiusculus flavescens. The IUCN Red List of Threatened Species. Version 2017-1.
Figure 4.
Figure 4.
Locations of study sites for G. flavescens. The majority of work referred to in this article was made in the archipelago around and at the Sven Lovén Centre for Marine Science at Kristineberg (research station; red circle in right panel), situated at the mouth of the Gullmar Fjord in West Sweden. Some studies were also carried out in West Norway (blue square in left panel). Red arrows: locations for studying sex role reversal (Forsgren et al. 2004), yellow arrows: locations for the mate sampling study (Myhre et al. 2012), green arrows: locations for studying sexual selection in the wild (Wacker et al. 2014), blue arrow: location for parentage study (Mobley et al. 2009). Remaining studies were made in laboratories at the Kristineberg Research Station.
Figure 5.
Figure 5.
Relationships between mating success and reproductive success (A), and between nest size and reproductive success (B), in G. flavescens. Mating and reproductive success were quantified from parentage analyses using microsatellites. Mussels in (B) are all blue mussels Mytilus edulis. Reproduced from (A) Figure 2 and (B) Figure 1 in Mobley et al. (2009), BMC Evolutionary Biology 9:6.
Figure 6.
Figure 6.
Variation in OSR and mating competition over the breeding season. The figure shows within breeding-season trajectories of operational sex ratio (OSR) (A), propensity for aggressive behavior (B), and propensity to court (C) in a study of sex role dynamics in G. flavescens. The open circles in (A) and white-to-black bars in (B) and (C) represent 4 recording sessions distributed over the course of the breeding season. The OSR changes from male- to female-biased (A), with a concerted decrease in male mating competition (by male–male aggression and courtship efforts), and a simultaneous increase in female mating competition by the same means (B, C). Propensities to behave by aggression or courtship represent the likelihood that the actual behavior takes place at a given encounter between same- or opposite-sex individuals. Reproduced (A) from Figure 1 and (B–C) from Figure 2 in Forsgren et al. (2004), Nature 429:551–554.
Figure 7.
Figure 7.
How to measure mating competition: by frequencies of behaviors or propensities to behave? If OSR effects on courtship or aggression are measured by how often an act happens under various sex ratios, changes in encounter rate with opposite or same sex individuals will cause changes in numbers of courtship or agonistic acts even in the absence of any effect of sex ratio on individual behavior (the propensity for courtship and aggression at encounters). In this figure, the term competitor-to-resource ratio (CRR) is used instead of OSR in order to make the logic independent of sex of the actor [see de Jong et al. (2012) for further detail]. (AD) Effects on courtship. With an increasing CRR (i.e., fewer potential mates), there will be fewer mate encounters (thin dashed lines). Even if this causes an increased propensity to court (AC, thin lines), the frequency of courtship (bold lines) will decrease over the whole (A) or part (B, C) of the CRR range. In (D), we assume no effect of CRR on the propensity to court, in which case courtship frequency will decrease due to fewer encounters. (EH) Effects of CRR on aggression (agonistic behavior). With increasing CRR (i.e., more competitors), frequencies of same-sex encounters (thin dashed lines) will increase. Depending on how this affects the propensity to behave aggressively upon encounters, the result will be smaller or greater differences between trajectories for aggression propensity (thin lines) and frequency of aggression (bold lines). Trajectories could be qualitatively different over certain ranges of CCR (E–G), or over the full CRR range (H). Reprinted (A–D) from Figure 1 and (E–H) from Figure 2 in de Jong et al. (2012), Behavioral Ecology 23:1170–1177, by permission of Oxford University Press.
Figure 8.
Figure 8.
Female ornamentation in G. flavescens. (A) Female in “normal body coloration,” with colorful gonads (insert) visible through the skin. (B) Female aggregating dorsal and lateral melanophores to become near-transparent during courtship. (C) Belly skin biopsies (lateral to lateral) showing melanophore (brown–black) and erythrophore (orange–red) pigment cells maximally dilated (left) and maximally aggregated (right). (D) Belly coloration correlates strongly with gonad carotenoid content. Solid circles indicate females visually judged as “colorful”; open circles indicate females judged as “drab.” (E) Gonads have higher carotenoid content late than early in the season. (F) Male preference for the more colorful female when given a choice between 2 females that differed in experimentally manipulated belly coloration, in terms of percent of time spent near the more colorful female (upper) and percent of displays directed at the more colorful female (lower). (A, B) Photos by T. Amundsen, gonad insert by P. A. Svensson. (C) Adapted, with permission, from Figure 2 in Svensson et al. (2005), Journal of Experimental Biology 208:4391–4397. (D) Reproduced from Figure 2 in Svensson et al. (2006), Functional Ecology 20:689–698, by permission of John Wiley and Sons. (E) Reproduced from Figure 3C in Svensson et al. (2009), Behavioral Ecology 20:346–353, by permission of Oxford University Press. (F) Reproduced from Figure 4 in Amundsen and Forsgren (2001), PNAS 98:13155–13160, copyright National Academy of Sciences.
Figure 9.
Figure 9.
Effects of time of season on female mate search behavior in G. flavescens. “Early” refers to late April and May (male-biased OSR), “Late” to mid-June to mid-July (female-biased OSR). Females from one locality were captured, individually marked, released at another locality, and followed during mate search [see Myhre et al. (2012) for details]. (A) Number of males visited (sampled) during 30 min observations of mate-searching females, (B) female propensity to initiate courtship, (C) female propensity to terminate courtship, (D) frequency of multi-female courtship, and (E) likelihood of male courtship in relation to the number of simultaneously courting females. About 30% of the females mated during 30 min of observation. (A–D) Open boxes represent females that did not mate during observation, shaded boxes those that mated during observation. Reproduced (A) from Figure 2, (B–C) from Figure 1 and (D–E) from Figure 2 in Myhre et al. (2012), American Naturalist 179:741–755, with permission of University of Chicago Press.
Figure 10.
Figure 10.
Female preference for large males in relation to time of season, in G. flavescens. The figure shows the proportions of females that responded more strongly to large and small males, respectively, in a 2-choice aquarium set-up. Reprinted, with permission from Elsevier, from Figure 1 in Borg et al. (2006), Animal Behaviour 72:763–771.
Figure 11.
Figure 11.
Sexual selection in male G. flavescens. (A) Male morphological (upper) and ornamental (lower) traits potentially subject to sexual selection. (B) Measured opportunity (I, open circles and line) for selection in relation to theoretical minimum (filled triangles) and maximum (filled circles) opportunity for selection under different sex ratios. Measured opportunity is closer to the upper than the lower theoretical bound. Note that a change in sex ratio by itself increases the opportunity for selection. The shaded areas are outside the theoretical bound for sex ratio effects on opportunity for selection in the model system [see Wacker et al. (2013) for further explanation]. Reproduced, by permission of John Wiley and Sons, from (A) Figure 1 and (B) Figure 3 in Wacker et al. (2013), Evolution 67:1937–1949.
Figure 12.
Figure 12.
Gobiusculus flavescens males that breed late in the season are smaller than those breeding early in the season. Reproduced, by permission of John Wiley and Sons, from Figure 2 in Wacker et al. (2014), Molecular Ecology 23:3587–3599.
Figure 13.
Figure 13.
Experimental designs for testing effects of habitat structure (A, B) and nest spacing (C, D) in G. flavescens. Tubes (8 in each treatment) indicate artificial PVC nests, the branched structures artificial algae placed in the aquaria. The upper 2 panels illustrate a study comparing mating behavior and sexual selection between an open (A) and a physically structured (B) environment (Myhre et al. 2013). In (B), spatial structuring is achieved by opaque Plexiglas dividers formed to allow fish to move across but significantly preventing visual contact between the compartments containing nests. The lower 2 panels illustrate a study comparing mating behavior and sexual selection between environments with a dispersed (C) or clumped (D) nest distribution (Mück et al. 2013). Reprinted, by permission of Oxford University Press, from Figure 1 in Myhre et al. (2013), Behavioral Ecology 24:553–563 (A, B), and, by permission from Springer, from Figure 1 in Mück et al. (2013), Behavioral Ecology and Sociobiology 67:609–617 (C, D).
Figure 14.
Figure 14.
Microsporidian Kabatana sp. infection of male G. flavescens. (A) Heavily infected male. Each spot is a colony of microsporidians. (B) Longitudinal section through infected flank muscle, with Masson’s trichrome staining indicating the spore mass (red) and surrounding, intact myofibrils (blue). (C) VOF-stained longitudinal section of non-infected (blue) and enlarged infected muscle fibers (brown) in the mandible. (A) Photo: © Anders Salesjö, (B, C) modified from Figure 2 in Barber et al. (2009), Diseases of Aquatic Organisms 83:145–152. When the fish gets infected, microsporidian spores migrate to the striated muscles of the fish (B, C), where they multiply to replace the muscle fibers, essentially leaving infected musculature gelatinous and non-functional. Muscles in any part of the body can be infected. Skeletal musculature is often infected and, when extensive like in (A), the swimming ability of the fish is impaired.
Figure 15.
Figure 15.
Alternative reproductive tactics are prevalent in a West Norwegian population of G. flavescens. In this population, males are generally smaller than females and there is an abundance of very small males (A), the smallest males have much larger testes (gonado-somatic index GSI) for their size (B, C), and sneaking occurs both early and late in the season (D). Reproduced from (A) Figure 1, (B) Figure 2 and (C) Figure 6 in Utne-Palm et al. (2015), PLoS One 10:e0143487, and from (D) Figure 2d in Monroe et al. (2016), Journal of Evolutionary Biology 29:2362–2372, by permission of John Wiley and Sons.

Similar articles

Cited by

References

    1. Adams S, Mapstone BD, Russ GR, Davies CR, 2000. Geographic variation in the sex ratio, sex specific size, and age structure of Plectropomus leopardus (Serranidae) between reefs open and closed to fishing on the Great Barrier Reef. Can J Fish Aquat Sci 57:1448–1458.
    1. Agorreta A, San Mauro D, Schliewen U, Van Tassell JL, Kovacic M. et al., 2013. Molecular phylogenetics of Gobioidei and phylogenetic placement of European gobies. Mol Phylogenet Evol 69:619–633. - PubMed
    1. Ah-King M, Ahnesjö I, 2013. The “sex role” concept: an overview and evaluation. Evol Biol 40:461–470.
    1. Ahnesjö I, Forsgren E, Kvarnemo C, 2008. Variation in sexual selection in fishes In: Magnhagen C, Braithwaite VB, Forsgren E, Kapoor BG, editors. Fish Behaviour. Boca Ration: CRC Press, 303–335.
    1. Ahnesjö I, Kvarnemo C, Merilaita S, 2001. Using potential reproductive rates to predict mating competition among individuals qualified to mate. Behav Ecol 12:397–401.