. 2018 Sep 30:2018:8515343.
doi: 10.1155/2018/8515343. eCollection 2018.

miR-26a Potentially Contributes to the Regulation of Fatty Acid and Sterol Metabolism In Vitro Human HepG2 Cell Model of Nonalcoholic Fatty Liver Disease

Affiliations

miR-26a Potentially Contributes to the Regulation of Fatty Acid and Sterol Metabolism In Vitro Human HepG2 Cell Model of Nonalcoholic Fatty Liver Disease

Omaima Ali et al. Oxid Med Cell Longev. .

Abstract

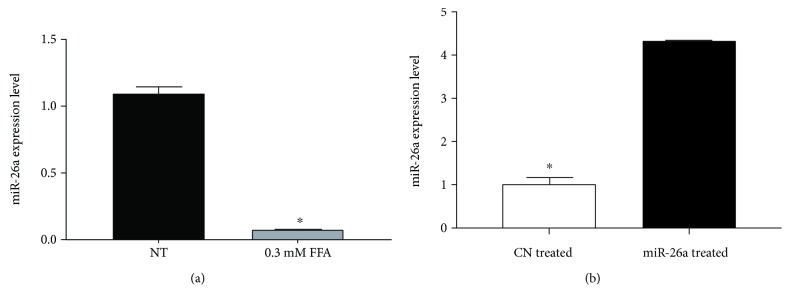
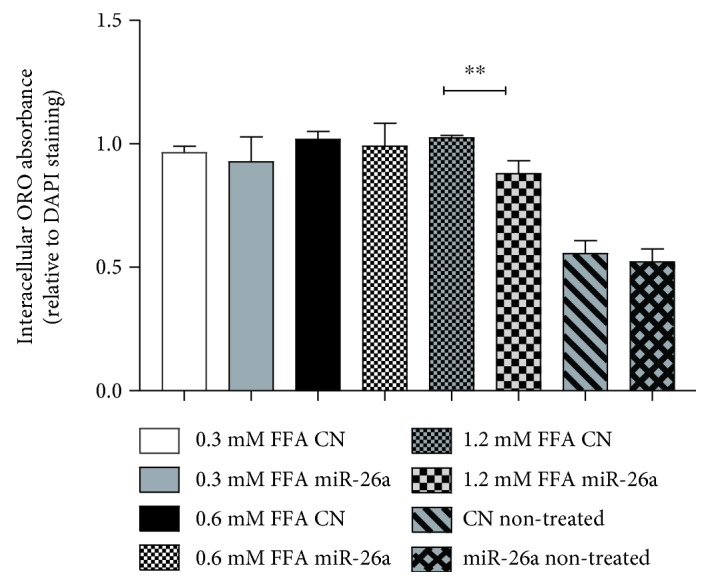
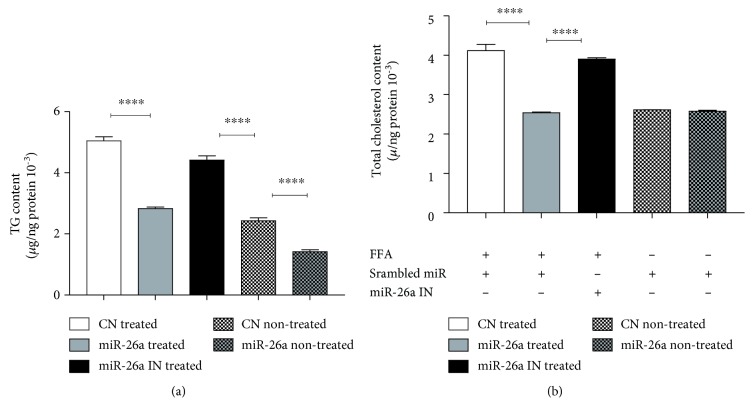
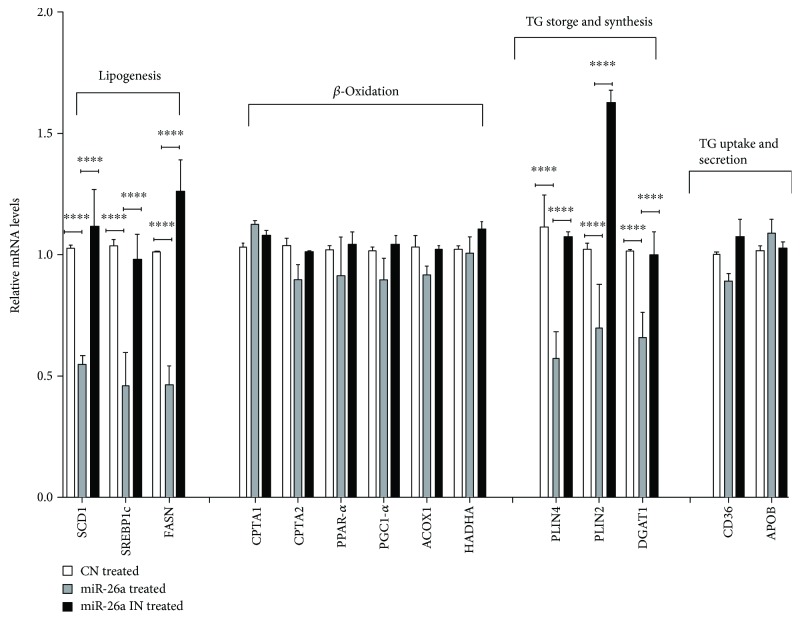
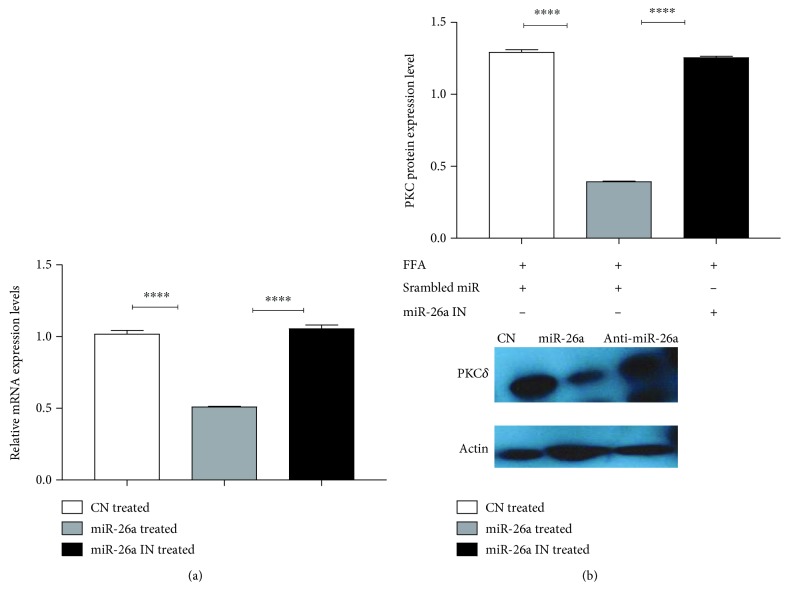
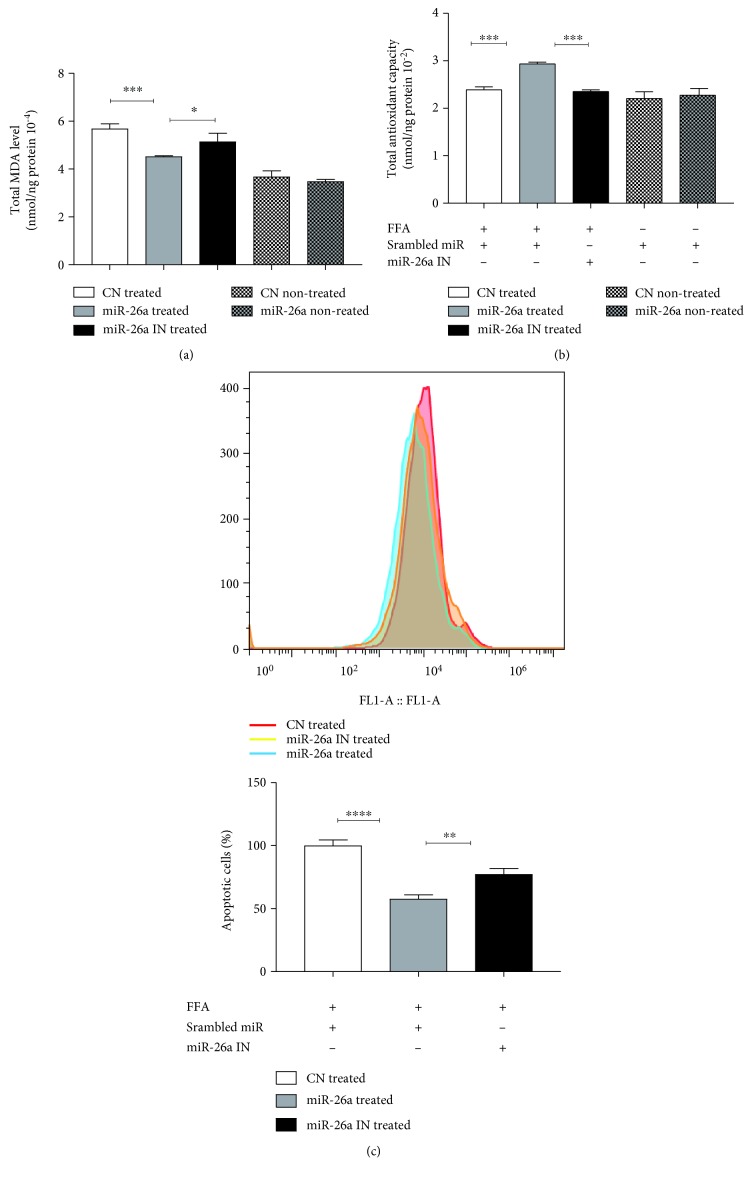
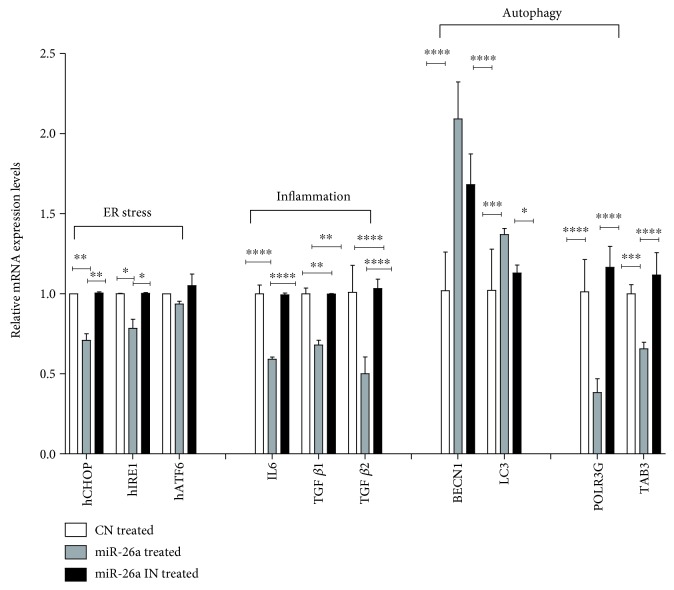
Nonalcoholic fatty liver disease (NAFLD) is a metabolic-related disorder ranging from steatosis to steatohepatitis, which may progress to cirrhosis and hepatocellular carcinoma (HCC). This study aimed at assessing the regulatory and protective role of miR-26a on lipid metabolism and progression of NAFLD in human HepG2 cells loaded with free fatty acids (FFA). Lentivirus expressing miR-26a or negative control miR was used to transduce HepG2 cells and to establish stable cell lines. Gain or loss of function using an miR-26a inhibitor was used to compare triglyceride content (TG), total cholesterol level (CL), total antioxidant capacity (TAC), malondialdehyde (MDA) and the level of apoptosis. In addition, quantitative reverse transcription polymerase chain reaction (qPCR) was used to assess the mRNA levels of lipogenesis, TG synthesis, storage genes, inflammatory and fibrogenic markers, and autophagic besides endoplasmic reticulum (ER) stress markers after gaining or losing the function of miR-26a. miR-26a levels decreased in response to FFA in human HepG2 cells. After the establishment of a stable cell line, the upregulation of miR-26a resulted in the downregulation of TG, CL, and MDA levels, through regulating mRNA levels of genes involved in lipid homeostasis, ER stress marker, inflammatory and fibrogenic markers. Nevertheless, there was a marked increment in the mRNA expression of autophagic marker genes. Moreover, miR-26a overexpression protects the cells from apoptosis, whereas inhibition of miR-26a, using an anti-miR-26a oligonucleotide, decreased the expression of miR-26a which potentially contributes to altered lipid metabolism in HepG2 cells loaded with FFA. In conclusion, these findings suggested that miR-26a has a crucial role in regulating fatty acid and cholesterol homeostasis in HepG2 cells, along with the offered protection against the progression of NAFLD in vitro. Hence, miRNAs could receive growing attention as useful noninvasive diagnostic markers to follow the progression of NAFLD and to identify novel therapeutic targets.


Figures

Figure 1
Figure 1
Expression level of miR-26a after (a) FFA treatment of HepG2 cells. HepG2 cells were treated with 0.3 mM PA + OA in ratio 1 : 2 for 24 h. (b) After miR-26a overexpression using lentivirus, U6 snRNA was used as an internal control for miR-26a. Data were expressed as the mean ± SD from three separate experiments (P < 0.05). miR-26a: microRNA-26a; FFA: free fatty acid (PA: palmitic acid + OA: oleic acid); NT: nontreated HepG2 cells; CN treated: scrambled miR transduced stable cells treated with FFA; miR-26a treated: miR-26a transduced stable cells treated with FFA; SD: standard deviation.
Figure 2
Figure 2
Intracellular Oil red O extract absorbance normalized with mean DAPI measurement in miR-26a stable cell line compared to control stable cell line treated with different FFA concentrations (0.3 mM, 0.6 mM, or 1.2 mM). Data were expressed as the mean ± SD from three separate experiments (∗∗P < 0.01).
Figure 3
Figure 3
Effect of miR-26a overexpression in stable HepG2 cells on (a) total triglycerides and (b) total cholesterol. CN treated: scrambled miR transduced stable cells treated with FFA and transient transfection of control miR; miR-26a treated: miR-26a transduced stable cells treated with FFA and transient transfection of control miR; miR-26a IN treated: miR-26a transduced stable cells treated with FFA and transient transfection of miR-26a inhibitor; CN nontreated: scrambled miR transduced stable cells with transient transfection of control miR but without FFA treatment; miR-26a nontreated: miR-26a transduced stable cells with transient transfection of control miR but without FFA treatment. Data were collected after 24 h treatment. Results shown are the mean ± SD (∗∗∗∗P < 0.0001).
Figure 4
Figure 4
Effect of miR-26a overexpression on expression of genes involved in lipogenesis. FASN, SCD1, and SREBP1c; β-oxidation CPTA1, CPT2, PPAR-α, PGC1-α, ACOX1, and HADHA; triglyceride synthesis and storage PLIN2, PLIN4, and DGAT1; and expression of genes involved in fatty acid uptake transporters as well as TG excretion key marker genes CD36 and ApoB. Group labels are the same as for Figure 3. Results shown are the mean ± SD (∗∗∗P < 0.001 and ∗∗∗∗P < 0.0001).
Figure 5
Figure 5
Effect of miR-26a overexpression on (a) PKCδ mRNA expression and (b) PKCδ protein level. Group labels are the same as for Figure 3. Results shown are the mean ± SD (∗∗∗∗P < 0.0001).
Figure 6
Figure 6
Effect of miR-26a overexpression on (a) total MDA level, (b) total antioxidant level, and (c) apoptosis level indicated by flow cytometry. Group labels are the same as for Figure 3. Results shown are the mean ± SD (P < 0.05, ∗∗P < 0.01, ∗∗∗P < 0.001, and ∗∗∗∗P < 0.0001).
Figure 7
Figure 7
Effect of miR-26a overexpression on expression of genes involved in ER stress markers hCHOP, hIRE1, and hATF6; expression of genes involved in inflammatory marker and IL-6 and fibrosis markers TGFβ1 and TGFβ2; mRNA expression of genes involved in autophagy BECN1 and LC3-II; and mRNA expression of POLR3G and TAB3. Group labels are the same as for Figure 3. Results shown are the mean ± SD (P < 0.05, ∗∗P < 0.01, ∗∗∗P < 0.001, and ∗∗∗∗P < 0.0001).

References

    1. Angulo P. Nonalcoholic fatty liver disease. New England Journal of Medicine. 2002;346(16):1221–1231. doi: 10.1056/NEJMra011775. - DOI - PubMed
    1. Yamaguchi K., Yang L., McCall S., et al. Inhibiting triglyceride synthesis improves hepatic steatosis but exacerbates liver damage and fibrosis in obese mice with nonalcoholic steatohepatitis. Hepatology. 2007;45(6):1366–1374. doi: 10.1002/hep.21655. - DOI - PubMed
    1. Liu W., Cao H., Yan J., Huang R., Ying H. ‘Micro-managers’ of hepatic lipid metabolism and NAFLD. Wiley Interdisciplinary Reviews: RNA. 2015;6(5):581–593. doi: 10.1002/wrna.1295. - DOI - PubMed
    1. Peverill W., Powell L., Skoien R. Evolving concepts in the pathogenesis of NASH: beyond steatosis and inflammation. International Journal of Molecular Sciences. 2014;15(5):8591–8638. doi: 10.3390/ijms15058591. - DOI - PMC - PubMed
    1. Cusi K. Role of insulin resistance and lipotoxicity in nonalcoholic steatohepatitis. Clinics in Liver Disease. 2009;13(4):545–563. doi: 10.1016/j.cld.2009.07.009. - DOI - PubMed

MeSH terms