

Assessing Trends in Functional and Structural Characteristics: A Survey of Statistical Methods With an Example From Ophthalmology
- PMID: 30402341
- PMCID: PMC6213778
- DOI: 10.1167/tvst.7.5.34
Assessing Trends in Functional and Structural Characteristics: A Survey of Statistical Methods With an Example From Ophthalmology
Abstract
Purpose: Clinical decisions on treatment are usually based on short-term records of consecutive measurements of structure and function. Useful models for analyzing average trends and a description of statistical methods for classifying individual subjects on the basis of subject-specific trend progressions are presented.
Methods: Random effects trend models allow intercepts and slopes of the trend regression to vary across subjects around group-specific mean intercepts and mean slopes. Model results assess whether average intercepts and slopes and subject variability in intercepts and slopes are the same across groups. Fisher's discriminant functions are used for classification.
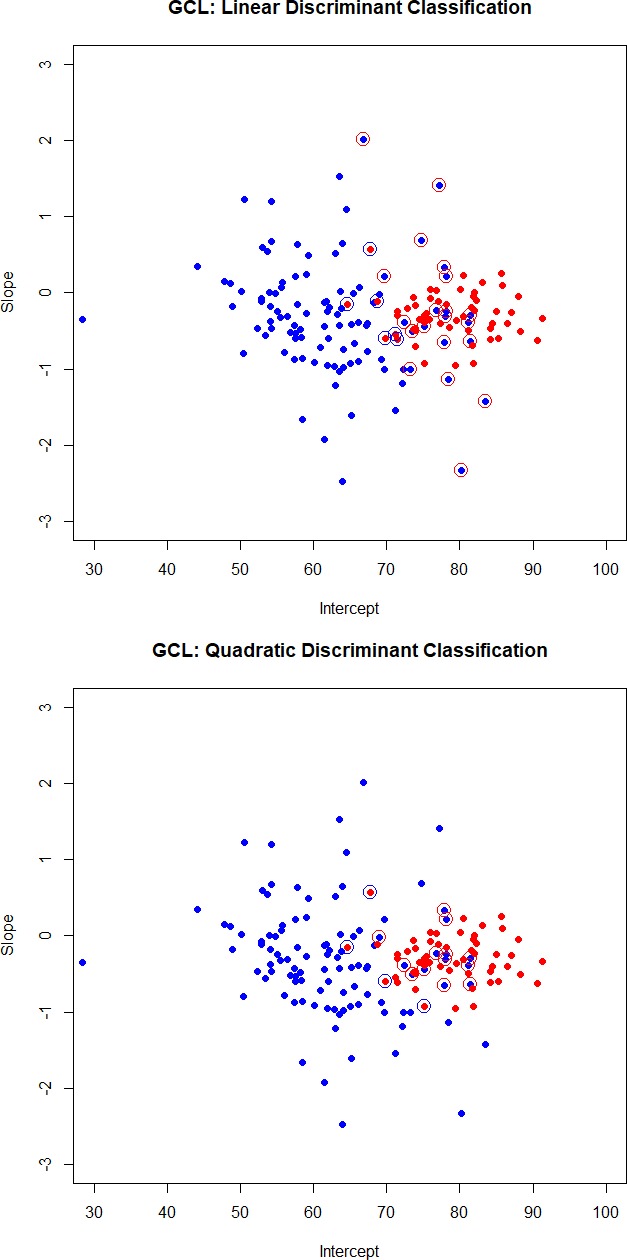
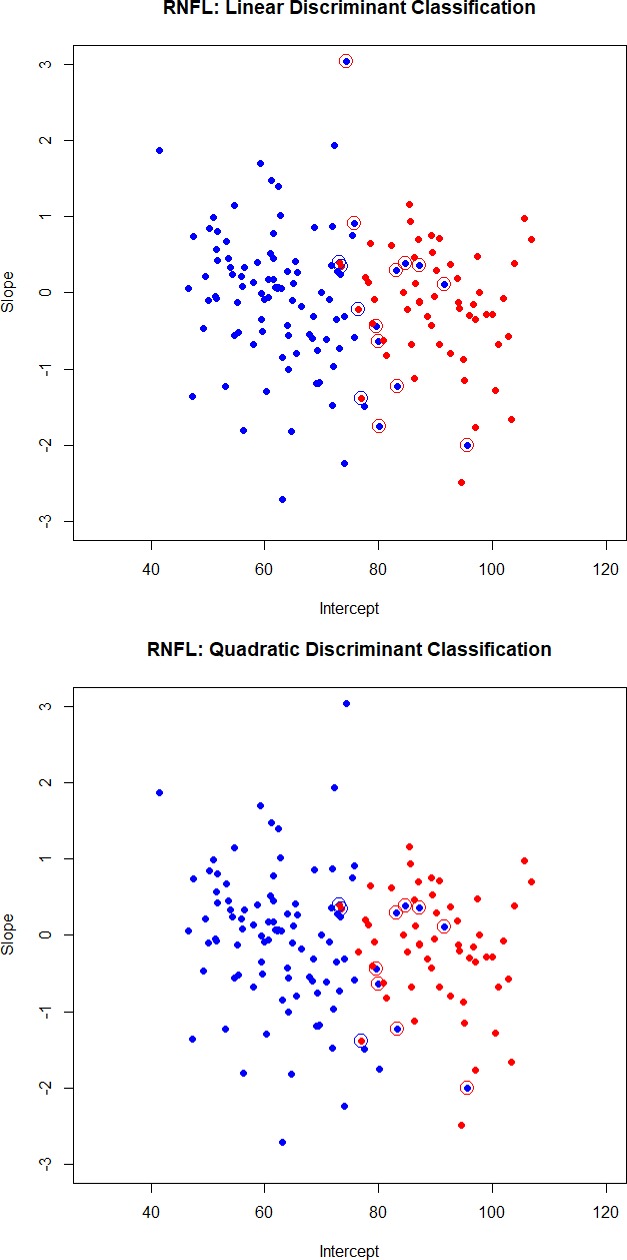
Results: Methods are presented and illustrated on structural visual data from a multiyear perimetry study. Average thickness of the ganglion cell layer from the optical coherence tomography macula scan and of the retinal nerve fiber layer from the optic disc scan for both glaucoma patients on optimal treatment and normal subjects are analyzed. The random effects trend model shows that average intercepts of glaucoma patients and normal subjects are quite different, but that average slopes are the same, and that the subject variability in both intercepts and slopes is larger for the glaucoma group. These findings explain why the subject-specific trend progression is not a good classifier; it is the level of the measurement (intercept or baseline value) that carries useful information in this particular cohort example.
Translational relevance: Clinicians base decisions on short-term records of consecutive measurements and need simple statistical tools to analyze the information. This paper discusses useful methods for analyzing short time series data. Model results assess whether there exist significant trends and whether average trends are different across groups. The paper discusses whether clinical measures classify patients reliably into disease groups, given their variability. With ever more available data, classification plays a central role of personalized medicine.
Keywords: OCT measurements; classification; patient monitoring; personalized medicine; random effects trend model; subject variability; trend change detection.
Figures
References
-
- Abraham B, Ledolter J. Introduction to Regression Modeling. Belmont, CA: Duxbury Press;; 2006.
-
- Searle S. Linear Models. New York, NY: John Wiley and Sons;; 1971.
-
- Searle S, Casella G, McCulloch C. Variance Components. New York, NY: John Wiley and Sons;; 1992.
-
- SAS Statistical Software (Version 9.4) Cary, NC: SAS Institute, Inc.; https://support.sas.com/en/support-home.html Accessed October 14, 2018.
-
- The R Project for Statistical Computing. https://www.r-project.org/ Accessed October 14, 2018.
Grants and funding
LinkOut - more resources
Full Text Sources
