. 2018 Oct 31;7(5):35.
doi: 10.1167/tvst.7.5.35. eCollection 2018 Sep.

Improving Spatial Resolution and Test Times of Visual Field Testing Using ARREST

Affiliations

Improving Spatial Resolution and Test Times of Visual Field Testing Using ARREST

Andrew Turpin et al. Transl Vis Sci Technol. .

Abstract

Purpose: Correctly classifying progression in moderate to advanced glaucoma is difficult. Pointwise visual field test-retest variability is high for sensitivities below approximately 20 dB; hence, reliably detecting progression requires many test repeats. We developed a testing approach that does not attempt to threshold accurately in areas with high variability, but instead expends presentations increasing spatial fidelity.

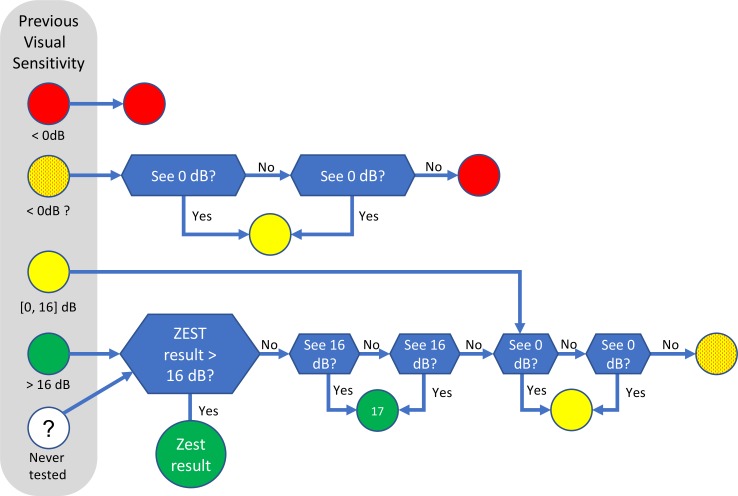
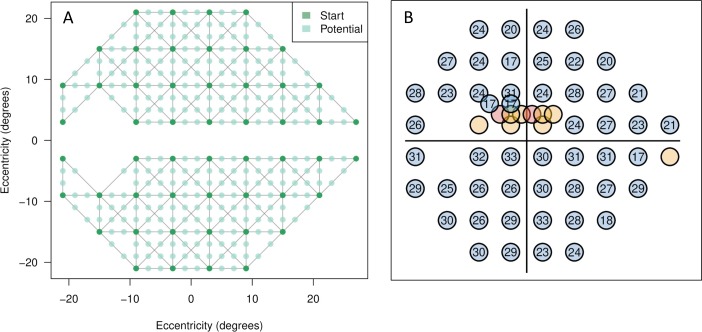
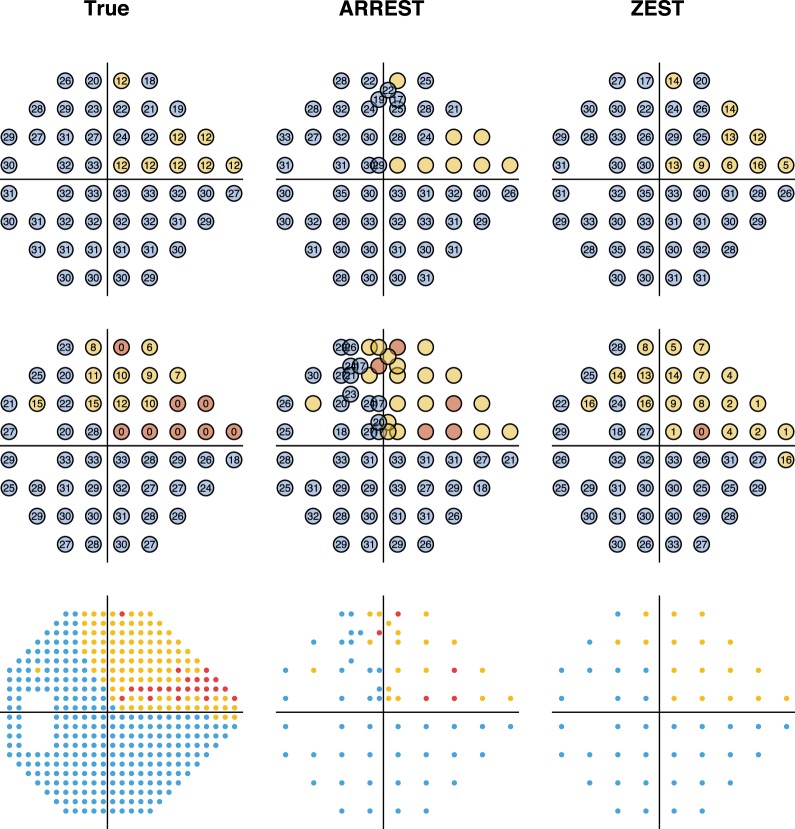
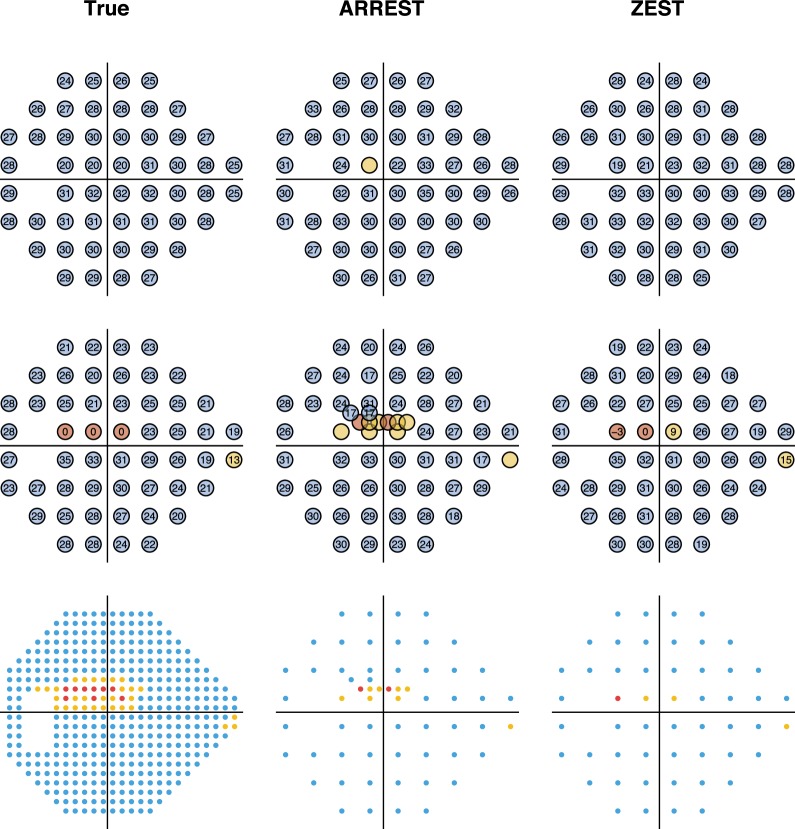
Methods: Our visual field procedure Australian Reduced Range Extended Spatial Test (ARREST; a variant of the Bayesian procedure Zippy Estimation by Sequential Testing [ZEST]) applies the following approach: once a location has an estimated sensitivity of <17 dB (a "defect"), it is checked that it is not an absolute defect (<0 dB, "blind"). Saved presentations are used to test extra locations that are located near the defect. Visual field deterioration events are either: (1) decreasing in the range of 40 to 17 dB, (2) decreasing from >17 dB to "defect", or (3) "defect" to blind. To test this approach we used an empirical database of progressing moderate-advanced 24-2 visual fields (121 eyes) that we "reverse engineered" to create visual field series that progressed from normal to the end observed field. ARREST and ZEST were run on these fields with test accuracy, presentation time, and ability to detect progression compared.

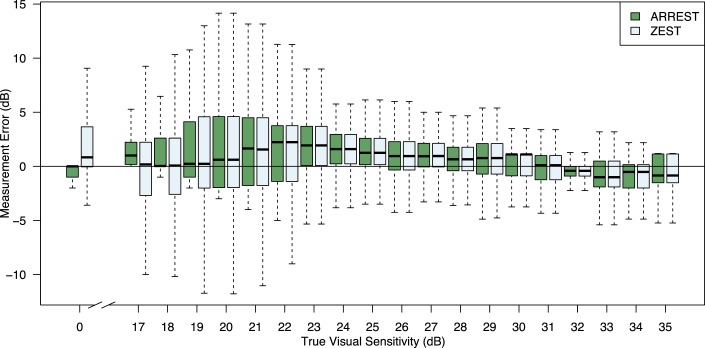
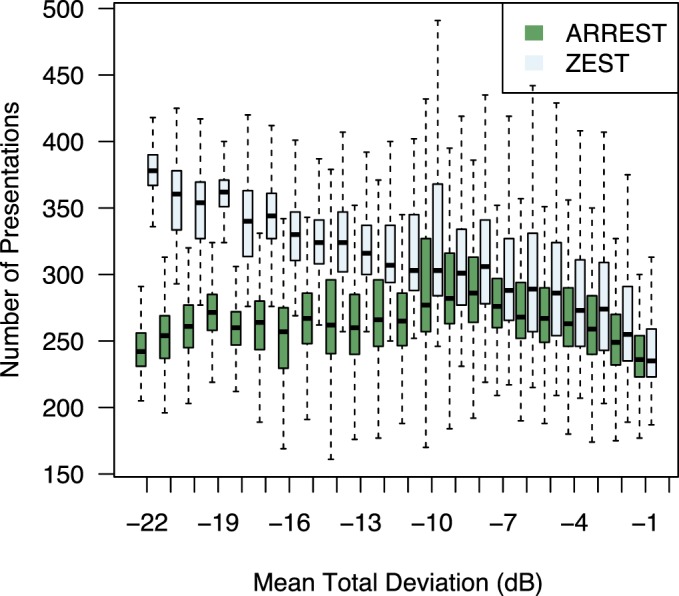
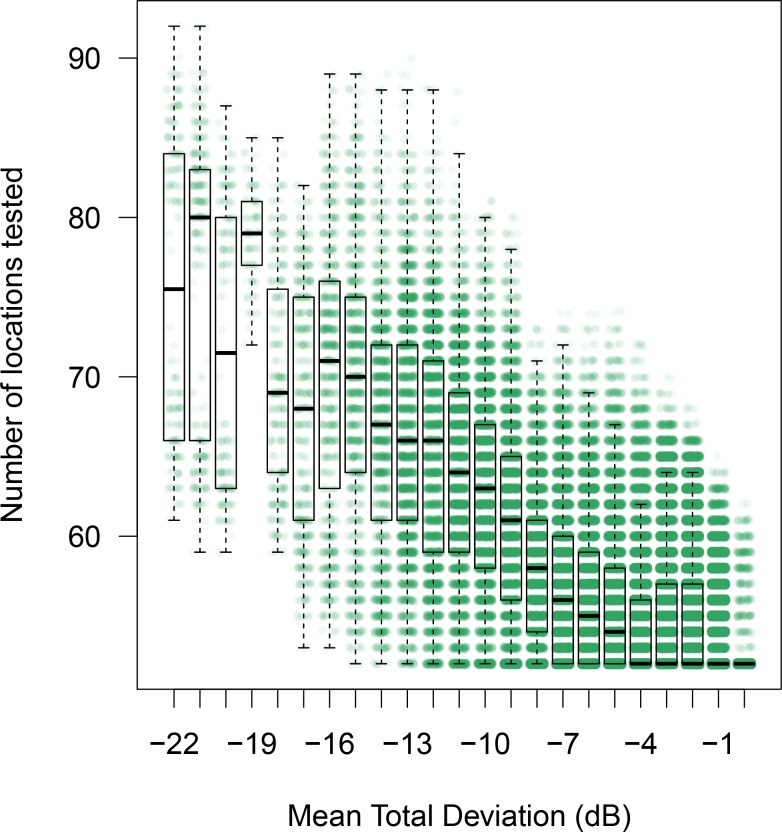
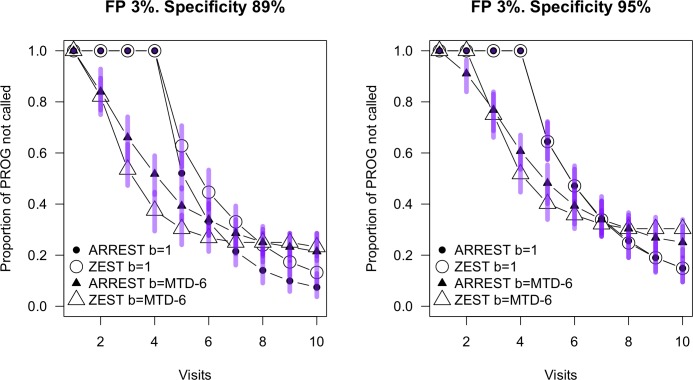
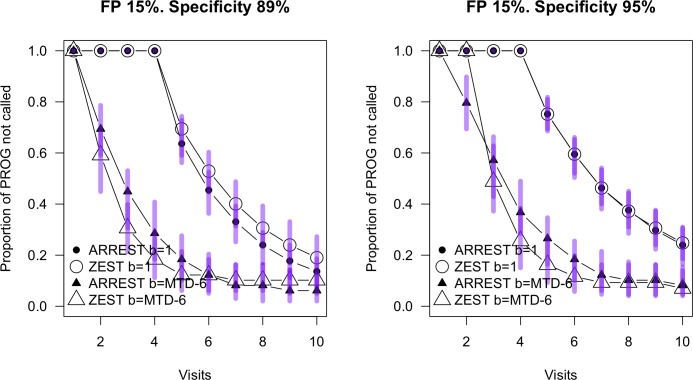
Results: With specificity for detecting progression matched at 95%, ZEST and ARREST showed similar sensitivity for detecting progression. However, ARREST used approximately 25% to 40% fewer test presentations to achieve this result in advanced visual field damage. ARREST spatially defined the visual field deficit with greater precision than ZEST due to the addition of non-24-2 locations.

Conclusions: Spending time trying to accurately measure visual field locations that have high variability is not productive. Our simulations indicate that giving up attempting to quantify size III white-on-white sensitivities below 17 dB and using the presentations saved to test extra locations should better describe progression in moderate-to-advanced glaucoma in shorter time.

Translational relevance: ARREST is a new visual field test algorithm that provides better spatial definition of visual field defects in faster test time than current procedures. This outcome is achieved by substituting inaccurate quantification of sensitivities <17 dB with new spatial locations.

Keywords: algorithm; perimetry; spatial visual field loss; visual field progression.


Figures

Figure 1
Figure 1
Actions taken for an individual location based on its previous measured visual sensitivity in the ARREST procedure. Green indicates that the measured visual sensitivity is not ≤16 dB; yellow, in the range 0 to 16 dB; yellow-with-red-dots, in the range 0 to 16 dB but 0 dB has not been seen at least once in the previous test; red, unable to see 0 dB. The white circle indicates that there is no previous visual sensitivity measured for this location. Blue decision boxes indicate that presentations are made and responses gathered.
Figure 2
Figure 2
(A) The Start locations (dark green) and Potential new locations (light green) used in the ARREST procedure. Gray lines (“edges”) between dark green locations indicate neighbor relations. (B) An example of a resultant visual field that may arise after the addition of extra test locations. A more complete description of this specific case example is shown in Figure 9.
Figure 3
Figure 3
Difference between measured visual sensitivity and input “true” visual sensitivity rounded to the nearest integer for ARREST and ZEST, collated over all 121 eyes in PROG, all visits, 100 repeat measurements. Boxes indicate 25th and 75th percentiles, the dark line the median, and whiskers extreme values. ARREST does not measure visual sensitivities in the range 1 to 16 dB and so we cannot report differences for those values.
Figure 4
Figure 4
Number of presentations per visual field test stratified by mean TD of the input visual field rounded to the nearest integer. Collated over all 121 eyes in PROG, all visits, 100 repeat measurements. Boxes and whiskers as in Figure 3.
Figure 5
Figure 5
Example measured visual fields of a single series in the PROG dataset. The first column contains the true visual sensitivities, the second as measured by ARREST, and the third as measured by ZEST. The top row is for a visit where mean TD of the true field is −4 dB, the second row has mean TD −11 dB. The third row shows the tested locations to scale, with each tested location covering a circle of diameter 0.43° as for a Goldmann Size III target.
Figure 6
Figure 6
Number of locations tested by ARREST in a visual field stratified by mean TD. Boxes as in Figure 3. There is one green dot for each visual field measured for the 121 patients, 100 repeats, all visits in PROG.
Figure 7
Figure 7
Survival curves for ARREST and ZEST on the PROG dataset. Progression criteria are as described in Table 1. Circles are for progression from normal (TD = 0, or “b = 1”), and triangles are for the progression from a baseline of mean TD less than −6 (“b=MTD-6”). Specificity was determined on the STABLE-1 and STABLE-6 datasets respectively. Bars show the 95% range over the 100 retests of the same population at each visit.
Figure 8
Figure 8
Survival curves for ARREST and ZEST on the PROG dataset with simulations injecting a 15% false-positive rate. Progression criteria are as described in Table 1, and all other features of the Figure are the same as in Figure 7.
Figure 9
Figure 9
Example measured visual fields of a single series in the PROG dataset where the visual field defect is close to fixation. The first column contains the true visual sensitivities, the second as measured by ARREST, and the third as measured by ZEST. The top row is for a visit where mean TD of the true field is −1 dB, the second row has mean TD −5 dB. The third row shows the tested locations to scale, with each tested location covering a circle of diameter 0.43° as for a Goldmann Size III target.
Figure A1
Figure A1
Left: Mean TD for each patient in the datasets PROG (red) and PROG-6 (blue) at visits 1, 5, and 10. Right: A frequency distribution for the rate of change of all 24-2 locations in the PROG data set (52 × 121 patients = 6292 locations).
Figure A2
Figure A2
Red text shows the weights used for deriving a dB value for the red location using Natural Neighbor Interpolation given the black locations exist with the dB values shown. Black lines show the Voronoi tessellation of the black points before the red point is added. The red boundary shows the tile that will be added for the Voronoi tessellation of the black and red points.

References

    1. De Moraes CG, Liebman JM, Levin LA. Detection and measurement of clinically meaningful visual field progression in clinical trials for glaucoma. Prog Retin Eye Res. 2017;56:107–147. - PMC - PubMed
    1. Bengtsson B, Heijl A. Evaluation of a new perimetric strategy, SITA, in patients with manifest and suspect glaucoma. Acta Ophthalmol Scand. 1998;76:368–375. - PubMed
    1. Chong LX, McKendrick AM, Ganeshrao SB, Turpin A. Customised, automated stimulus location choice for assessment of visual field defects. Invest Ophthalmol Vis Sci. 2014;55:3265–3274. - PubMed
    1. Ganeshrao SB, McKendrick AM, Denniss J, Turpin A. A perimetric test procedure that uses structural information. Optom Vis Sci. 2015;92:70–82. - PubMed
    1. Gardiner SK. Effect of a variability-adjusted algorithm on the efficiency of perimetric testing. Invest Ophthalmol Vis Sci. 2014;55:2983–2992. - PMC - PubMed