. 2018 Oct 8:2018:3623274.
doi: 10.1155/2018/3623274. eCollection 2018.

Zearalenone Changes the Diversity and Composition of Caecum Microbiota in Weaned Rabbit

Affiliations

Zearalenone Changes the Diversity and Composition of Caecum Microbiota in Weaned Rabbit

Peng Li et al. Biomed Res Int. .

Abstract

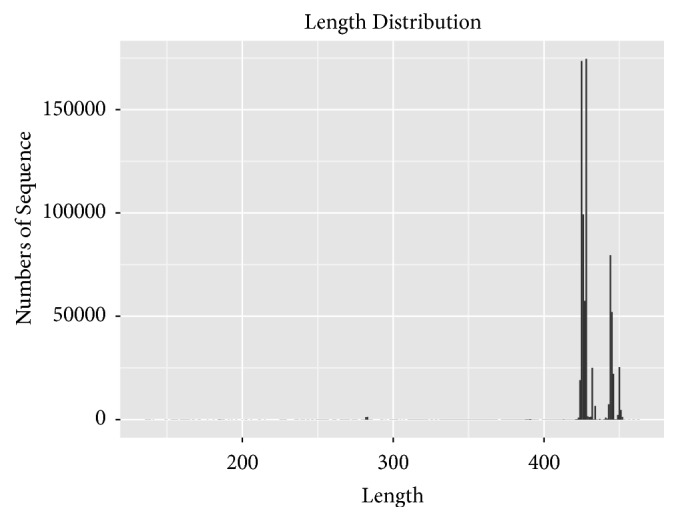
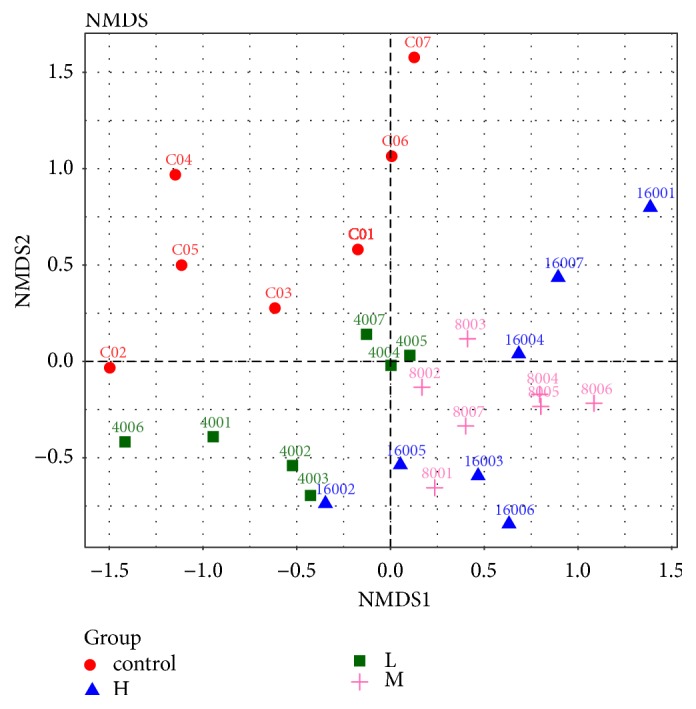
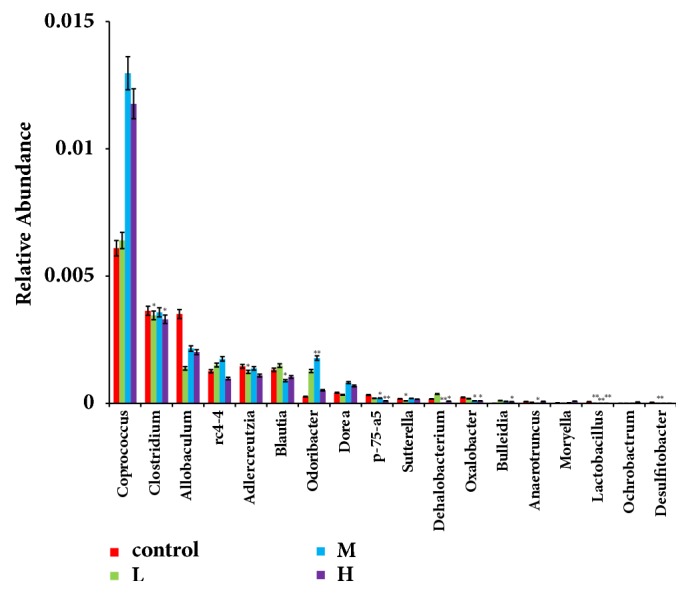
Mycotoxins exhibit several severe effects on intestinal health, but few studies have assessed mycotoxins effect on the intestinal microflora and its repercussions to humans and animals. In this study, we evaluated the effect of zearalenone (ZEA), one of the most harmful mycotoxins on the structure of caecal microbiota in rabbits. Twenty-eight male weaned rabbits were randomly divided into four groups and orally given different concentrations of ZEA (400, 800, and 1600 μg/kg.b.w). Microbial communities in caecum samples of rabbits were analyzed for 16S rRNA by Illumina sequencing through Illumina Miseq platform after being fed for 28 days. The results showed that increasing ZEA doses increased the species richness but did not significantly increased the species diversity of the caecum microbiota in the rabbits. In addition, the caecum microbiota from the samples in different ZEA-treated groups was clustered according to their dosing regimens. At the phylum level, ZEA decreased the abundance of Actinobacteria and significantly increased the abundance of Cyanobacteria, Synergistetes, and Proteobacteria. At the genus level, there were declines in the abundance of Adlercreutzia, Blautia, Desulfitobacter, Lactobacillus, Oxalobacter, and p-75-a5. The decrease of abundance in Lactobacillus, Desulfitobacter, and p-75-a5 was particularly noticeable. In conclusion, zearalenone could increase α-diversity but significantly decrease the abundance of some bacteria with the important metabolic functions. These findings suggested that ZEA could modify the caecum microbiota.


Figures

Figure 1
Figure 1
Fragment length distribution of sequences from each sample after merging and trimming.
Figure 2
Figure 2
Rarefaction curves of the OTUs number at 97% similarity box plot for every sample. Green, blue, orange, and red indicate the 7 samples of control, low dose ZEA-treated group, middle dose ZEA-treated group, and high dose ZEA-treated group, respectively.
Figure 3
Figure 3
Relative abundance of the main bacterial communities found in each samples at Flylum level (a), Order level (b), and Genus level (c). C01-C07 represents the control group; 4001-4007 represent the low dose ZEA-treated group; 8001-8007 represent the middle dose ZEA-treated group; 16001-16007 represent the high dose ZEA-treated group.
Figure 4
Figure 4
Venn diagram summarizing the numbers of common and unique OTUs (3% distance level) among the four groups. Each circle represents a set of samples, the group between the circle and circle overlapping part digital represent of the common OTUs, and there is no overlapping part representing unique OTUs in each group. Pink represents the control group; blue represents the low dose ZEA-treated group; orange represents the middle dose ZEA-treated group; green represents the high dose ZEA-treated group.
Figure 5
Figure 5
The principal co-ordinates analysis (PCoA) with Unweighted Unifrac Distances of the rabbits caecum microbiota. The percentage represents contribution of principal component to the difference of samples. Each symbol represents each gut microbiota. red dot, the control group; blue dot, the low dose ZEA-treated group; yellow dot, the middle dose ZEA-treated group; green dot, the high dose ZEA-treated group. The points of different colors belong to different samples (groups). Each point represents one sample. The closer of the distance between two points means that the higher of the similarity and the smaller the difference of the microbial community structure between the two samples.
Figure 6
Figure 6
Multiple samples NMDS analysis of the rabbits caecum microbiota. Red circle, the control group; green square, the low dose ZEA-treated group; pink cross; the middle dose ZEA-treated; blue triangle, the high dose ZEA-treated group. The points of different colors belong to different samples (groups). Each point represents one sample. The closer of the distance between two points means that the higher of the similarity and the smaller the difference of the microbial community structure between the two samples.
Figure 7
Figure 7
The effect of zearalenone on the microbial community structure of caecum in rabbits by using PLS-DA (Partial Least Squares Discriminant Analysis) methods. Each point represents a sample, points of the same color belong to the same group, and points of the same group are marked with ellipses. If the samples belonging to the same grouping are closer to each other and the distance between the points of different grouping is farther, the classification model is better.
Figure 8
Figure 8
The significant different microbiota abundance in phylum level with the increase of the concentration of ZEA. The abscissa of the figure was groups and ordinate was taxa abundance. Red, the control group; green square, the low dose ZEA-treated group; blue; the middle dose ZEA-treated; purple, the high dose ZEA-treated group; p < 0.05 vs. control group; ∗∗p < 0.01 vs. control group.
Figure 9
Figure 9
The significant different microbiota abundance in genus level with the increase of the concentration of ZEA. The abscissa of the figure was groups and ordinate was taxa abundance. Red, the control group; green square, the low dose ZEA-treated group; blue; the middle dose ZEA-treated; purple, the high dose ZEA-treated group; p < 0.05 vs. control group; ∗∗p < 0.01 vs. control group.

Similar articles

Cited by

References

    1. DuPont A. W., DuPont H. L. The intestinal microbiota and chronic disorders of the gut. Nature Reviews Gastroenterology & Hepatology. 2011;8(9):523–531. doi: 10.1038/nrgastro.2011.133. - DOI - PubMed
    1. Sturme M. H. J., Kleerebezem M., Nakayama J., Akkermans A. D. L., Vaughan E. E., De Vos W. M. Cell to cell communication by autoinducing peptides in gram-positive bacteria. Antonie van Leeuwenhoek-Journal of Microbiology. 2002;81(1-4):233–243. doi: 10.1023/A:1020522919555. - DOI - PubMed
    1. Turnbaugh P. J., Ley R. E., Mahowald M. A., Magrini V., Mardis E. R., Gordon J. I. An obesity-associated gut microbiome with increased capacity for energy harvest. Nature. 2006;444(7122):1027–1031. doi: 10.1038/nature05414. - DOI - PubMed
    1. Boulangé C. L., Neves A. L., Chilloux J., Nicholson J. K., Dumas M. Impact of the gut microbiota on inflammation, obesity, and metabolic disease. Genome Medicine. 2016;8, article 42 doi: 10.1186/s13073-016-0303-2. - DOI - PMC - PubMed
    1. Rapozo D. C. M., Bernardazzi C., De Souza H. S. P. Diet and microbiota in inflammatory bowel disease: The gut in disharmony. World Journal of Gastroenterology. 2017;23(12):2124–2140. doi: 10.3748/wjg.v23.i12.2124. - DOI - PMC - PubMed

LinkOut - more resources