. 2018 Oct 31;4(10):eaau4788.
doi: 10.1126/sciadv.aau4788. eCollection 2018 Oct.

A single-cell survey of the human first-trimester placenta and decidua

Affiliations

A single-cell survey of the human first-trimester placenta and decidua

Hemant Suryawanshi et al. Sci Adv. .

Abstract

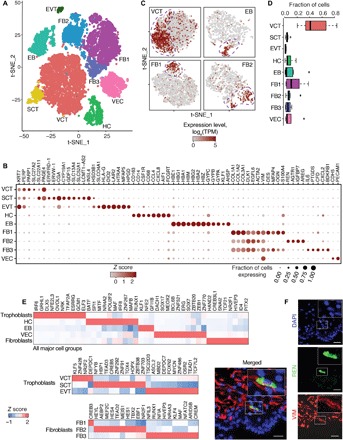
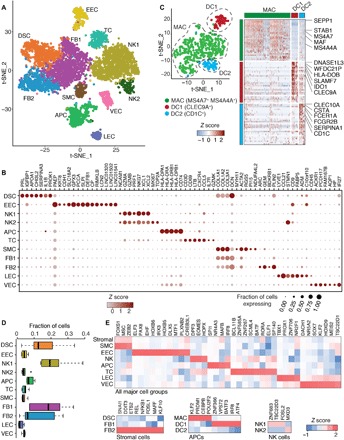
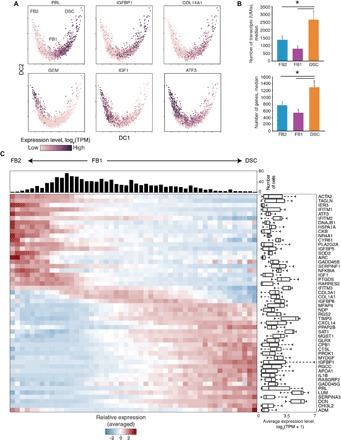
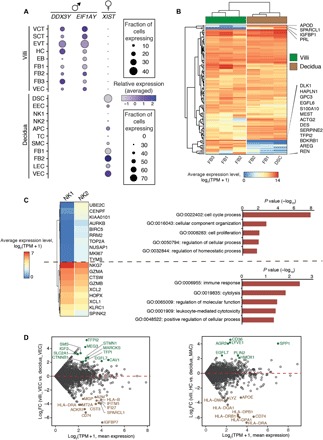
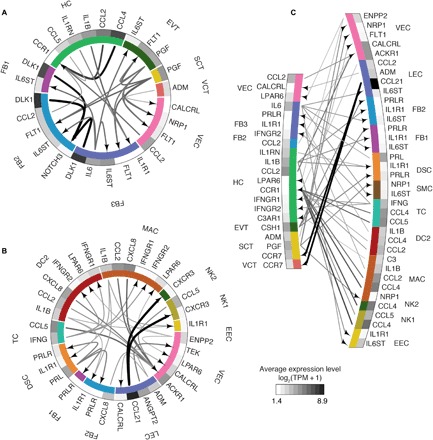
The placenta and decidua interact dynamically to enable embryonic and fetal development. Here, we report single-cell RNA sequencing of 14,341 and 6754 cells from first-trimester human placental villous and decidual tissues, respectively. Bioinformatic analysis identified major cell types, many known and some subtypes previously unknown in placental villi and decidual context. Further detailed analysis revealed proliferating subpopulations, enrichment of cell type-specific transcription factors, and putative intercellular communication in the fetomaternal microenvironment. This study provides a blueprint to further the understanding of the roles of these cells in the placenta and decidua for maintenance of early gestation as well as pathogenesis in pregnancy-related disorders.


Figures

Fig. 1
Fig. 1. Single-cell expression atlas of first-trimester villi.
(A) Cell type assignment following t-SNE–based visualization of expression differences for 14,341 single cells using established lineage markers. (B) Dot plots showing expression of known lineage markers and coexpressed lineage-specific genes. (C) Feature plots showing proliferating subpopulations of VCT, EB, FB1, and FB2 cells based on coexpression of proliferation marker MKI67, TOP2A, TK1, and PCNA. (D) Box plots highlighting the contribution of individual samples (n = 8) to each cell cluster. (E) TF enrichment analysis showing the most abundant (maximum of 10) and specific of TFs of major cell groups and individual cell types. (F) Immunofluorescence staining for FB2-specific REN (green) and pan-FB marker VIM (red). Scale bars, 25 μm.
Fig. 2
Fig. 2. Single-cell expression atlas of first-trimester decidua samples.
(A) Cell type assignment using established lineage markers following t-SNE–based visualization of 6754 single cells. (B) Expression data dot plots of known lineage markers and coexpressed lineage-specific genes. (C) Left: t-SNE visualization of APCs. Right: Differentially expressed genes in APC subpopulations. Wilcoxon rank sum test. (D) Box plots represent the contribution of samples (n = 6) to each cell cluster. (E) TF enrichment analysis showing the most abundant (maximum of 10) and specific expression of TFs by major cell groups and individual cell types.
Fig. 3
Fig. 3. Pseudotemporal ordering of stromal cells of the decidua.
(A) Diffusion maps of 1524 stromal cells from decidua showing expression pattern of genes over pseudotime trajectory. (B) Bar graphs representing number of UMIs and genes for FB1, FB2, and DSC cell types (n = 5, means ± SEM; *P < 0.05, unpaired t test). (C) Expression pattern over pseudotime for the top 50 most variable genes sorted along the DC1 coordinate. Box plots showing average expression level of genes.
Fig. 4
Fig. 4. Differential gene expression of villi and decidual cell type averaged profiles.
(A) Annotation of fetal and maternal origin for each cell type based on the expression of DDX3Y, EIF1AY, and XIST based on male fetus data (villi, n = 7; decidua, n = 4). (B) Unsupervised clustering analysis of the top 60 genes expressed in each ECM-expressing cell types of villi and decidua (except SMCs). (C) Left: Heatmap reporting average expression level [log2(TPM + 1)] of the top 10 differentially expressed genes in decidual NK1 and NK2 (top) and NK lineage marker genes (bottom). Right: Gene ontology (GO) terms enriched for genes in each of these panels. (D) Scatter plots depicting villi- versus decidual-specific gene expression [log2(TPM + 1)] based on log2 fold change (FC). Left, VECs; right, MACs/HCs.
Fig. 5
Fig. 5. Ligand-receptor interaction analysis.
Putative signaling within villi (A), decidua (B), and between villi and decidua cell types (C) with the size of the arrow stem proportionate to expression levels of the ligands. All the arrows are pointing to the receptors. Only ligands with >5 TPM and receptors with >1.5 TPM average expression were used for interaction analysis.

Similar articles

Cited by

References

    1. Maltepe E., Fisher S. J., Placenta: The forgotten organ. Annu. Rev. Cell Dev. Biol. 31, 523–552 (2015). - PubMed
    1. Garrido-Gomez T., Dominguez F., Quiñonero A., Diaz-Gimeno P., Kapidzic M., Gormley M., Ona K., Padilla-Iserte P., McMaster M., Genbacev O., Perales A., Fisher S. J., Simón C., Defective decidualization during and after severe preeclampsia reveals a possible maternal contribution to the etiology. Proc. Natl. Acad. Sci. U.S.A. 114, E8468–E8477 (2017). - PMC - PubMed
    1. Norwitz E. R., Schust D. J., Fisher S. J., Implantation and the survival of early pregnancy. N. Engl. J. Med. 345, 1400–1408 (2001). - PubMed
    1. Gude N. M., Roberts C. T., Kalionis B., King R. G., Growth and function of the normal human placenta. Thromb. Res. 114, 397–407 (2004). - PubMed
    1. Macosko E. Z., Basu A., Satija R., Nemesh J., Shekhar K., Goldman M., Tirosh I., Bialas A. R., Kamitaki N., Martersteck E. M., Trombetta J. J., Weitz D. A., Sanes J. R., Shalek A. K., Regev A., McCarroll S. A., Highly parallel genome-wide expression profiling of individual cells using nanoliter droplets. Cell 161, 1202–1214 (2015). - PMC - PubMed

Publication types

LinkOut - more resources