Wintertime stress, nursing, and lead exposure in Neanderthal children
- PMID: 30402544
- PMCID: PMC6209393
- DOI: 10.1126/sciadv.aau9483
Wintertime stress, nursing, and lead exposure in Neanderthal children
Abstract
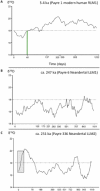
Scholars endeavor to understand the relationship between human evolution and climate change. This is particularly germane for Neanderthals, who survived extreme Eurasian environmental variation and glaciations, mysteriously going extinct during a cool interglacial stage. Here, we integrate weekly records of climate, tooth growth, and metal exposure in two Neanderthals and one modern human from southeastern France. The Neanderthals inhabited cooler and more seasonal periods than the modern human, evincing childhood developmental stress during wintertime. In one instance, this stress may have included skeletal mobilization of elemental stores and weight loss; this individual was born in the spring and appears to have weaned 2.5 years later. Both Neanderthals were exposed to lead at least twice during the deep winter and/or early spring. This multidisciplinary approach elucidates direct relationships between ancient environments and hominin paleobiology.
Figures


Similar articles
-
Neanderthal teeth from Moula-Guercy, Ardèche, France.Am J Phys Anthropol. 2013 Jul;151(3):477-91. doi: 10.1002/ajpa.22291. Epub 2013 Jun 4. Am J Phys Anthropol. 2013. PMID: 23737145
-
The Vindija Neanderthal scapular glenoid fossa: comparative shape analysis suggests evo-devo changes among Neanderthals.J Hum Evol. 2012 Feb;62(2):274-85. doi: 10.1016/j.jhevol.2011.11.010. Epub 2011 Dec 23. J Hum Evol. 2012. PMID: 22197062
-
Age estimates for hominin fossils and the onset of the Upper Palaeolithic at Denisova Cave.Nature. 2019 Jan;565(7741):640-644. doi: 10.1038/s41586-018-0870-z. Epub 2019 Jan 30. Nature. 2019. PMID: 30700871
-
Between a rock and a cold place: Neanderthal biocultural cold adaptations.Evol Anthropol. 2021 Jul;30(4):262-279. doi: 10.1002/evan.21894. Epub 2021 Apr 2. Evol Anthropol. 2021. PMID: 33797824 Review.
-
Issues of theory and method in the analysis of Paleolithic mortuary behavior: A view from Shanidar Cave.Evol Anthropol. 2020 Sep;29(5):263-279. doi: 10.1002/evan.21854. Epub 2020 Jul 11. Evol Anthropol. 2020. PMID: 32652819 Review.
Cited by
-
Epidemics and outbreaks of peripheral nervous system disorders: II. Toxic and nutritional causes.J Neurol. 2021 Mar;268(3):892-902. doi: 10.1007/s00415-020-10216-8. Epub 2020 Sep 11. J Neurol. 2021. PMID: 32915310 Free PMC article.
-
Life history in primate teeth is revealed by changes in major and minor element concentrations measured via field-emission SEM-EDS analysis.Biol Lett. 2023 Jan;19(1):20220438. doi: 10.1098/rsbl.2022.0438. Epub 2023 Jan 18. Biol Lett. 2023. PMID: 36651149 Free PMC article.
-
Fine-scaled climate variation in equatorial Africa revealed by modern and fossil primate teeth.Proc Natl Acad Sci U S A. 2022 Aug 30;119(35):e2123366119. doi: 10.1073/pnas.2123366119. Epub 2022 Aug 22. Proc Natl Acad Sci U S A. 2022. PMID: 35994633 Free PMC article.
-
Modeling enamel matrix secretion in mammalian teeth.PLoS Comput Biol. 2019 May 29;15(5):e1007058. doi: 10.1371/journal.pcbi.1007058. eCollection 2019 May. PLoS Comput Biol. 2019. PMID: 31141513 Free PMC article.
-
How does the early life environment influence the oral microbiome and determine oral health outcomes in childhood?Bioessays. 2021 Sep;43(9):e2000314. doi: 10.1002/bies.202000314. Epub 2021 Jun 20. Bioessays. 2021. PMID: 34151446 Free PMC article.
References
-
- Potts R., Evolution and climate variability. Science 273, 922–923 (1996).
-
- Potts R., Behrensmeyer A. K., Faith J. T., Tryon C. A., Brooks A. S., Yellen J. E., Deino A. L., Kinyanjui R., Clark J. B., Haradon C. M., Levin N. E., Meijer H. J. M., Veatch E. G., Owen R. B., Renaut R. W., Environmental dynamics during the onset of the Middle Stone Age in eastern Africa. Science 360, 86–90 (2018). - PubMed
-
- Bocquet-Appel J.-P., Tuffreau A., Technological responses of Neanderthals to macroclimatic variations (240,000–40,000 BP). Hum. Biol. 81, 287–307 (2009). - PubMed
-
- S. E. Churchill, Thin on the Ground: Neandertal Biology, Archeology, and Ecology (Wiley, 2014).
-
- Dansgaard W., Stable isotopes in precipitation. Tellus 16, 436–468 (1964).
Publication types
MeSH terms
Substances
Grants and funding
LinkOut - more resources
Full Text Sources
Molecular Biology Databases

