. 2019 Mar;40(4):1114-1138.
doi: 10.1002/hbm.24433. Epub 2018 Nov 7.

Evaluation of different cerebrospinal fluid and white matter fMRI filtering strategies-Quantifying noise removal and neural signal preservation

Affiliations

Evaluation of different cerebrospinal fluid and white matter fMRI filtering strategies-Quantifying noise removal and neural signal preservation

Marek Bartoň et al. Hum Brain Mapp. 2019 Mar.

Abstract

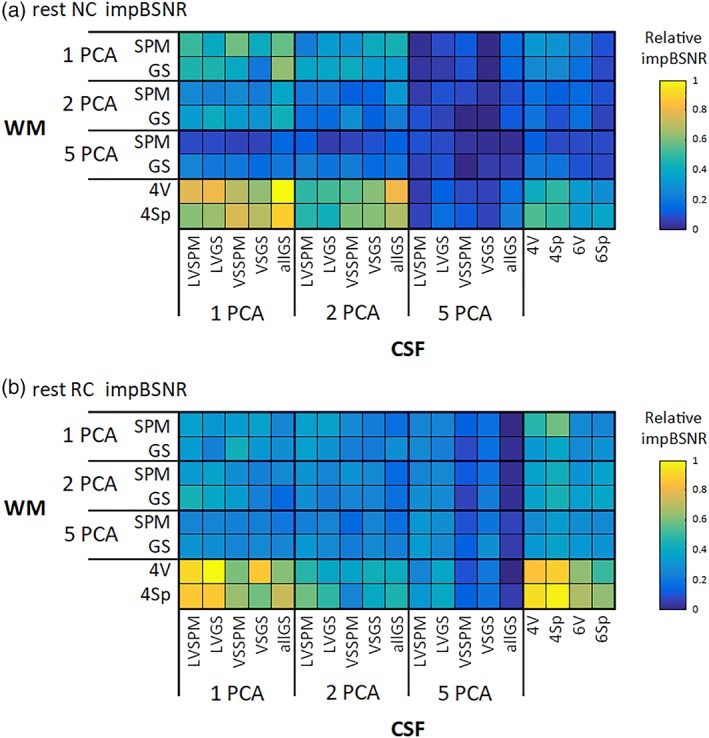
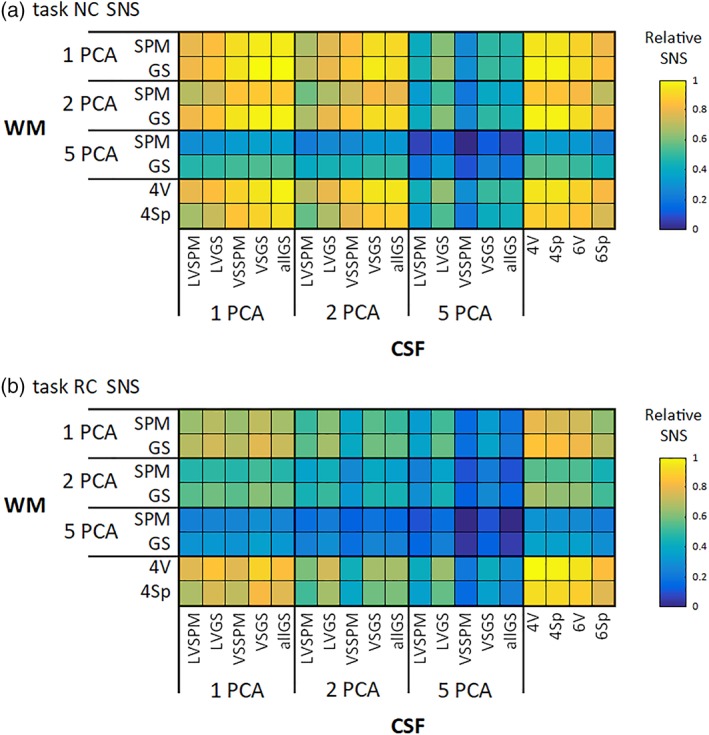
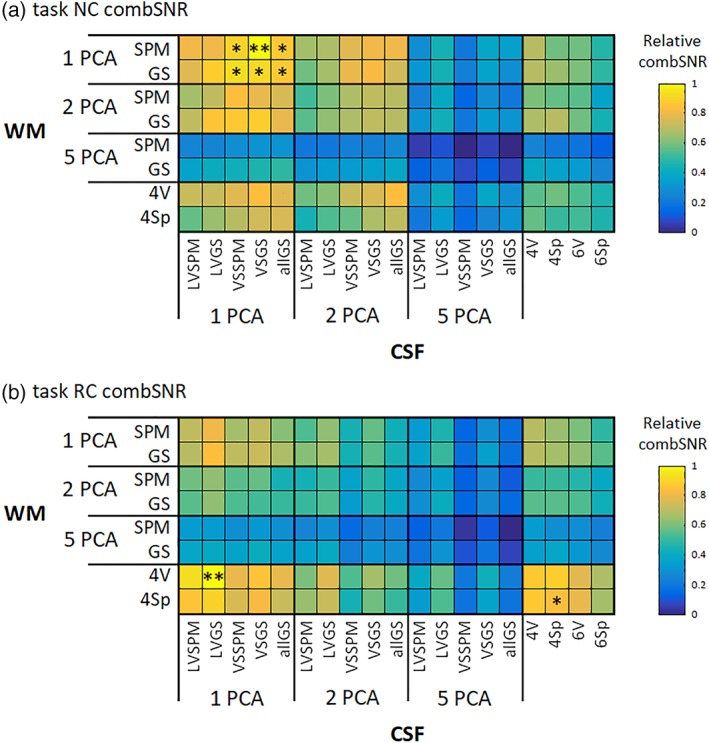
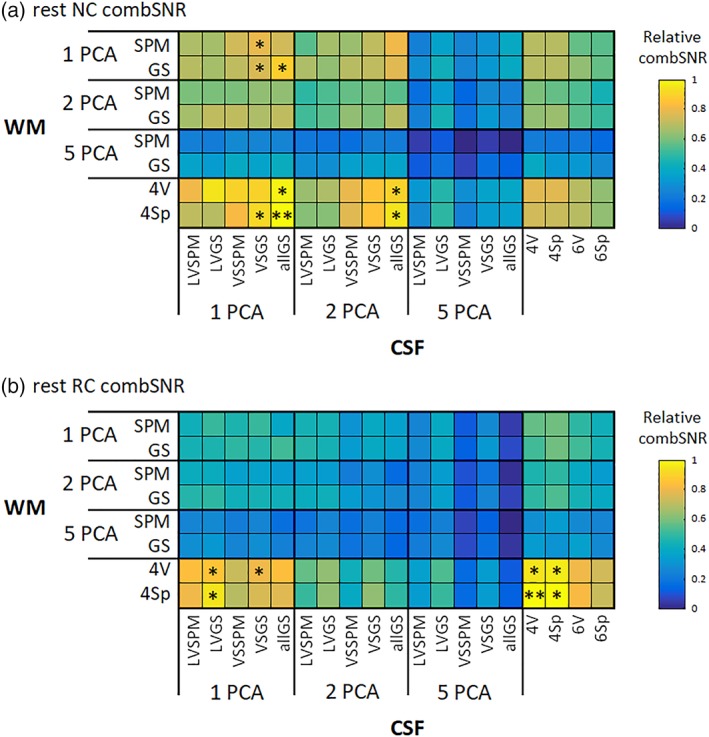
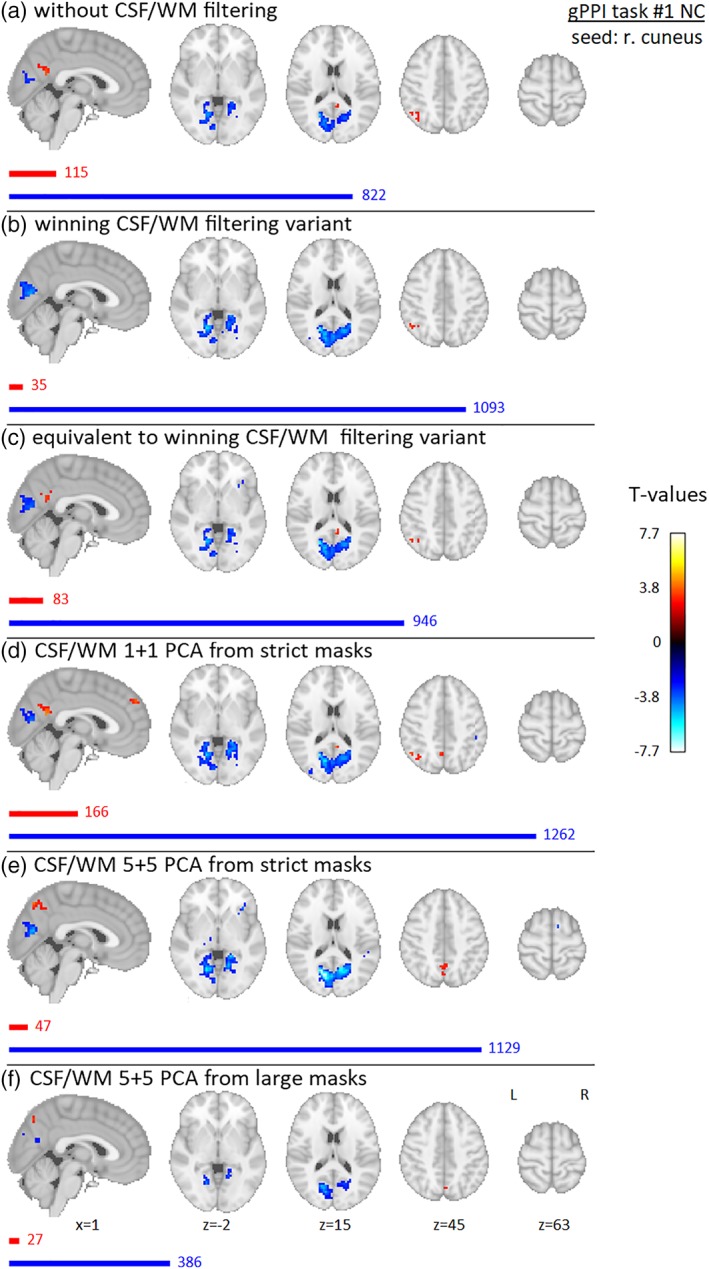
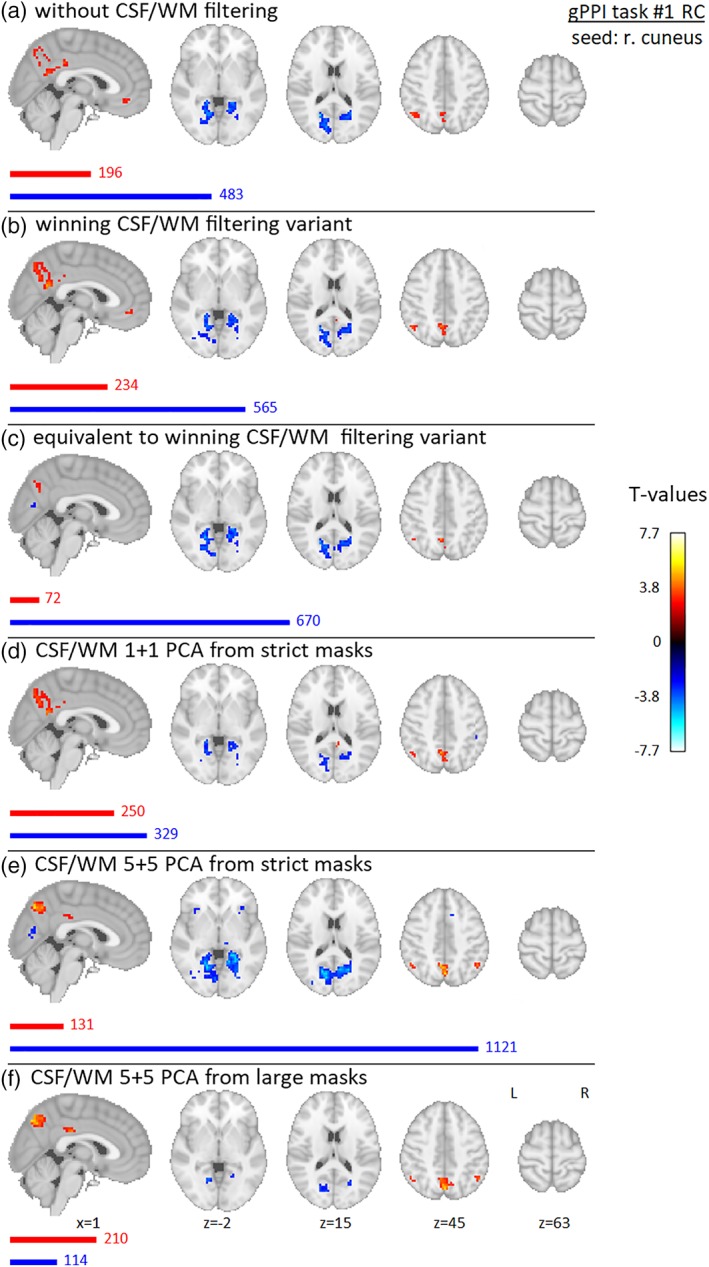
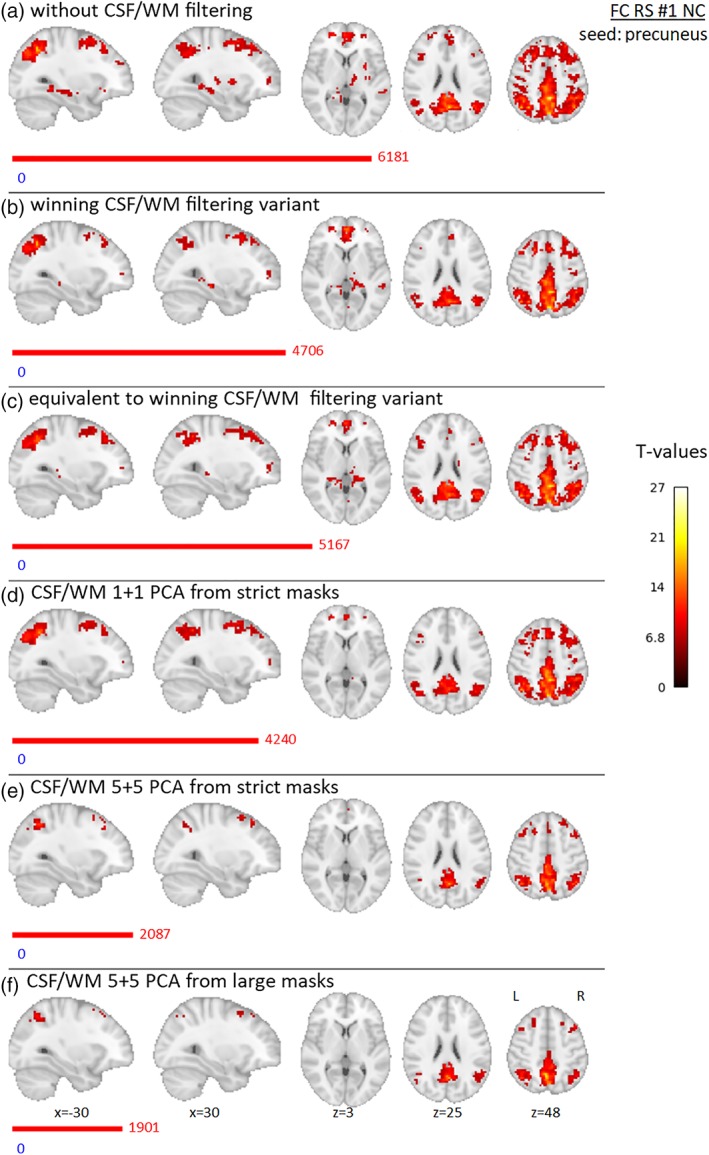
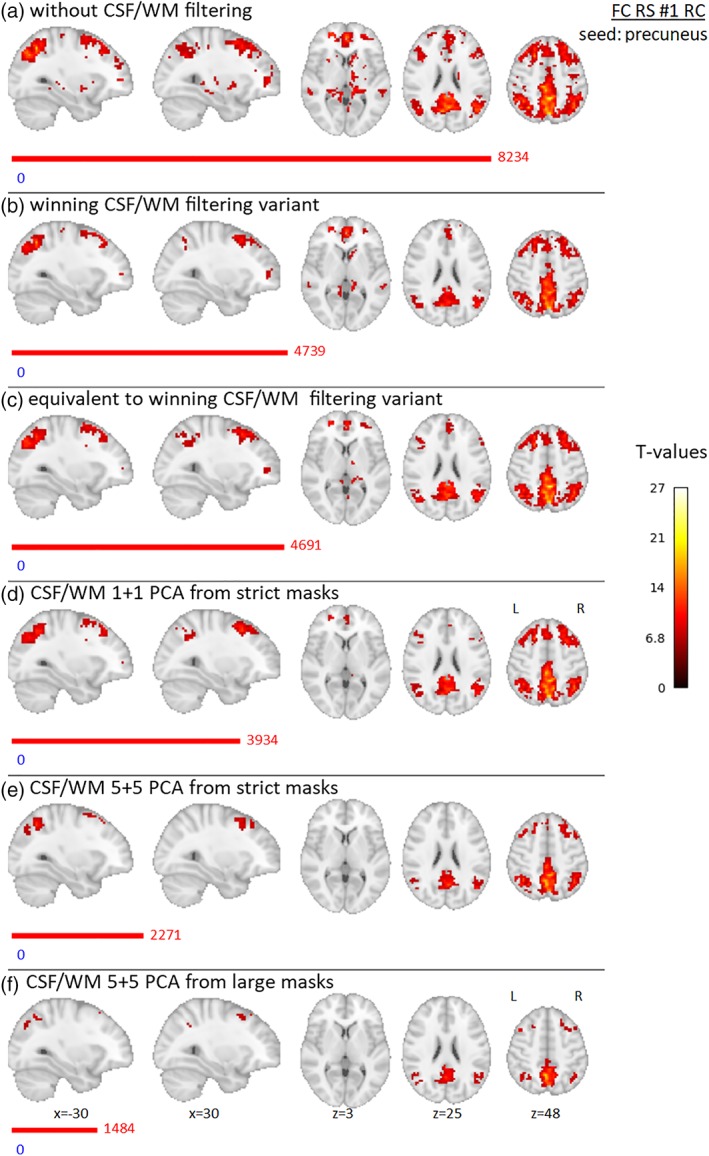
This study examines the impact of using different cerebrospinal fluid (CSF) and white matter (WM) nuisance signals for data-driven filtering of functional magnetic resonance imaging (fMRI) data as a cleanup method before analyzing intrinsic brain fluctuations. The routinely used temporal signal-to-noise ratio metric is inappropriate for assessing fMRI filtering suitability, as it evaluates only the reduction of data variability and does not assess the preservation of signals of interest. We defined a new metric that evaluates the preservation of selected neural signal correlates, and we compared its performance with a recently published signal-noise separation metric. These two methods provided converging evidence of the unfavorable impact of commonly used filtering approaches that exploit higher numbers of principal components from CSF and WM compartments (typically 5 + 5 for CSF and WM, respectively). When using only the principal components as nuisance signals, using a lower number of signals results in a better performance (i.e., 1 + 1 performed best). However, there was evidence that this routinely used approach consisting of 1 + 1 principal components may not be optimal for filtering resting-state (RS) fMRI data, especially when RETROICOR filtering is applied during the data preprocessing. The evaluation of task data indicated the appropriateness of 1 + 1 principal components, but when RETROICOR was applied, there was a change in the optimal filtering strategy. The suggested change for extracting WM (and also CSF in RETROICOR-corrected RS data) is using local signals instead of extracting signals from a large mask using principal component analysis.

Keywords: RETROICOR; cerebrospinal fluid; fMRI; filtering; functional connectivity; nuisance regression; principal component analysis; psychophysiological interactions; white matter.


Figures

Figure 1
Figure 1
Masks for CSF signal extraction for Data set 1; (a) masks corresponding to Variants 1 to 15 from Table 2; (b) masks corresponding to Variants 16 to 19. The ∪ stands for union operation. Coordinates for single voxels/sphere centers (x, y, z) in millimeters in the standard MNI space: anterior horn of right lateral ventricle (3, 14, 8); anterior horn of left lateral ventricle (−3, 14, 8); posterior horn of right lateral ventricle (18, −31, 20); posterior horn of left lateral ventricle (−18, −37, 17); third ventricle (0, −25, 8); and superior cistern (0, −40, −1) [Color figure can be viewed at http://wileyonlinelibrary.com]
Figure 2
Figure 2
Masks for WM signal extraction for Data set 1; (a) masks corresponding to Variants 1 to 6 from Table 3; (b) masks corresponding to Variants 7 and 8. Coordinates for single voxels/sphere centers (x, y, z) in millimeters in the standard MNI space: anterior right (21, 11, 32); anterior left (−21, 11, 32); posterior right (30, −10, 29); and posterior left (−30, −10, 29) [Color figure can be viewed at http://wileyonlinelibrary.com]
Figure 3
Figure 3
Schematic pipeline depiction of fMRI data preprocessing and computation of the impBSNR and SNS for various CSF/WM nuisance signal filtering. The gray fields are the inputs and the fields with bold boundaries are the outputs
Figure 4
Figure 4
Relative values of the impBSNR metric for (a) NC and (b) RC task data across all combinations of CSF/WM regressor sets. The values are collapsed across all mergeable factors and medians across subjects are shown [Color figure can be viewed at http://wileyonlinelibrary.com]
Figure 5
Figure 5
Relative values of the impBSNR metric for (a) NC and (b) RC RS data across all combinations of CSF/WM regressor sets. The values are collapsed across all mergeable factors, and medians across subjects are shown [Color figure can be viewed at http://wileyonlinelibrary.com]
Figure 6
Figure 6
Relative values of the SNS metric for (a) NC and (b) RC task data across all combinations of CSF/WM regressor sets. The values are medians across subjects [Color figure can be viewed at http://wileyonlinelibrary.com]
Figure 7
Figure 7
Relative values of the SNS metric for (a) NC and (b) RC RS data across all combinations of CSF/WM regressor sets. The values are medians across subjects [Color figure can be viewed at http://wileyonlinelibrary.com]
Figure 8
Figure 8
Relative values of the combination of impBSNR and SNS metrics (i.e., combSNR) for (a) NC and (b) RC task data across all combinations of CSF/WM regressor sets. The values are medians across subjects. The best filtering option is marked by two asterisks; the equivalent options are marked by a single asterisk [Color figure can be viewed at http://wileyonlinelibrary.com]
Figure 9
Figure 9
Relative values of the combination of impBSNR and SNS metrics (i.e., combSNR) for (a) NC and (b) RC RS data across all combinations of CSF/WM regressor sets. The values are medians across subjects. The best filtering option is marked by two asterisks; the equivalent options are marked by a single asterisk [Color figure can be viewed at http://wileyonlinelibrary.com]
Figure 10
Figure 10
Results of group gPPI effect seeded in right cuneus (flickering checkerboards vs resting baseline) for Data set 1, NC preprocessing variant, for different filtering strategies—(a) without filtering of CSF/WM signals, (b) winning variant (1 + 1 PCA components from CSF mask of group‐specific ventricular system and WM general template), (c) equivalent variant (1 + 1 PCA components from group‐specific CSF mask of whole CSF compartment and group‐specific WM mask), (d) 1 + 1 PCA components from strict masks (group‐specific mask of lateral ventricles and group‐specific WM mask), (e) 5 + 5 PCA components from strict masks (same as in (d)), (f) 5 + 5 PCA components from “large” masks (group‐specific CSF mask of whole CSF compartment and general WM template). Nineteen subjects were involved in the analysis, and gender was added into the group model as a covariate of no interest. Maps are thresholded at p < .005 uncorrected for multiple comparisons. Red and blue bars with corresponding numbers indicate the numbers of significant voxels with positive and negative effects respectively [Color figure can be viewed at http://wileyonlinelibrary.com]
Figure 11
Figure 11
Results of group gPPI effect seeded in right cuneus (flickering checkerboards vs resting baseline) for Data set 1, RC preprocessing variant, for different filtering strategies—(a) without filtering of CSF/WM signals, (b) winning variant (one PCA component from CSF mask of group‐specific lateral ventricles and four WM signals from single voxels located in WM), (c) equivalent variant (four CSF mean signals from spheres located in group‐specific CSF map and four WM mean signals from spheres located in group‐specific WM map), (d) 1 + 1 PCA components from strict masks (group‐specific mask of lateral ventricles and group‐specific WM mask), (e) 5 + 5 PCA components from strict masks (same as in (d)), (f) 5 + 5 PCA components from “large” masks (group‐specific CSF mask of whole CSF compartment and general WM template). Nineteen subjects were involved in the analysis, and gender was added into the group model as a covariate of no interest. Maps are thresholded at p < .005, uncorrected for multiple comparisons. Red and blue bars with corresponding numbers indicate the numbers of significant voxels with positive and negative effects respectively [Color figure can be viewed at http://wileyonlinelibrary.com]
Figure 12
Figure 12
Results of group precuneus RS FC effect for Data set 1, NC preprocessing variant, for different filtering strategies—(a) without filtering of CSF/WM signals, (b) winning variant (one PCA component from group‐specific CSF mask of whole CSF compartment and four WM mean signals from spheres located in group‐specific WM map), (c) equivalent variant (1 + 1 PCA components from group‐specific CSF mask of whole CSF compartment and from group‐specific WM mask), (d) 1 + 1 PCA components from strict masks (group‐specific mask of lateral ventricles and group‐specific WM mask), (e) 5 + 5 PCA components from strict masks (same as in (d)), (f) 5 + 5 PCA components from “large” masks (group‐specific CSF mask of whole CSF compartment and general WM template). Nineteen subjects were involved in the analysis, and gender was added into the group model as a covariate of no interest. Maps are thresholded at p < .05, FWE corrected for multiple comparisons. Red and blue bars with corresponding numbers indicate the numbers of significant voxels with positive and negative effects respectively [Color figure can be viewed at http://wileyonlinelibrary.com]
Figure 13
Figure 13
Results of group precuneus RS FC effect for Data set 1, RC preprocessing variant, for different filtering strategies—(a) without filtering of CSF/WM signals, (b) winning variant (four single voxels in CSF and four WM mean signals from spheres located in group‐specific WM map), (c) equivalent variant (one PCA component from CSF mask of group‐specific lateral ventricles and four WM signals from single voxels located in WM), (d) 1 + 1 PCA components from strict masks (group‐specific mask of lateral ventricles and group‐specific WM mask), (e) 5 + 5 PCA components from strict masks (same as in (d)), (f) 5 + 5 PCA components from “large” masks (group‐specific CSF mask of whole CSF compartment and general WM template). Nineteen subjects were involved in the analysis, and gender was added into the group model as a covariate of no interest. Maps are thresholded at p < .05, FWE corrected for multiple comparisons. Red and blue bars with corresponding numbers indicate the numbers of significant voxels with positive and negative effects respectively [Color figure can be viewed at http://wileyonlinelibrary.com]

References

    1. Arbabshirani, M. R. , Havlicek, M. , Kiehl, K. A. , Pearlson, G. D. , & Calhoun, V. D. (2013). Functional network connectivity during rest and task conditions: A comparative study. Human Brain Mapping, 34, 2959–2971. - PMC - PubMed
    1. Baniqued, P. L. , Gallen, C. L. , Voss, M. W. , Burzynska, A. Z. , Wong, C. N. , Cooke, G. E. , … D'Esposito, M. (2018). Brain network modularity predicts exercise‐related executive function gains in older adults. Frontiers in Aging Neuroscience, 9. - PMC - PubMed
    1. Barton, M. , Marecek, R. , Rektor, I. , Filip, P. , Janousova, E. , & Mikl, M. (2015). Sensitivity of PPI analysis to differences in noise reduction strategies. Journal of Neuroscience Methods, 253, 218–232. - PubMed
    1. Behzadi, Y. , Restom, K. , Liau, J. , & Liu, T. T. (2007). A component based noise correction method (CompCor) for BOLD and perfusion based fMRI. NeuroImage, 37, 90–101. - PMC - PubMed
    1. Birn, R. M. , Smith, M. A. , Jones, T. B. , & Bandettini, P. A. (2008). The respiration response function: The temporal dynamics of fMRI signal fluctuations related to changes in respiration. NeuroImage, 40, 644–654. - PMC - PubMed

Publication types