

Inhibition, shifting and updating in relation to psychometric intelligence across ability groups in the psychiatric population
- PMID: 30403315
- PMCID: PMC7379311
- DOI: 10.1111/jir.12559
Inhibition, shifting and updating in relation to psychometric intelligence across ability groups in the psychiatric population
Abstract
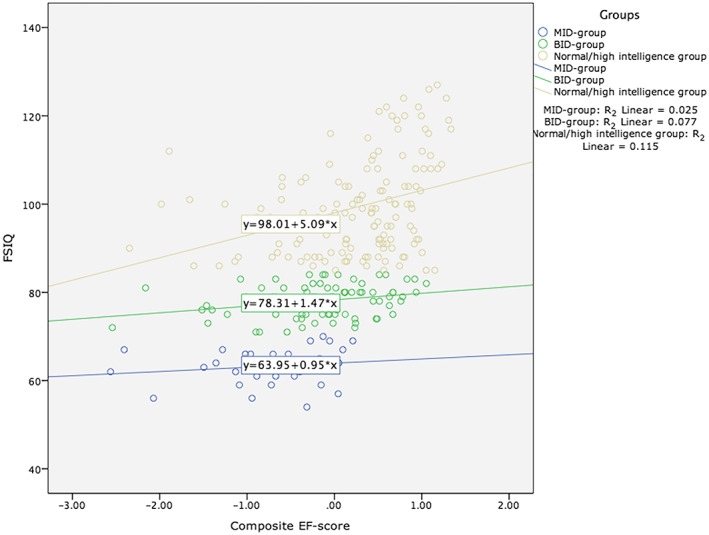
Background: Assessment of intelligence and executive function (EF) is common in complex neuropsychiatric practice. Although previous studies have shown that EF and intelligence are related, it is unknown whether these constructs relate to one another in a similar manner across different ability groups (mild intellectual disability, borderline intellectual disability and normal/high intelligence). This study therefore examines the relation between three EFs (inhibition, shifting and updating) and intelligence in a heterogeneous psychiatric sample. It is hypothesised that the strength of the relation between intelligence and the three EFs decreases when the level of intelligence increases, in accordance with Spearman's Law of Diminishing Returns.
Methods: In a cross-sectional, between and within subject design, one of the three intelligence tests (Kaufman Adolescent and Adult Intelligence Test and Wechsler Adult Intelligence Scale - third and fourth editions) and several EF tests (Stroop Colour-Word Test, Trail Making Test and Spatial Working Memory task) were administered to 250 neuropsychiatric inpatients and outpatients (Mage = 39.8, standard deviation = 14.3, 52.8% male). Based upon their full-scale IQ score, patients were divided into three ability groups (mild intellectual disability, borderline intellectual disability or normal/high intelligence). The relation between EF and intelligence was assessed through analyses of the correlation pattern; groups were compared using analysis of covariance.
Results: Analyses showed significant correlations between the constructs of EF and intelligence. A significant interaction effect was found for shifting, with highest correlations in the normal to high intelligence group, but not for inhibition and updating.
Conclusions: Results support a specific role for shifting in this EF-intelligence relation. The correlational pattern of updating and intelligence, as well as the differential relation of shifting and intelligence across ability groups, suggests that EF tasks may not measure distinct EFs in lower intellectual ability but rely on cognitive primitives such as processing speed. EF tasks can be considered less valid indicators of EF ability. Implications in terms of the need for development of specific tasks to measure cognition in low intellectual ability are discussed.
Keywords: IQ; contextual neuropsychology; executive function; intellectual disability; neuropsychiatry.
© 2018 The Authors. Journal of Intellectual Disability Research published by MENCAP and International Association of the Scientific Study of Intellectual and Developmental Disibilities and John Wiley & Sons Ltd.
Conflict of interest statement
The authors declare no conflict of interest.
Figures

References
-
- Anderson M. (1992) Intelligence and Development: A Cognitive Theory. Blackwell Publishing, Malden.
-
- Arffa S. (2007) The relationship of intelligence to executive function and non‐executive function measures in a sample of average, above average, and gifted youth. Archives of Clinical Neuropsychology 22, 969–978. - PubMed
-
- Barkley R. A. (2012) Executive Functions: What They Are, How They Work, and Why They Evolved. Guilford Press, New York.
-
- Bouma A., Mulder J., Lindeboom J. & Schmand B. (2012) Handboek Neuropsychologische Diagnostiek (2e herz. druk). Pearson Assessment and Information B.V, Amsterdam.
-
- Bouma J. M., Mulder J., Altena E., Schmand B. & Lindeboom J. (2012) Stroop Kleur‐Woord Test (Stroop KWT) In: Handboek Neuropsychologische Diagnostiek (eds Bouma J. M., Lindeboom J. & Schmand B.). pp. 475–509. Pearson Assessment and Information B.V, Amsterdam.
MeSH terms
LinkOut - more resources
Full Text Sources
Medical
