

Characterization of the endocannabinoid system in subcutaneous adipose tissue in periparturient dairy cows and its association to metabolic profiles
- PMID: 30403679
- PMCID: PMC6221292
- DOI: 10.1371/journal.pone.0205996
Characterization of the endocannabinoid system in subcutaneous adipose tissue in periparturient dairy cows and its association to metabolic profiles
Abstract
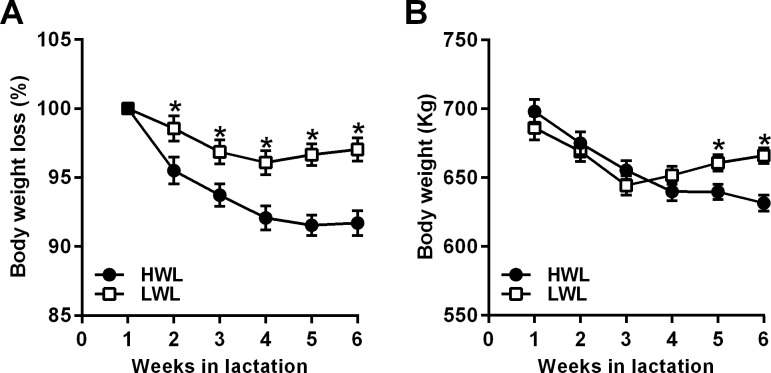
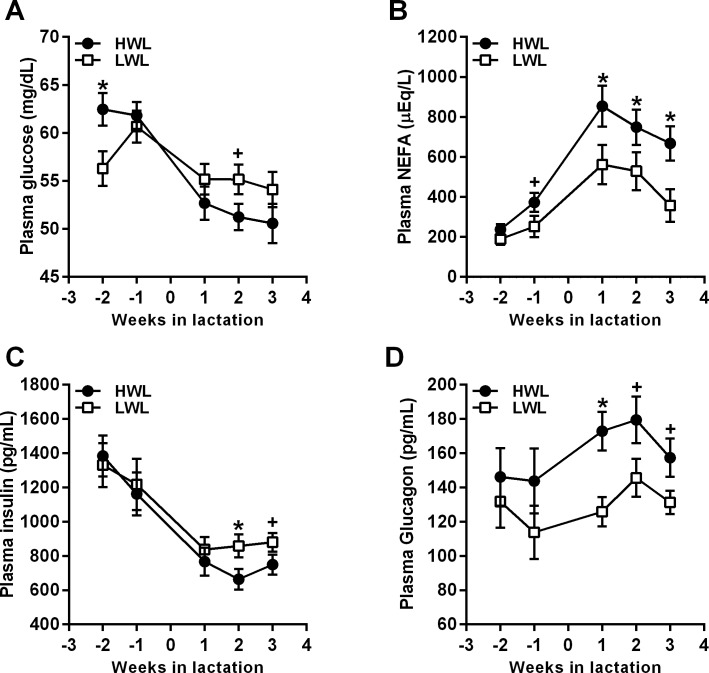
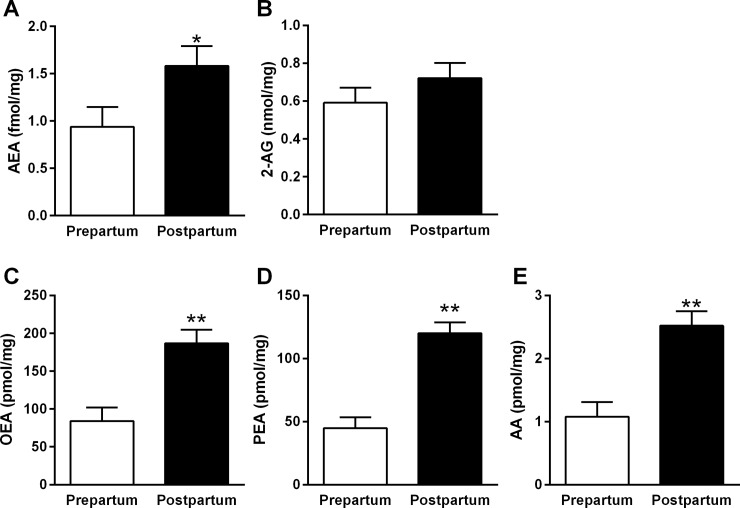
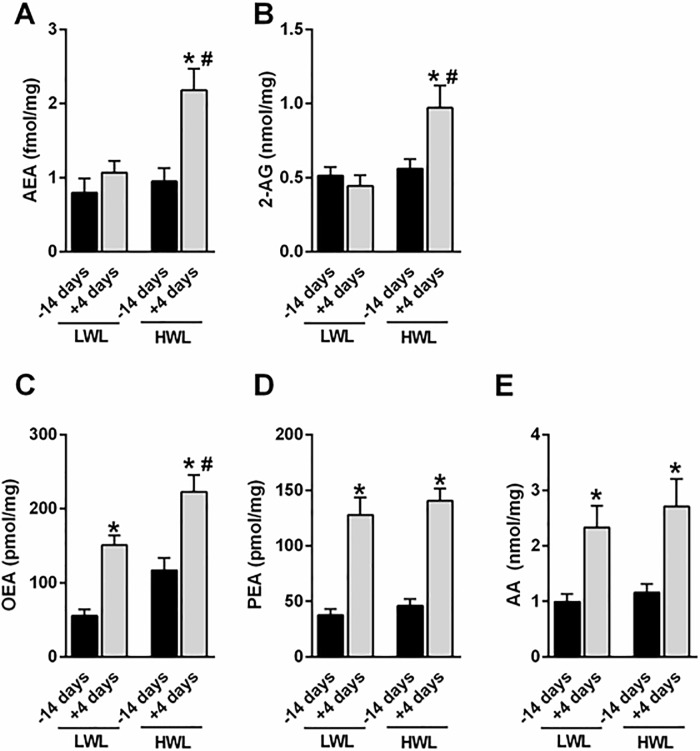
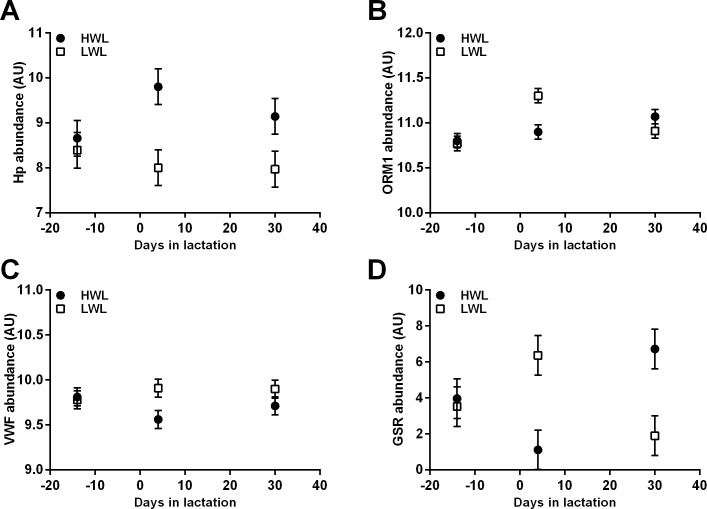
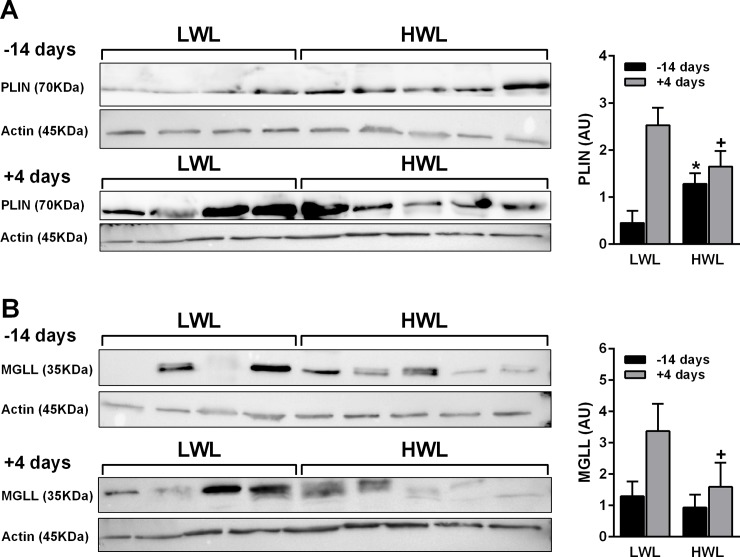
Adipose tissue (AT) plays a major role in metabolic adaptations in postpartum (PP) dairy cows. The endocannabinoid (eCB) system is a key regulator of metabolism and energy homeostasis; however, information about this system in ruminants is scarce. Therefore, this work aimed to assess the eCB system in subcutaneous AT, and to determine its relation to the metabolic profile in peripartum cows. Biopsies of AT were performed at 14 d prepartum, and 4 and 30 d PP from 18 multiparous peripartum cows. Cows were categorized retrospectively according to those with high body weight (BW) loss (HWL, 8.5 ± 1.7% BW loss) or low body weight loss (LWL, 2.9 ± 2.5% BW loss) during the first month PP. The HWL had higher plasma non-esterified fatty acids and a lower insulin/glucagon ratio PP than did LWL. Two-fold elevated AT levels of the main eCBs, N-arachidonoylethanolamine (AEA) and 2-arachidonoylglycerol (2-AG), were found 4 d PP compared with prepartum in HWL, but not in LWL cows. AT levels of the eCB-like molecules oleoylethanolamide, palmitoylethanolamide, and of arachidonic acid were elevated PP compared with prepartum in all cows. The abundance of monoglyceride lipase (MGLL), the 2-AG degrading enzyme, was lower in HWL vs. LWL AT PP. The relative gene expression of the cannabinoid receptors CNR1 and CNR2 in AT tended to be higher in HWL vs. LWL PP. Proteomic analysis of AT showed an enrichment of the inflammatory pathways' acute phase signaling and complement system in HWL vs. LWL cows PP. In summary, eCB levels in AT were elevated at the onset of lactation as part of the metabolic adaptations in PP dairy cows. Furthermore, activating the eCB system in AT is most likely associated with a metabolic response of greater BW loss, lipolysis, and AT inflammation in PP dairy cows.
Conflict of interest statement
The authors have declared that no competing interests exist.
Figures
References
-
- Drackley JK. ADSA Foundation Scholar Award. Biology of dairy cows during the transition period: the final frontier? J Dairy Sci. 1999;82: 2259–73. Available: http://www.ncbi.nlm.nih.gov/pubmed/10575597 - PubMed
-
- Bell AW, Bauman DE. Adaptations of glucose metabolism during pregnancy and lactation. J Mammary Gland Biol Neoplasia. 1997;2: 265–78. Available: http://www.ncbi.nlm.nih.gov/pubmed/10882310 - PubMed
-
- Chilliard Y, Ferlay A, Faulconnier Y, Bonnet M, Rouel J, Bocquier F. Adipose tissue metabolism and its role in adaptations to undernutrition in ruminants. Proc Nutr Soc. 2000;59: 127–34. Available: http://www.ncbi.nlm.nih.gov/pubmed/10828182 - PubMed
-
- Hammon HM, Stürmer G, Schneider F, Tuchscherer A, Blum H, Engelhard T, et al. Performance and metabolic and endocrine changes with emphasis on glucose metabolism in high-yielding dairy cows with high and low fat content in liver after calving. J Dairy Sci. 2009;92: 1554–66. 10.3168/jds.2008-1634 - DOI - PubMed
-
- Zachut M, Honig H, Striem S, Zick Y, Boura-Halfon S, Moallem U. Periparturient dairy cows do not exhibit hepatic insulin resistance, yet adipose-specific insulin resistance occurs in cows prone to high weight loss. J Dairy Sci. American Dairy Science Association; 2013;96: 5656–69. Available: http://www.ncbi.nlm.nih.gov/pubmed/23871373 10.3168/jds.2012-6142 - DOI - PubMed
Publication types
MeSH terms
Substances
LinkOut - more resources
Full Text Sources
Miscellaneous
