. 2018 Nov 7;13(11):e0206123.
doi: 10.1371/journal.pone.0206123. eCollection 2018.

Structure of the Golgi apparatus is not influenced by a GAG deletion mutation in the dystonia-associated gene Tor1a

Affiliations

Structure of the Golgi apparatus is not influenced by a GAG deletion mutation in the dystonia-associated gene Tor1a

Sara B Mitchell et al. PLoS One. .

Abstract

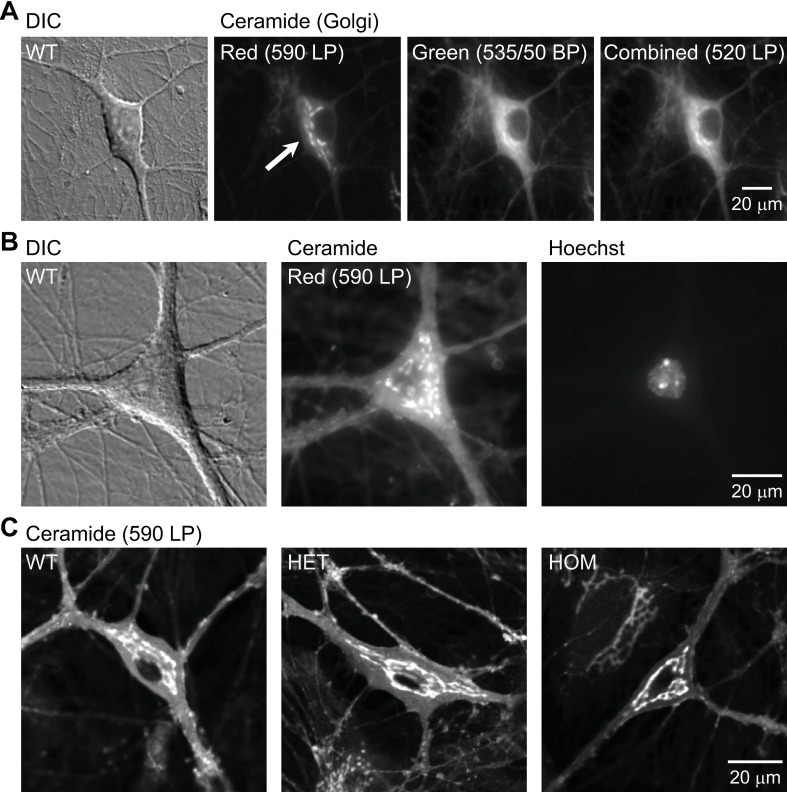
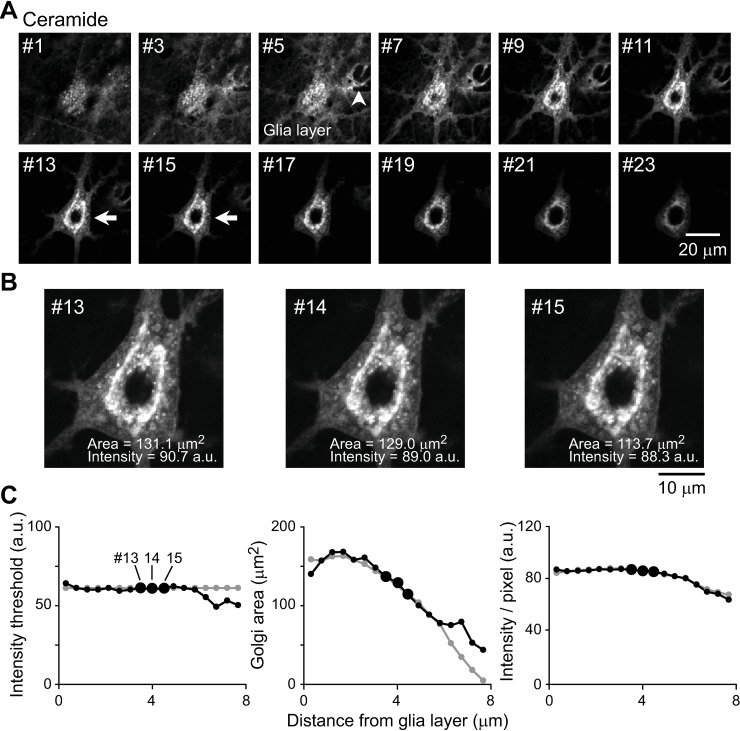
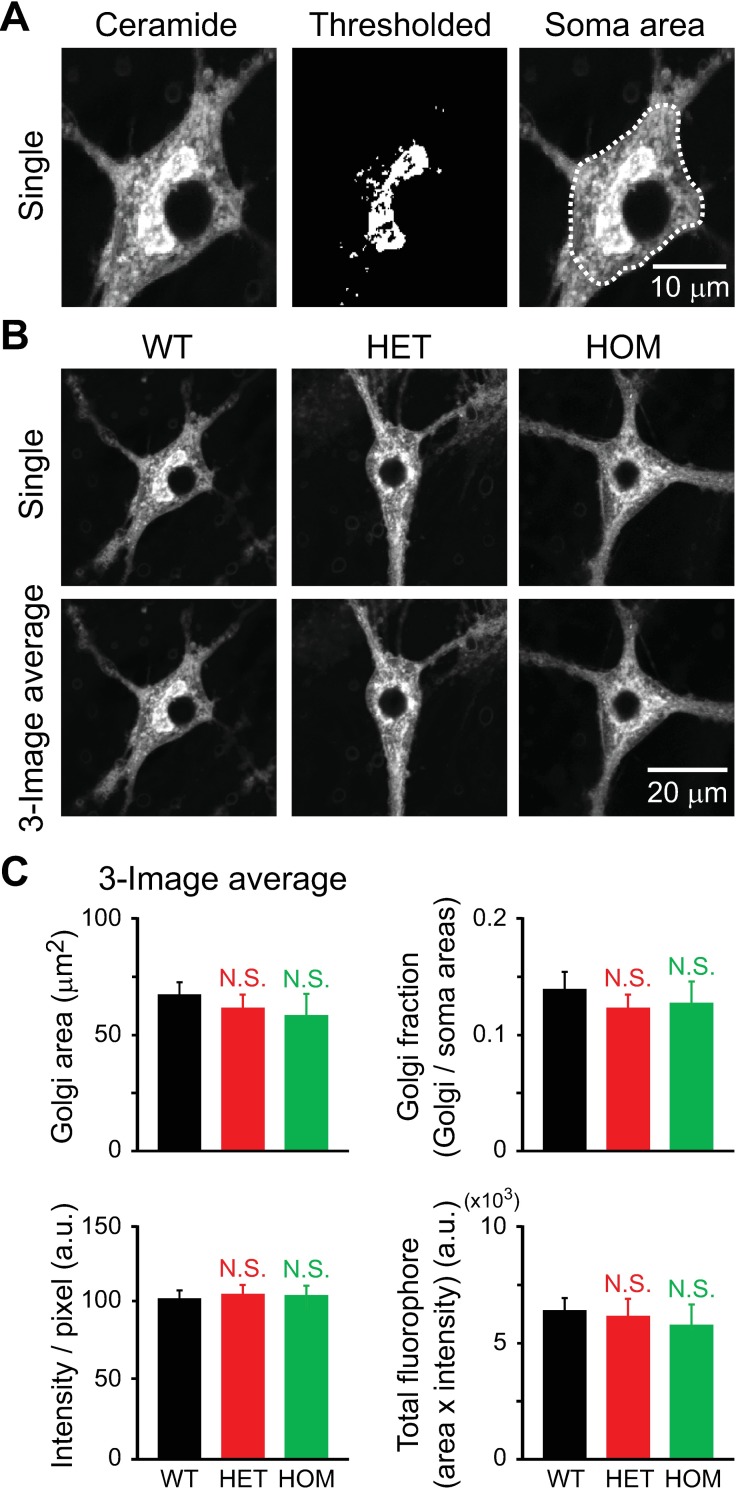
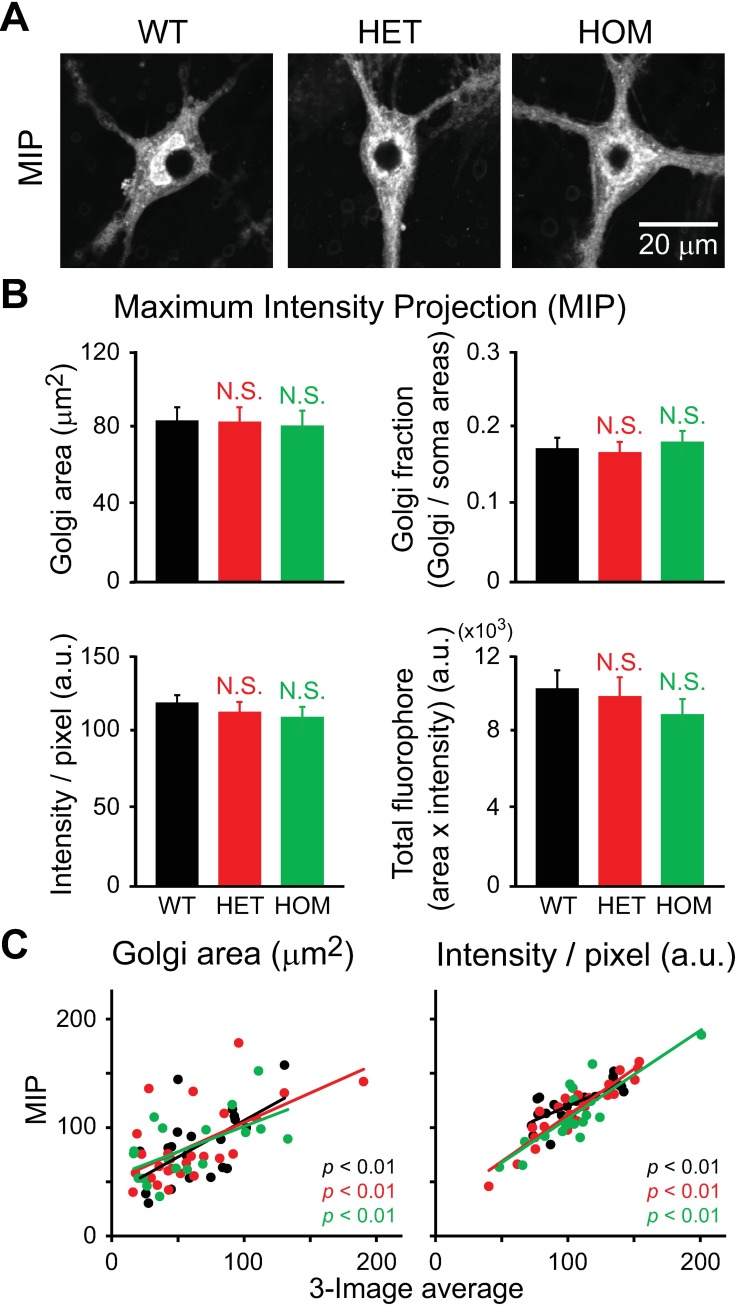
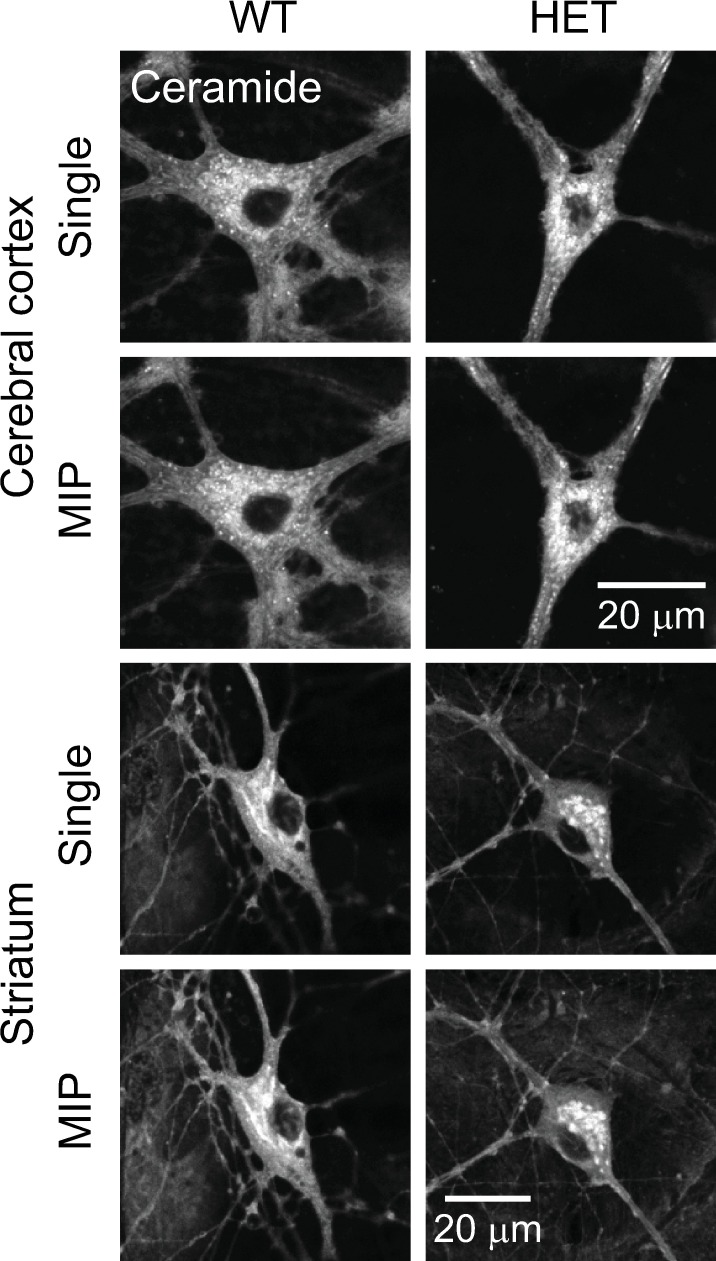
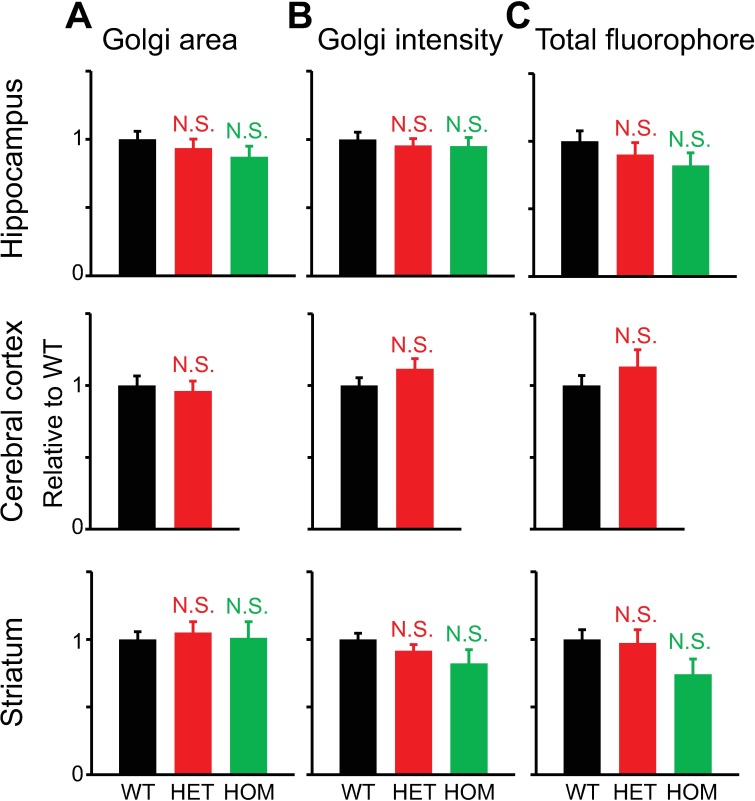
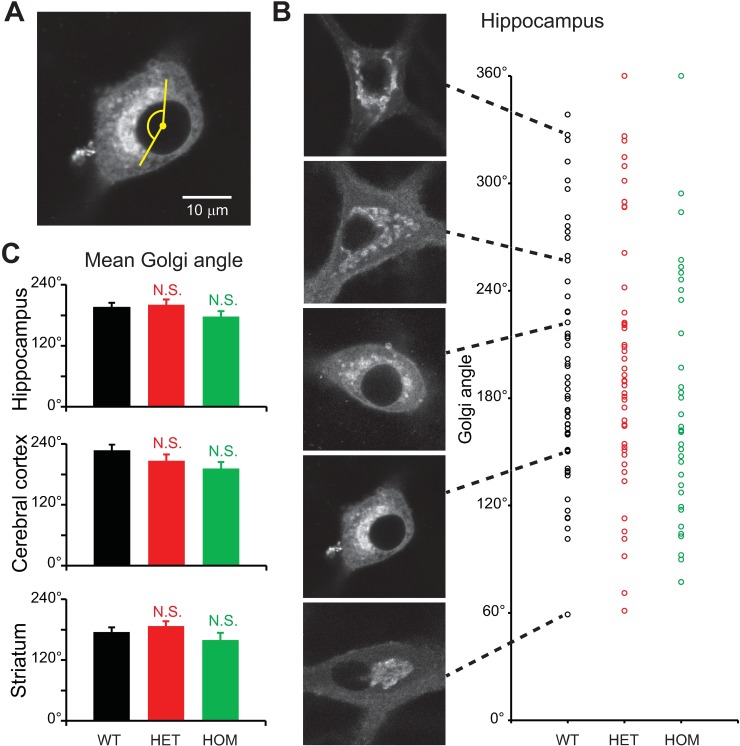
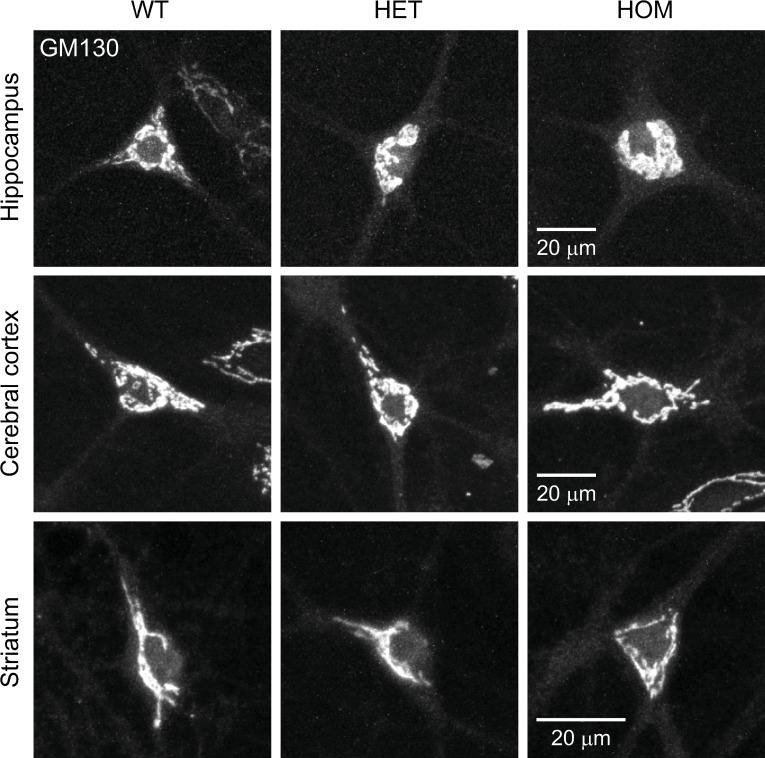
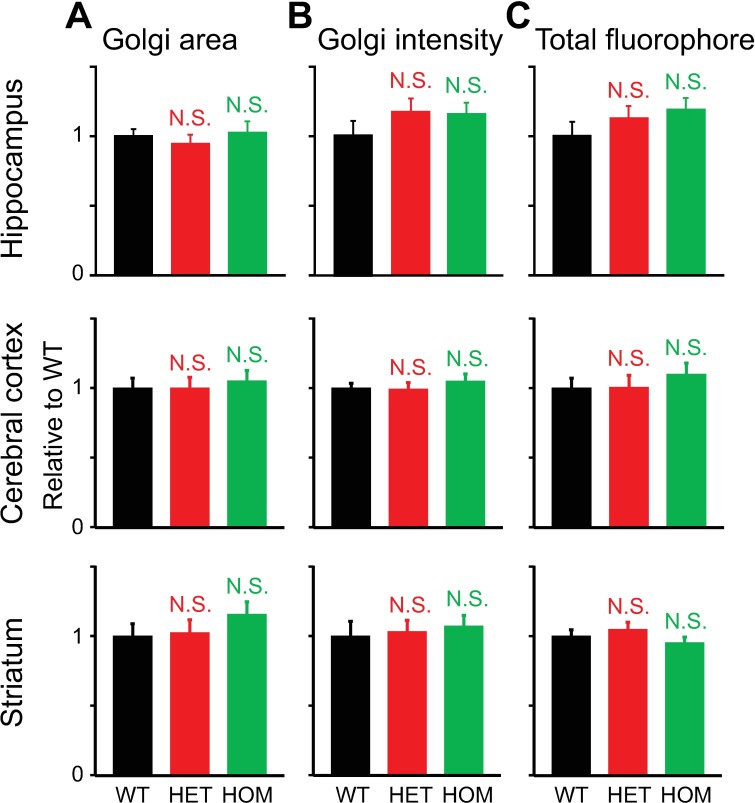
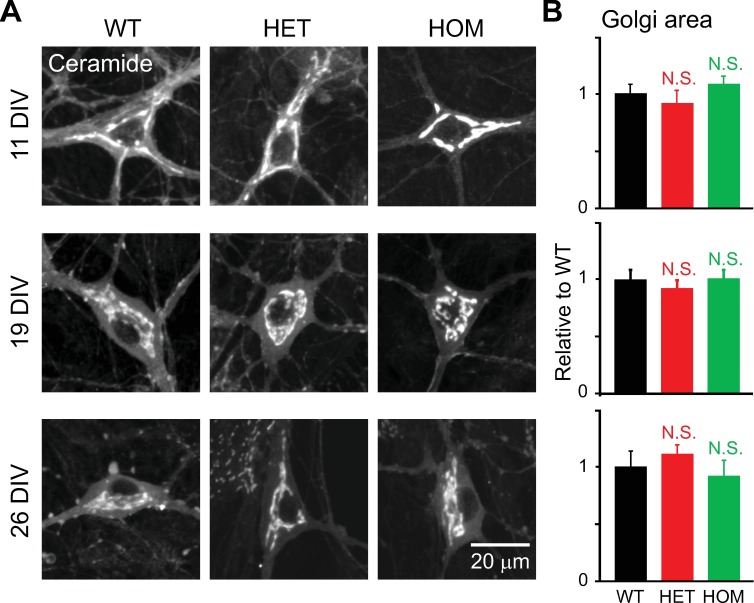
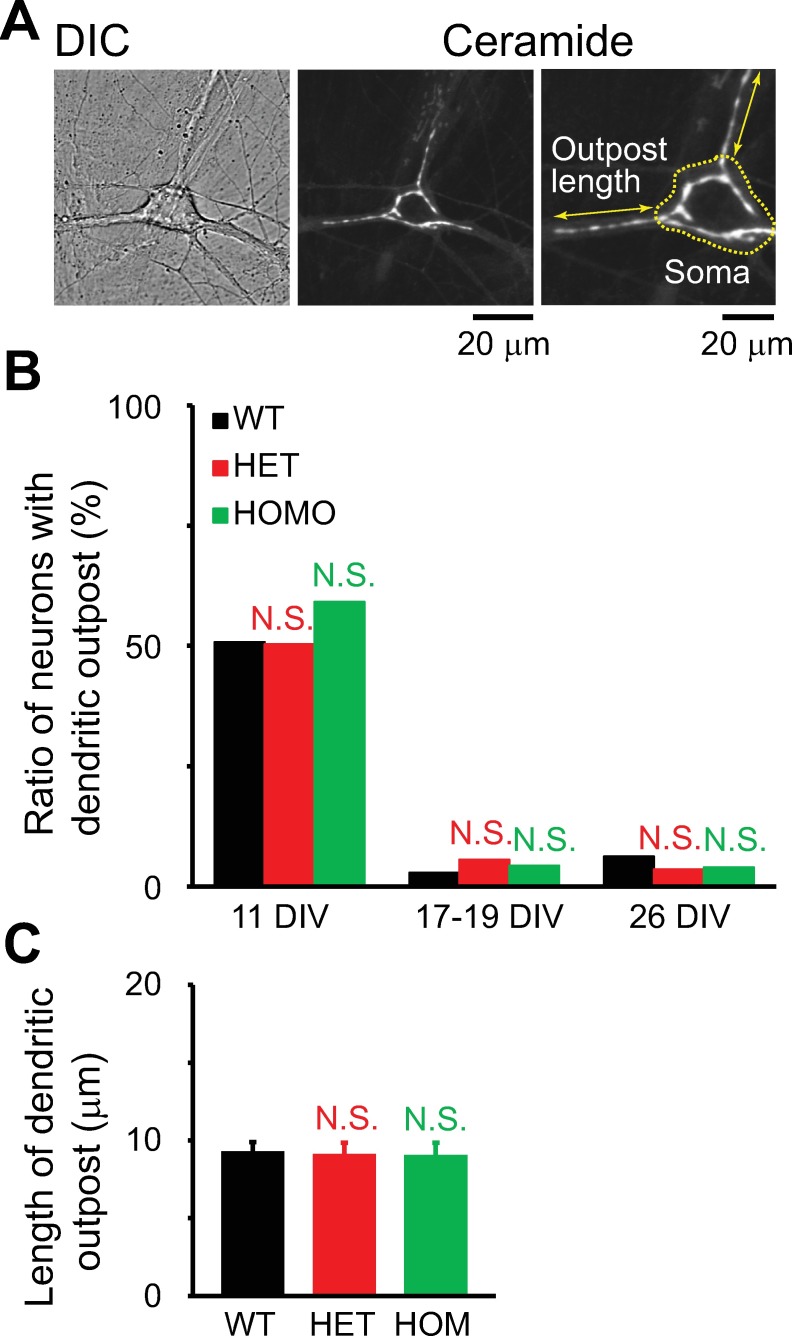
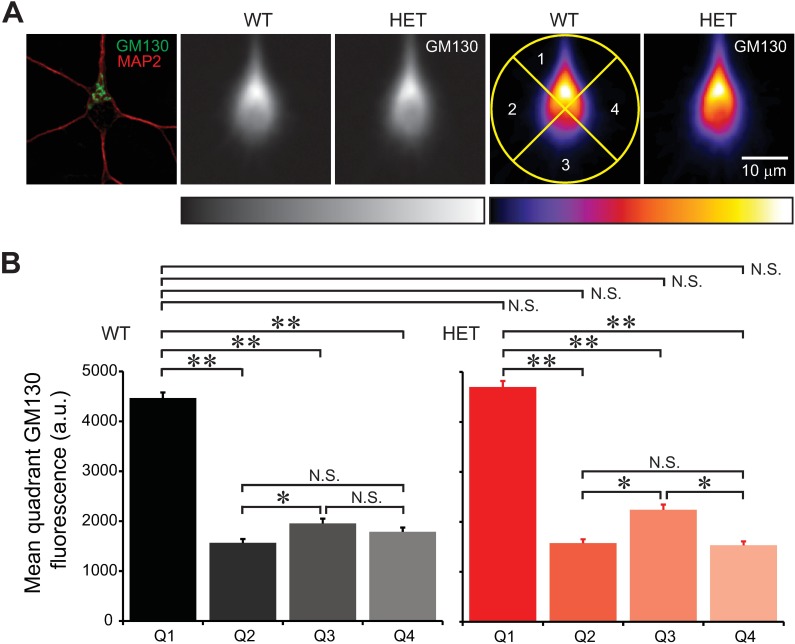
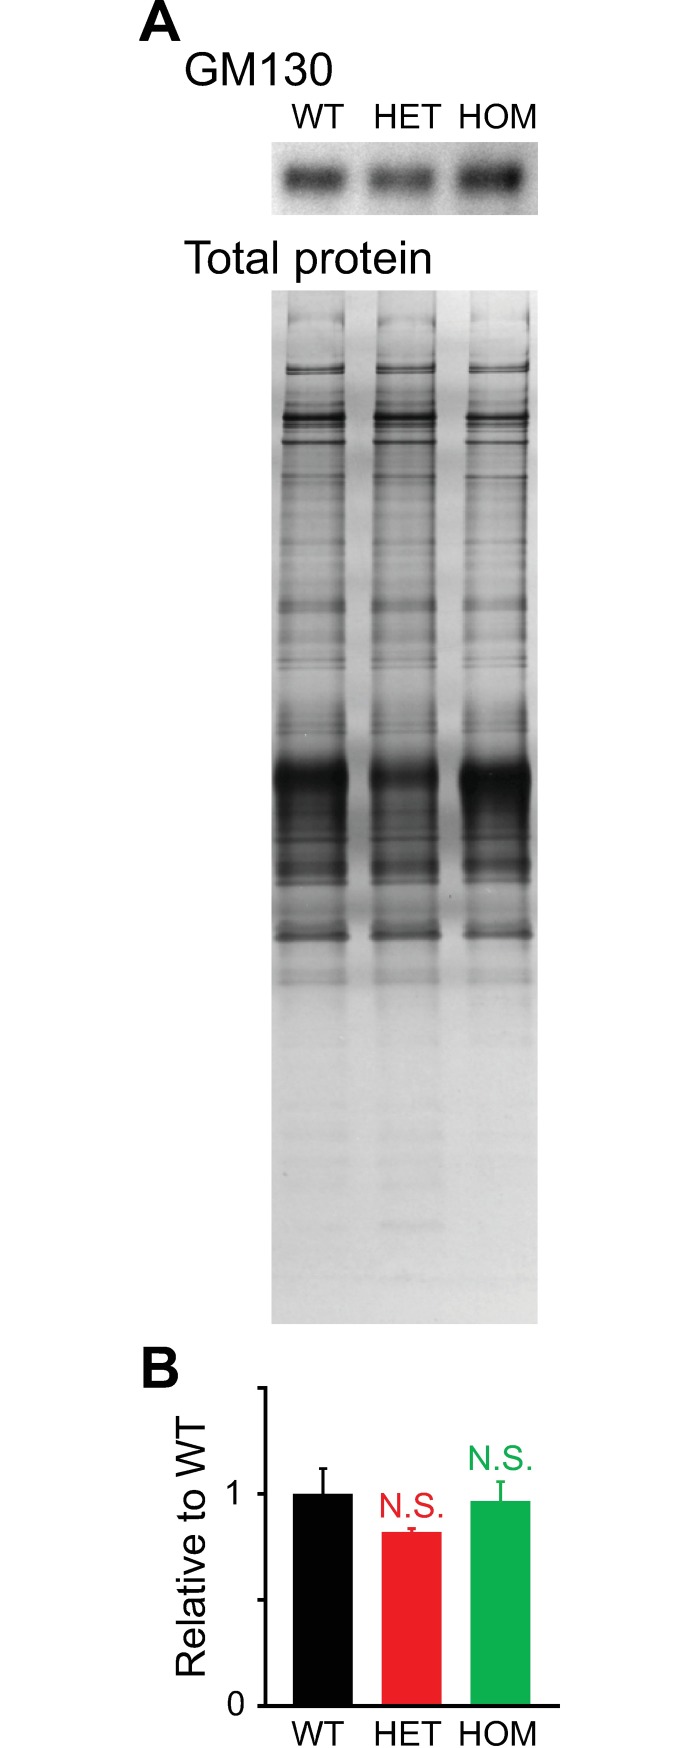
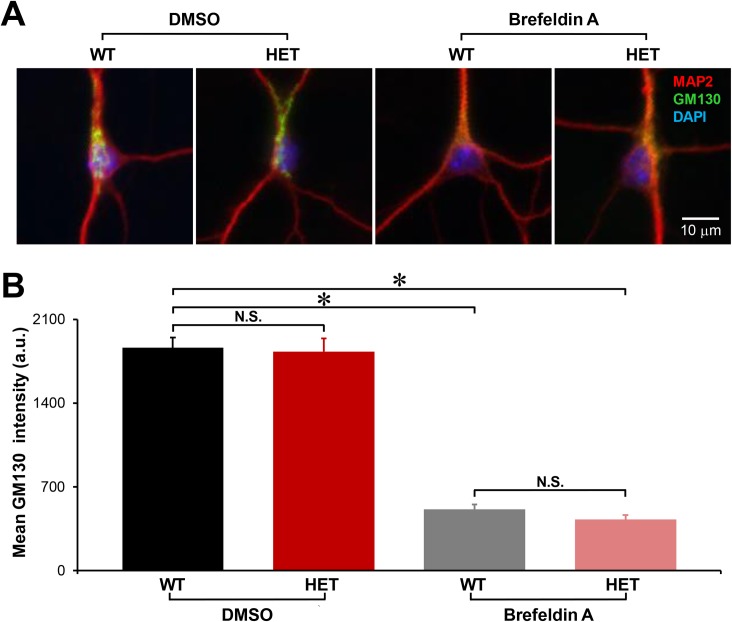
Autosomal-dominant, early-onset DYT1 dystonia is associated with an in-frame deletion of a glutamic acid codon (ΔE) in the TOR1A gene. The gene product, torsinA, is an evolutionarily conserved AAA+ ATPase. The fact that constitutive secretion from patient fibroblasts is suppressed indicates that the ΔE-torsinA protein influences the cellular secretory machinery. However, which component is affected remains unclear. Prompted by recent reports that abnormal protein trafficking through the Golgi apparatus, the major protein-sorting center of the secretory pathway, is sometimes associated with a morphological change in the Golgi, we evaluated the influence of ΔE-torsinA on this organelle. Specifically, we examined its structure by confocal microscopy, in cultures of striatal, cerebral cortical and hippocampal neurons obtained from wild-type, heterozygous and homozygous ΔE-torsinA knock-in mice. In live neurons, the Golgi was assessed following uptake of a fluorescent ceramide analog, and in fixed neurons it was analyzed by immuno-fluorescence staining for the Golgi-marker GM130. Neither staining method indicated genotype-specific differences in the size, staining intensity, shape or localization of the Golgi. Moreover, no genotype-specific difference was observed as the neurons matured in vitro. These results were supported by a lack of genotype-specific differences in GM130 expression levels, as assessed by Western blotting. The Golgi was also disrupted by treatment with brefeldin A, but no genotype-specific differences were found in the immuno-fluorescence staining intensity of GM130. Overall, our results demonstrate that the ΔE-torsinA protein does not drastically influence Golgi morphology in neurons, irrespective of genotype, brain region (among those tested), or maturation stage in culture. While it remains possible that functional changes in the Golgi exist, our findings imply that any such changes are not severe enough to influence its morphology to a degree detectable by light microscopy.


Conflict of interest statement

The authors have declared that no competing interests exist.

Figures

Fig 1
Fig 1. Live-cell staining of the Golgi apparatus by uptake of a fluorescent ceramide analogue.
Imaging was carried out in hippocampal cultures at 15–19 days in vitro (DIV). A: Differential interference contrast (DIC) and widefield fluorescence microscopy images of a cultured neuron. It was obtained from a wild-type (WT) mouse and stained with BODIPY FL C5-ceramide (Ceramide). The dye was excited by blue light, and the emitted light was observed using the red long-pass (590-nm LP), green band-pass (535/50-nm BP), and green long-pass (520-nm LP) emission filters. Imaging with the red emission filter produced the strongest contrast between Golgi (specific) and ER (non-specific) staining (arrow). The image contrast was adjusted, such that the maximal and minimal intensities in each image were the same. B: DIC and widefield fluorescence microscopy images of BODIPY FL C5-ceramide-stained WT neuron. The nucleus was stained with Hoechst dye. Ceramide signal was visualized using the red emission filter. C: Confocal fluorescence microscopy image of BODIPY FL C5-ceramide-stained neurons obtained from WT, heterozygous (HET) and homozygous (HOM) ΔE-torsinA knock-in mice. Fluorescence imaging was carried out using the red filter.
Fig 2
Fig 2. Setting the intensity threshold for quantitative analysis of the ceramide-stained Golgi apparatus.
A single image was obtained as part of a z-stack of images by confocal fluorescence microscopy, from a cultured WT hippocampal neuron at 17 DIV. A: Method for setting the intensity threshold. An image of a single neuron is shown without (left, Raw) and with (middle, Raw+ROIs) manually assigned regions of interest (ROIs). The ROIs were selected within areas representing cytoplasmic background (Negative), as well as within areas with positive staining (Positive). Histogram (right) shows the distribution of the pixel intensity of the negative, background (black) and positive (gray) staining. The arrow points to the maximal pixel intensity of the background, which was used as the threshold value. In each distribution, the Y-axes of the histograms are normalized to the peak incidence. The inset magnifies the boxed part of the main histogram. B: Effects of different threshold values on the area covered by pixels whose intensities are above the threshold. Each panel represents the same image but thresholded at the value indicated. The images are shown in binary format to more clearly illustrate the changes in area (Thresholded). C: Dependence of the measured Golgi area on the threshold values for the same image (left). A magnified section of the graph is also shown (right). D: Plot similar to that in panel C, but showing the dependence of average pixel intensity on threshold values. In B-D, the images and curves represent the data when the threshold was forced to take the indicated values. In C,D, vertical and horizontal gray zones show the standard deviations (SDs) of the thresholds, and the corresponding areas and average pixel intensities, when the threshold value was measured repeatedly using the method illustrated in panel A (maximal intensity of background).
Fig 3
Fig 3. Selecting images in a z-stack for quantitative analysis of the ceramide-stained Golgi apparatus.
All images were obtained by confocal microscopy. A: Multiple images in a z-stack of the neuron imaged in Fig 2. Arrowhead indicates the level of maximal glial signal. Arrows indicate the optimal levels of neuronal signal. Individual images in a z-stack were acquired at 0.44-μm intervals; distance between the panels is 0.44 × 2 = 0.88 μm. B: Magnified views of images #13–15 in A. The measured Golgi areas and intensities are indicated. C: Measured intensity threshold, Golgi area and average pixel intensity of the images shown in panel A. These values depend on the distance from bottom of glial layer. Small black dots indicate the values measured when the intensity threshold was determined for each image. Large black dots indicate the values for images #13–15, which were ultimately used to report Golgi parameters. For comparison, the gray dots indicate the values measured when the intensity threshold was fixed at 63, the value determined for image #14.
Fig 4
Fig 4. Structure of the Golgi apparatus in hippocampal neurons of ΔE-torsinA knock-in mice, as analyzed using the 3-image average method.
Confocal fluorescence microscopy of cultured neurons at 17–19 DIV. A: Representative confocal image of a WT neuron stained with BODIPY FL C5-ceramide (left). Thresholded image is shown in binary format (middle). The ROI used to measure the somatic area is overlaid on the image (right). B: Representative confocal images of neurons of the WT, HET and HOM genotypes. An optical section is shown (Single), as a comparison for an image averaged from 3 sections used for analyses. C: Quantitative analysis of measured parameters. Total fluorophore (BODIPY FL C5-ceramide) was calculated as (area) × (averaged intensity / pixel). Columns represent the means and the bars represent standard errors of the mean (SEM). There was no statistical significance (NS) in the values measured for mutants vs. WT (p>0.1; t-test; n = 20, 26, 18 neurons for WT, HET and HOM, respectively).
Fig 5
Fig 5. Structure of the Golgi apparatus in the hippocampal neurons of ΔE-torsinA knock-in mice, as analyzed using the maximum intensity projection (MIP) method.
Confocal fluorescence microscopy of cultured neurons at 17–19 DIV. A: Representative images of the WT, HET and HOM neurons shown in Fig 4B, stained with BODIPY FL C5-ceramide and but shown after MIP. B: Quantitative analysis of indicated parameters. Columns represent the mean and the bars represent the SEM. Differences in values measured for mutant vs. WT neurons were not statistically significant (p>0.1; t-test; n = 20, 26, 18 neurons for WT, HET and HOM, respectively). C: Positive correlation between results obtained using the 3-image averaging and MIP methods (p<0.01; t-test for Pearson correlation coefficient; same number of neurons as in panel B).
Fig 6
Fig 6. Structure of the Golgi apparatus in neurons from the cerebral cortex and striatum of WT and ΔE-torsinA knock-in mice.
Confocal microscopy of WT and HET neurons stained with BODIPY FL C5-ceramide, at 17–19 DIV. Single and MIP images are shown.
Fig 7
Fig 7. Quantitative analysis of the Golgi structure in ceramide-stained neurons from the hippocampus, cerebral cortex and striatum, as analyzed by the MIP method.
Confocal microscopy was carried out at 17–21 DIV. A: Golgi area. B: Averaged pixel intensity in the Golgi. C: Total amount of fluorophore. All measured values were normalized to average values of WT neurons. Differences in values measured for mutant vs. WT neurons were not statistically significant (p>0.1; t-test; n = 31, 40, 20 hippocampal neurons, 47, 40 cerebral cortical neurons, and 40, 45, 30 striatal neurons for WT, HET and HOM, respectively).
Fig 8
Fig 8. Degree to which the Golgi apparatus encircled nuclei.
Confocal microscopy of neurons stained with BODIPY FL C5-ceramide, carried out at 17–19 DIV. A: Representative confocal image of a WT hippocampal neuron. The extent to which the Golgi apparatus encircled the nucleus was measured as the angle subtended by the Golgi, with the center of the nucleus defined as the vertex. B: Variability of angle subtended by the Golgi in hippocampal neurons. Each circle represents a single neuron. C: Differences in values measured for mutant vs. WT neurons were not significantly different (p>0.1; t-test; n = 54, 49, 37 hippocampal neurons, 49, 40, 25 cerebral cortical neurons, and 53, 58, 29 striatal neurons for WT, HET and HOM, respectively).
Fig 9
Fig 9. Structure of the Golgi apparatus, as visualized by GM130 immunocytochemistry.
Representative confocal images of cultured hippocampal, cerebral cortical and striatal neurons, obtained from WT, HET and HOM mice. MIP images are shown, and were acquired at 17–19 DIV.
Fig 10
Fig 10. Quantitative analysis of Golgi structure as visualized by GM130 immunocytochemistry.
The stained structure was analyzed using the MIP images. Confocal microscopy was carried out at 15–21 DIV. A: Golgi area. B: Intensity / pixel in the Golgi. C. Total fluorophore in the Golgi. All measured values were normalized to the average value for WT neurons. Differences in values measured for parameters in mutant vs. WT neurons were not statistically significant (p>0.1; t-test; n = 12, 18, 13 hippocampal neurons, 20, 19, 20 cerebral cortical neurons, and 19, 18, 19 striatal neurons for WT, HET and HOM, respectively).
Fig 11
Fig 11. Structure of the Golgi apparatus during the course of culture.
Hippocampal neurons of ΔE-torsinA knock-in mice were stained with BODIPY FL C5-ceramide, and imaged by confocal microscopy at the specified DIV. A: Representative confocal images of neurons obtained from WT, HET and HOM ΔE-torsinA knock-in mice, at 11, 19 or 26 DIV. MIP images are shown. B: Differences in Golgi area between mutant and WT neurons, as analyzed by the MIP method, were not statistically significant during maturation (p>0.1; t-test; n = 26, 14, 18 11-DIV neurons, 30, 44, 32 19-DIV neurons, and 11, 17, 18 26-DIV neurons for WT, HET and HOM, respectively). All values measured were normalized to the average WT value.
Fig 12
Fig 12. Dendritic Golgi outposts in young cultures.
A: DIC and confocal images of a cultured, BODIPY FL C5-ceramide-stained hippocampal neuron at 11 DIV. Double-ended arrow indicates the length of longest outpost in this neuron. B: Ratios of neurons with outposts to total number of neurons. The ratios between mutant and WT neurons were not statistically significant (p>0.1; chi-squared test; total number of neurons = n = 191, 143, 98 11-DIV neurons, 35, 54, 46 17-to-19-DIV neurons, and 16, 28, 25 26-DIV neurons for WT, HET and HOM, respectively). C. Lengths of dendritic outposts. Differences in lengths of dendritic outposts between mutant and WT neurons were not statistically significant (p>0.1; t-test; n = 97, 72, 58 neurons for WT, HET and HOM, respectively). In B and C, the data obtained with ceramide staining and immunocytochemistry for GM130 were merged.
Fig 13
Fig 13. Degree of Golgi polarization at the base of thickest dendrite.
Hippocampal neurons were stained for GM130 at 11 DIV, centered, and oriented such that the thickest dendrite pointed toward 12 o'clock, and averaged. The polarity of the Golgi was analyzed as the distribution of GM130 intensity in the top quadrant (90° pie) relative to the other quadrants. A: The leftmost panel shows the image of a single neuron, stained by immunocytochemistry for GM130 and a dendritic marker MAP2 (single confocal plane). Two grayscale images show averaged GM130 signals in neurons from WT and HET neurons (slide scanner images). Two images on the right show the same GM130 signals shown in pseudocolor. The center of each panel corresponds to the somatic center. Four quadrants are illustrated with a yellow circle in one panel. The scale bar applies to all panels. Rectangles below the images show the corresponding color lookup tables. B: Relative distributions of the Golgi in the four quadrants. Golgi was polarized in the top quadrant (Quadrant 1, Q1) in WT and HET neurons (**: p<1.01 × 10−46; *: p<1.77 × 10⁻³). However, differences in polarization between mutant and WT neurons were not statistically significant (N.S.; p>2.61 × 10⁻² with α = 1.78 × 10⁻³ after Bonferroni correction; t-test; n = 410 and 407 neurons for WT and HET, respectively).
Fig 14
Fig 14. Expression of the Golgi protein GM130 in cultured cells as assessed by Western blotting.
Cultured hippocampal cells were processed for Western blotting at 17 DIV. A: GM130 immunoblot, with total protein used as a loading control. B: Bar graph of GM130 levels following normalization to the average WT value. Differences in expression between mutant vs. WT cultures were not statistically significant (p>0.1; t-test; n = 3 per genotype).
Fig 15
Fig 15. Degree of Golgi apparatus disruption by brefeldin A.
Cultured hippocampal neurons at 11 DIV, following treatment with 1 μg/ml brefeldin A or DMSO for 2 hours at 37°C and immunocytochemical staining for GM130, MAP2 and DAPI. A: Representative slide scanner images of neurons. The images are shown in an 8-bit intensity format. The same image contrast was used in each color channel (representing GM130, MAP2 or DAPI) throughout the 4 images, such that the minimum of 4 minima and the maximum of 4 maxima were 0 and 255 on an 8-bit intensity scale. The mean intensity values of GM130 in the 4 images were (from left to right): 745, 730, 261 and 281. B: Quantitation of GM130 staining intensity. There was no genotypic difference in the GM130 staining intensities when the neurons were treated with vehicle (N.S.; p = 0.822). In both genotypes, treatment with brefeldin A reduced the GM130 staining intensity in comparison to treatment with vehicle (WT, *: p = 3.04 × 10⁻³²; HET, *: p = 3.52 × 10⁻¹⁸). However, there was no genotypic difference in the GM130 staining intensities after treatment with brefeldin A (N.S.; p = 0.139) (n = 139 WT and 62 HET neurons treated with DMSO only, and 85 WT and 70 HET neurons treated with brefeldin A).

Similar articles

Cited by

References

    1. Horton AC, Ehlers MD. Neuronal polarity and trafficking. Neuron. 2003;40(2):277–95. . - PubMed
    1. Klumperman J. Architecture of the mammalian Golgi. Cold Spring Harb Perspect Biol. 2011;3(7). 10.1101/cshperspect.a005181 ; PubMed Central PMCID: PMCPMC3119909. - DOI - PMC - PubMed
    1. Bankaitis VA, Garcia-Mata R, Mousley CJ. Golgi membrane dynamics and lipid metabolism. Curr Biol. 2012;22(10):R414–24. 10.1016/j.cub.2012.03.004 ; PubMed Central PMCID: PMCPMC4059015. - DOI - PMC - PubMed
    1. Brandizzi F, Barlowe C. Organization of the ER-Golgi interface for membrane traffic control. Nat Rev Mol Cell Biol. 2013;14(6):382–92. 10.1038/nrm3588 ; PubMed Central PMCID: PMCPMC4064004. - DOI - PMC - PubMed
    1. Efimov A, Kharitonov A, Efimova N, Loncarek J, Miller PM, Andreyeva N, et al. Asymmetric CLASP-dependent nucleation of noncentrosomal microtubules at the trans-Golgi network. Dev Cell. 2007;12(6):917–30. 10.1016/j.devcel.2007.04.002 ; PubMed Central PMCID: PMCPMC2705290. - DOI - PMC - PubMed

Publication types

MeSH terms