. 2018 Nov 7;13(11):e0205967.
doi: 10.1371/journal.pone.0205967. eCollection 2018.

Single unit activities recorded in the thalamus and the overlying parietal cortex of subjects affected by disorders of consciousness

Affiliations

Single unit activities recorded in the thalamus and the overlying parietal cortex of subjects affected by disorders of consciousness

Lorenzo Magrassi et al. PLoS One. .

Abstract

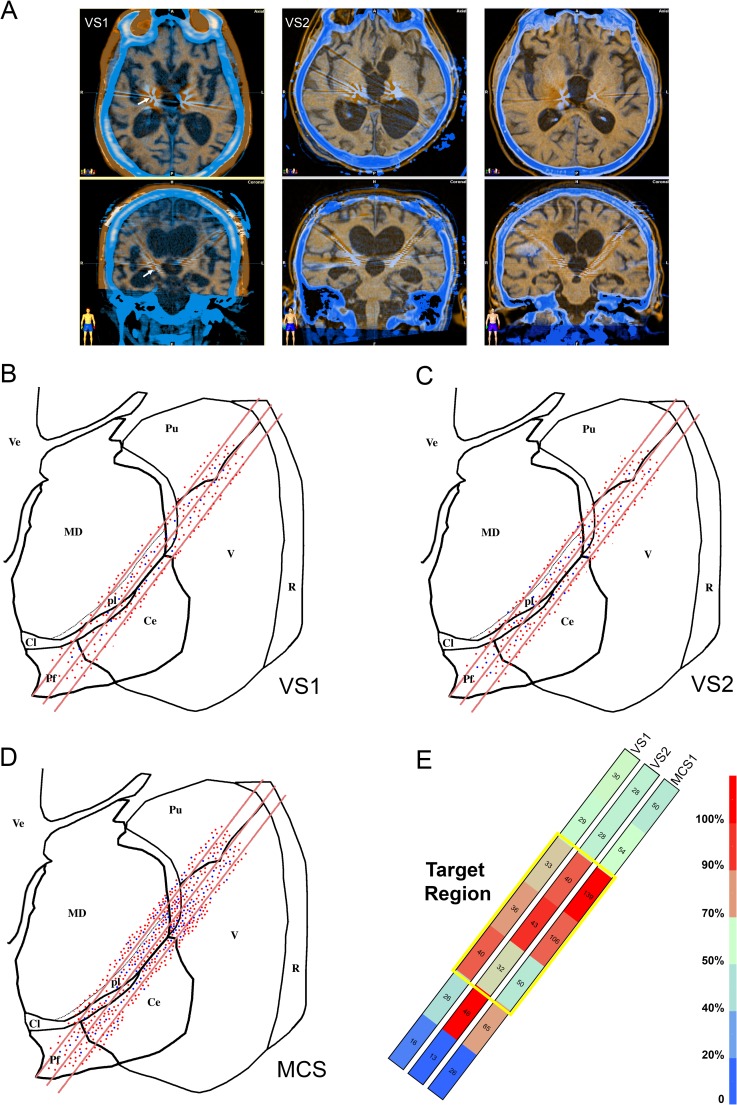
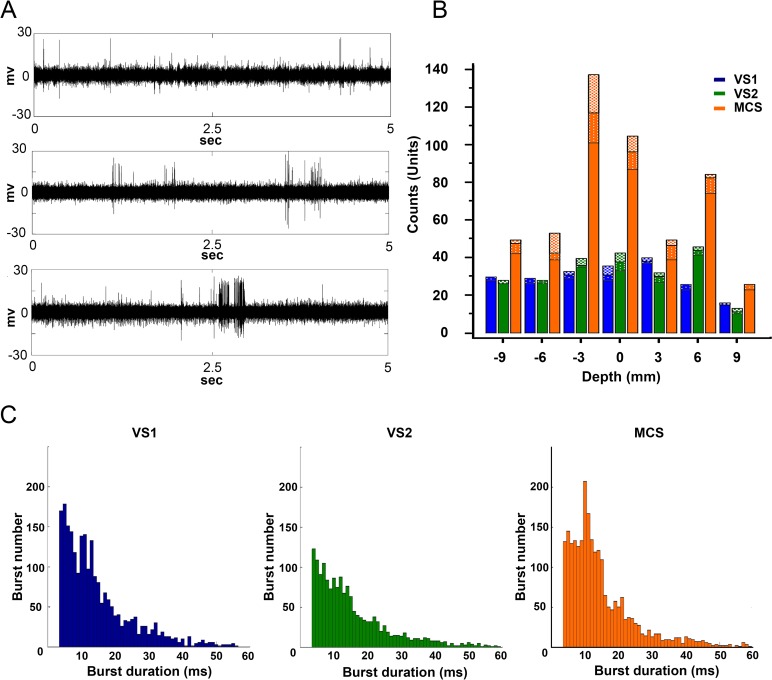
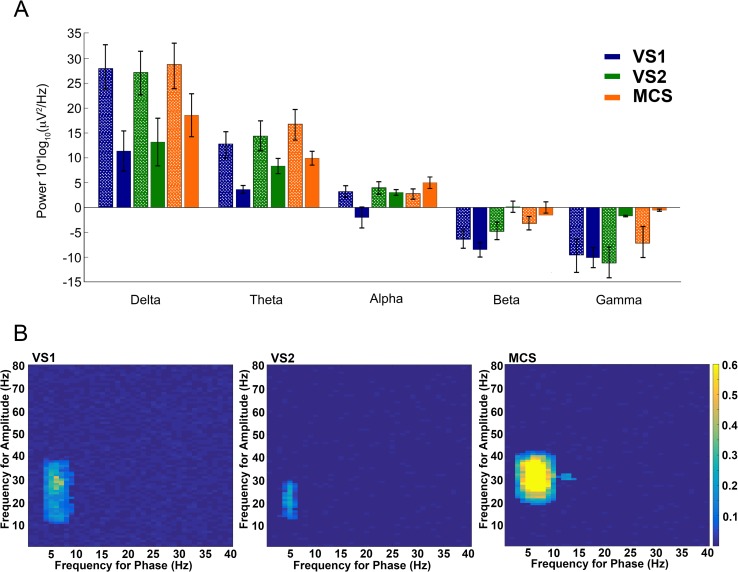
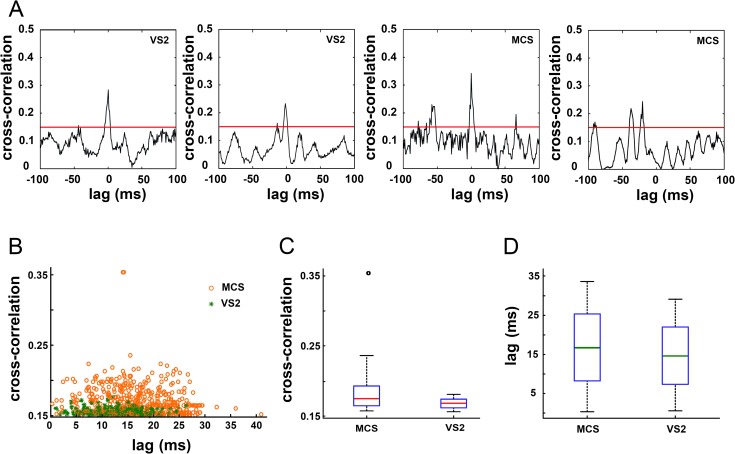
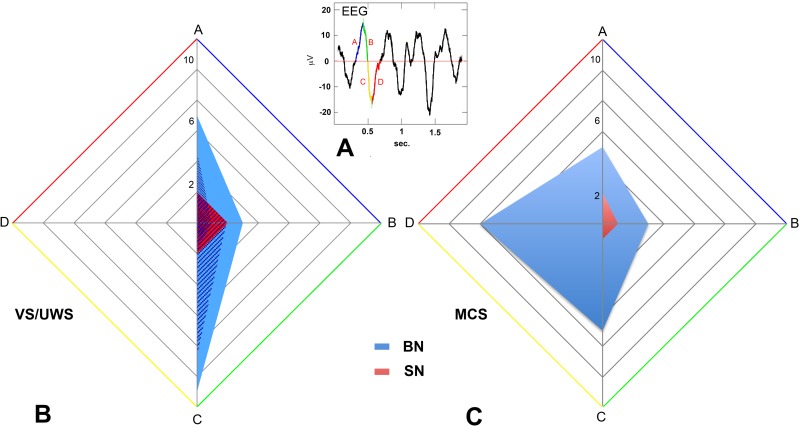
The lack of direct neurophysiological recordings from the thalamus and the cortex hampers our understanding of vegetative state/unresponsive wakefulness syndrome and minimally conscious state in humans. We obtained microelectrode recordings from the thalami and the homolateral parietal cortex of two vegetative state/unresponsive wakefulness syndrome and one minimally conscious state patients during surgery for implantation of electrodes in both thalami for chronic deep brain stimulation. We found that activity of the thalamo-cortical networks differed among the two conditions. There were half the number of active neurons in the thalami of patients in vegetative state/unresponsive wakefulness syndrome than in minimally conscious state. Coupling of thalamic neuron discharge with EEG phases also differed in the two conditions and thalamo-cortical cross-frequency coupling was limited to the minimally conscious state patient. When consciousness is physiologically or pharmacologically reversibly suspended there is a significant increase in bursting activity of the thalamic neurons. By contrast, in the thalami of our patients in both conditions fewer than 17% of the recorded neurons showed bursting activity. This indicates that these conditions differ from physiological suspension of consciousness and that increased thalamic inhibition is not prominent. Our findings, albeit obtained in a limited number of patients, unveil the neurophysiology of these conditions at single unit resolution and might be relevant for inspiring novel therapeutic options.


Conflict of interest statement

The authors have declared that no competing interests exist.

Figures

Fig 1
Fig 1. Microelectrode recordings from the thalamus of patients affected by DOC.
(a) Early postoperative TC fused to MRI T1 weighted images showing the position of the definitive electrodes for thalamic stimulation in all patients (E: electrode). The stimulating electrodes were implanted following the trajectory of one of the recording microelectrodes thus their position marks the intra-thalamic region of the microelectrode recordings. In the upper row we show the axial images corresponding to the patients, in the lower row the coronal ones. The withe arrows in VS1 indicate the position of the electrode in the thalamus. (b-d) Topographic distribution of the 950 thalamic units recorded in the 2 VS/UWS patients (b: VS1, c: VS2) and in the MCS patient (d: MCS) shown on coronal view of the left thalamus at the level of the microelectrode trajectories. Only the last 20 mm of the trajectories of the 3 microelectrodes contained in the plane of the section are outlined (red segments). All recorded units are indicated at their position. Units recorded by the electrodes contained in planes parallel to that outlined in the figure were projected to the represented plane and all units recorded in the right thalamus were also projected to the corresponding position of the left one. Red dots: SN, blue dots: BN. Pf: parafascicular nucleus, MD: mediodorsal nucleus, pl: Paralaminar part of mediodorsal nucleus, Cl: central lateral nucleus, Ce centromedian nucleus, V: ventral nuclear group, Pu: Pulvinar, R: reticular nucleus. (e) Heatmap of the distribution of the recorded units in the three patients. The represented recordings were obtained every 1mm in 21 steps starting from 0 located dorsally and lateral in the thalamus to 20, ventral and more medial close to the third ventricle. Recordings were grouped in 7 bins containing the cells collected by multiple electrodes bilaterally in 3 recordings step each. The color of each bin represent the percentage of total neurons recorded present in each bin, the numbers of neurons are written inside each bin. The yellow rectangle outlines the 2D projection of the 3D region where, anatomically, the microelectrodes had the maximal chance of recording from the nuclei representing the intended the target for stimulation. A color scale is provided with the indication of percentages corresponding to each color.
Fig 2
Fig 2. Characterization of the single unit activities recorded in the thalami.
(a) Examples of activities recorded in the thalamus of the patients affected by DOC before sorting. The duration of all traces is 5 sec. The upper trace from VS1, shows mainly SN discharging randomly. The middle trace from VS2, shows randomly BN, with burst duration less than 15 ms. The lower trace from MCS, shows randomly BN, with two bursts lasting longer than 150 ms (MCS). (b) Histograms showing the distribution of burst durations in each patient. Two-way anova test showed that bursts durations were different at each depth (F = 2.85, P = 0.0165). Burst durations were significantly different when we compared MCS and VS1 (Wilcoxon ranksum test with Bonferroni correction: ranksum = 68; P = 0.0018) and MCS and VS2 (Wilcoxon ranksum test with Bonferroni correction: ranksum = 85, P< 0.0001), this was true independently from the depth of the recording. (c) Histogram showing the distribution of the single units recorded at different depths in the thalami of the 3 patients VS1 (blue), VS2 (green) and MCS (red). The distribution of the recorded units was significantly different in MCS, VS1 and VS2 (χ2 = 38.148; DF:12; P < 0.001). Units were classified according to their prevalent activity into SN and BN, and BN units were further subdivided into units with burst lasting for <14 ms (squared texture) or >13 ms (stippled texture). Differences in the distribution of the 3 class of units according to the level explored was significant only in MCS (χ2 = 25.395; DF:12; P < 0.013) while in VS1 and VS2 units were uniformly distributed at all levels.
Fig 3
Fig 3. Characterization of thalamo-cortical coupling.
(a) Bar graph displaying the power spectral analysis of the LFP (stippled texture) recorded from the thalami of VS1 (blue), VS2 (green) and MCS (red) and the corresponding power spectrum obtained from the EEG (no texture) simultaneously recorded in the same patients. All recordings were obtained with the patient resting quietly under normal ambient lighting without active auditory or tactile stimulations exept for background pressure from the bed and bedclothes. As expected delta and theta activity prevails both in the thalamus and the cortex, with the larger power in the thalamic spectra mainly resulting from the attenuation of the cortical activity in the EEG due to the extracranial position of the recording electrodes. Columns correspond to the average power from multiple recordings, error bars: standard error. (b) Comodulograms showing modulation strength as a function of frequency for amplitude and frequency for phase between thalami and cortex of VS1, VS2 and MCS. We obtained all the analyzed recordings with the patients in an apparent resting condition without environmental or background sensory stimulation. Only in MCS was there significant modulation (phase: H = 21.342, P < 0.0001; amplitude: H = 17.920, P < 0.001; Kruskal-Wallis and Dunn tests as post-hoc) of the cortical low gamma activity power by thalamic theta-alpha coupling indicating CFC between thalamus and cortex.
Fig 4
Fig 4. Characterization of thalamo-cortical coupling.
(a) Four examples of typical cross correlograms thalamo-cortical pairs recorded in VS2 (first and second cross-correlograms) and MCS1 (third and fourth cross-correlograms). The short lag (< 3 msec) of the peek correlation shown in the first three correlograms suggests the persistence of functional monosynaptic cortico-thalamic connections. The red line at 0.15 indicates the threshold level for cross-correlation significance. This value was obtained after extensive resampling and shuffling of the recordings as described in the methods. (b) Diagram showing the maximal cross-correlations between the activities of single units in the thalamus and the homolateral parietal cortex and the absolute lag corresponding to the cross correlation. Background correlation threshold was 0.15. Each circle represent the cross correlation between one thalamic unit and the cortical unit maximizing the cross-correlation. Orange circles: MCS and green asterisks: VS2. (c) Distribution of the cross-correlation amplitudes: red line, median; blue box, interquartile range; whiskers, range from 1–99 percentiles. (d) Distribution of the absolute lags: green line, median. No significant difference is visible between MCS and VS2.
Fig 5
Fig 5
(a-c) Single thalamic units discharging in phase with the EEG. (a) Superimposed on a wave of the EEG trace are indicated the 4 phase bins: A (blue), B (green), C (yellow), and D (red), used to classify thalamic units firing in phase with the EEG. A and B correspond to the up deflection while C and D correspond to the down deflection of the EEG wave. (b-c) Radar plots of the number of units firing synchronously with the four phases of the EEG wave shown in a. In b are represented both the total number of the spiking (red) and bursting (blue) units recorded in VS/UWS patients and the contributions of the single patients: circles represent the units firing synchronously with the EEG recorded in VS1, while the squares indicate the units recorded in VS2. Overall, BN (BN firing in phase n. 44, 27.3%, BN total n. 161) were more likely (χ2 = 169.229; DF:1; P < 0.0001) firing in phase with the EEG than SN (SN firing in phase n. 10, 1.3%, SN total n. 789). This was true in both VS/UWS and MCS patients. In VS/UWS patients (b) we found no unit firing synchronously with phase D of the EEG while in the MCS patient (c) we detected 8 BN in D. The difference in the distribution of units firing synchronously to the different EEG phases among VS/UWS and MCS patients is statistically significant (χ2 = 14.452; DF:6; P < 0.025).

Similar articles

Cited by

References

    1. Laureys S, Celesia GG, Cohadon F, Lavrijsen J, León-Carrión J, Sannita WG, et al.; European Task Force on Disorders of Consciousness. Unresponsive wakefulness syndrome: a new name for the vegetative state or apallic syndrome. BMC Med. 2010;8: 68 10.1186/1741-7015-8-68 - DOI - PMC - PubMed
    1. Giacino JT, Ashwal S, Childs N, Cranford R, Jennett B, Katz DI, et al. The minimally conscious state: definition and diagnostic criteria. Neurology. 2002;58: 349–353. - PubMed
    1. Di Perri C, Bahri MA, Amico E, Thibaut A, Heine L, Antonopoulos G, et al. Neural correlates of consciousness in patients who have emerged from a minimally conscious state: a cross-sectional multimodal imaging study. Lancet Neurol. 2016;15: 830–842. 10.1016/S1474-4422(16)00111-3 - DOI - PubMed
    1. Fox MD, Snyder AZ, Vincent JL, Corbetta M, Van Essen DC, Raichle ME. The human brain is intrinsically organized into dynamic, anticorrelated functional networks. Proc Natl Acad Sci U S A. 2005;102: 9673–9678. 10.1073/pnas.0504136102 - DOI - PMC - PubMed
    1. Lutkenhoff ES, Chiang J, Tshibanda L, Kamau E, Kirsch M, Pickard JD, et al. Thalamic and extrathalamic mechanisms of consciousness after severe brain injury. Ann Neurol. 2015;78: 68–76. 10.1002/ana.24423 - DOI - PubMed

Publication types

MeSH terms