

ANCO-GeneDB: annotations and comprehensive analysis of candidate genes for alcohol, nicotine, cocaine and opioid dependence
- PMID: 30403795
- PMCID: PMC6310508
- DOI: 10.1093/database/bay121
ANCO-GeneDB: annotations and comprehensive analysis of candidate genes for alcohol, nicotine, cocaine and opioid dependence
Abstract
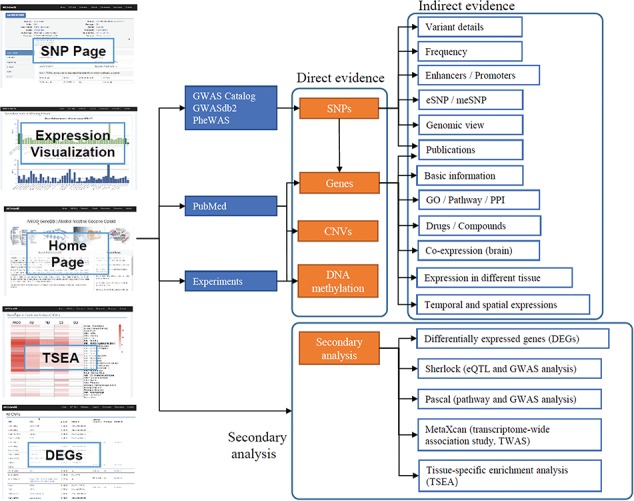
Studies have shown that genetic factors play an important role in the risk to substance addiction and abuse. So far, various genetic and genomic studies have reported the related evidence. These rich, but highly heterogeneous, data provide us an unprecedented opportunity to systematically collect, curate and assess the genetic and genomic signals from published studies and to perform a comprehensive analysis of their features, functional roles and druggability. Such genetic data resources have been made available for other disease or phenotypes but not for major substance dependence yet. Here, we report comprehensive data collection and secondary analyses of four phenotypes of dependence: alcohol dependence, nicotine dependence, cocaine dependence and opioid dependence, collectively named as Alcohol, Nicotine, Cocaine and Opioid (ANCO) dependence. We built the ANCO-GeneDB, an ANCO-dependence-associated gene resource database. ANCO-GeneDB includes resources from genome-wide association studies and candidate gene-based studies, transcriptomic studies, methylation studies, literature mining and drug-target data, as well as the derived data such as spatial-temporal gene expression, promoters, enhancers and expression quantitative trait loci. All associated genes and genetic variants are well annotated by using the collected evidence. Based on the collected data, we performed integrative, secondary analyses to prioritize genes, pathways, eQTLs and tissues that are significantly enriched in ANCO-related phenotypes.
Figures
Similar articles
-
Common and distinguishing genetic factors for substance use behavior and disorder: an integrated analysis of genomic and transcriptomic studies from both human and animal studies.Addiction. 2022 Sep;117(9):2515-2529. doi: 10.1111/add.15908. Epub 2022 May 10. Addiction. 2022. PMID: 35491750
-
Genetic variation in the CHRNA5 gene affects mRNA levels and is associated with risk for alcohol dependence.Mol Psychiatry. 2009 May;14(5):501-10. doi: 10.1038/mp.2008.42. Epub 2008 Apr 15. Mol Psychiatry. 2009. PMID: 18414406 Free PMC article.
-
Analyses of polymorphisms of intron 2 of OPRK1 (kappa-opioid receptor gene) in association with opioid and cocaine dependence diagnoses in an African-American population.Neurosci Lett. 2022 Jan 18;768:136364. doi: 10.1016/j.neulet.2021.136364. Epub 2021 Nov 26. Neurosci Lett. 2022. PMID: 34843875
-
Cocaine and amphetamine regulated transcript (CART) gene in the comorbidity of schizophrenia with alcohol use disorders and nicotine dependence.Prog Neuropsychopharmacol Biol Psychiatry. 2010 Aug 16;34(6):834-6. doi: 10.1016/j.pnpbp.2010.03.030. Epub 2010 Mar 30. Prog Neuropsychopharmacol Biol Psychiatry. 2010. PMID: 20362026
-
Common single nucleotide variants underlying drug addiction: more than a decade of research.Addict Biol. 2015 Sep;20(5):845-71. doi: 10.1111/adb.12204. Epub 2015 Jan 21. Addict Biol. 2015. PMID: 25603899 Review.
Cited by
-
Waterpipe and cigarette epigenome analysis reveals markers implicated in addiction and smoking type inference.Environ Int. 2023 Dec;182:108260. doi: 10.1016/j.envint.2023.108260. Epub 2023 Oct 18. Environ Int. 2023. PMID: 38006773 Free PMC article.
-
Transcriptomic Profiling and Microsatellite Identification in Cobia (Rachycentron canadum), Using High-Throughput RNA Sequencing.Mar Biotechnol (NY). 2022 Mar;24(1):255-262. doi: 10.1007/s10126-021-10081-0. Epub 2021 Dec 2. Mar Biotechnol (NY). 2022. PMID: 34855031
-
A Convergent Study of Genetic Variants Associated With Crohn's Disease: Evidence From GWAS, Gene Expression, Methylation, eQTL and TWAS.Front Genet. 2019 Apr 9;10:318. doi: 10.3389/fgene.2019.00318. eCollection 2019. Front Genet. 2019. PMID: 31024628 Free PMC article.
-
A single dose of cocaine rewires the 3D genome structure of midbrain dopamine neurons.bioRxiv [Preprint]. 2024 May 12:2024.05.10.593308. doi: 10.1101/2024.05.10.593308. bioRxiv. 2024. PMID: 38766140 Free PMC article. Preprint.
-
The phenomics and genetics of addictive and affective comorbidity in opioid use disorder.Drug Alcohol Depend. 2021 Apr 1;221:108602. doi: 10.1016/j.drugalcdep.2021.108602. Epub 2021 Feb 22. Drug Alcohol Depend. 2021. PMID: 33652377 Free PMC article. Review.
References
-
- Fatseas M., Serre F., Alexandre J.M. et al. (2015) Craving and substance use among patients with alcohol, tobacco, cannabis or heroin addiction: a comparison of substance- and person-specific cues. Addiction, 110, 1035–1042. - PubMed
Publication types
MeSH terms
Substances
Grants and funding
LinkOut - more resources
Full Text Sources
Medical
