Comparative Study
. 2019 Jan 1;36(1):97-111.
doi: 10.1093/molbev/msy199.

Recombination and Large Structural Variations Shape Interspecific Edible Bananas Genomes

Affiliations
Comparative Study

Recombination and Large Structural Variations Shape Interspecific Edible Bananas Genomes

Franc-Christophe Baurens et al. Mol Biol Evol. .

Abstract

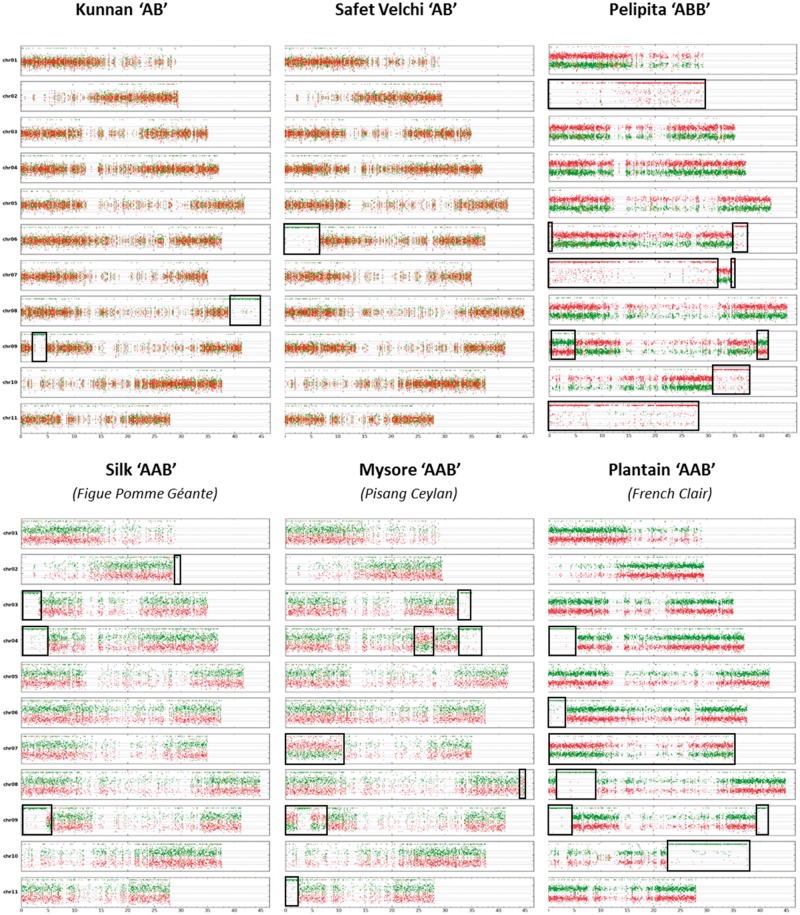
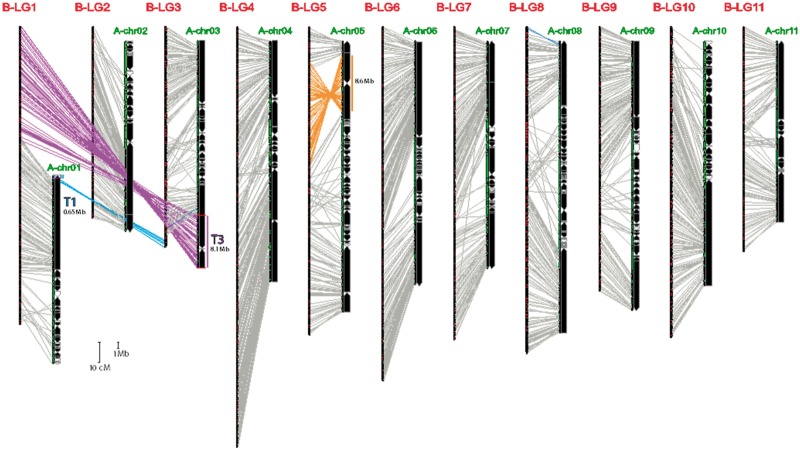
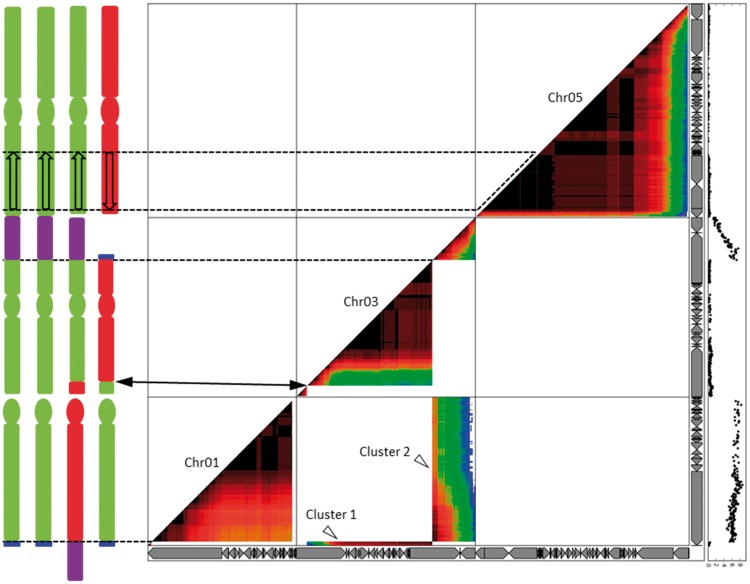
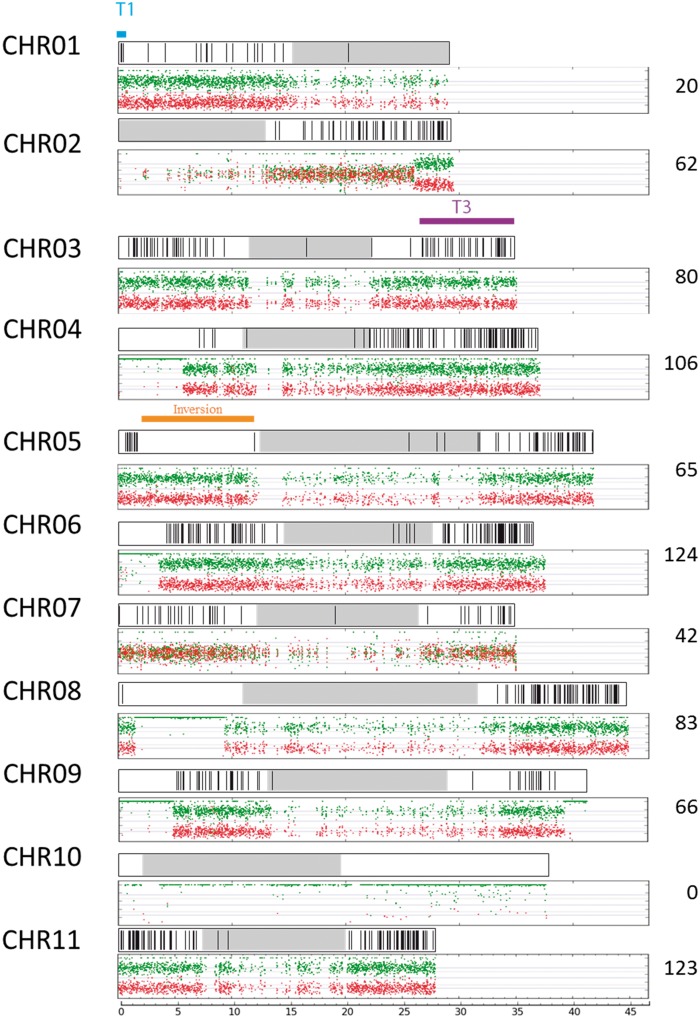
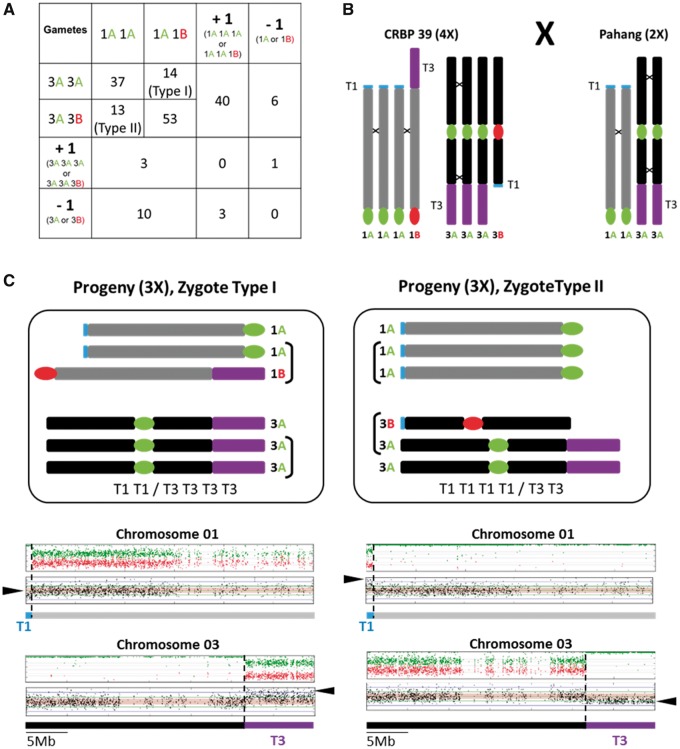
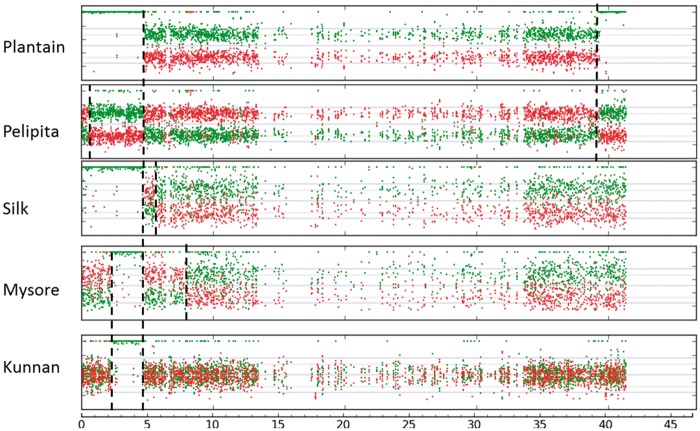
Admixture and polyploidization are major recognized eukaryotic genome evolutionary processes. Their impacts on genome dynamics vary among systems and are still partially deciphered. Many banana cultivars are triploid (sometimes diploid) interspecific hybrids between Musa acuminata (A genome) and M. balbisiana (B genome). They have no or very low fertility, are vegetatively propagated and have been classified as "AB," "AAB," or "ABB" based on morphological characters. We used NGS sequence data to characterize the A versus B chromosome composition of nine diploid and triploid interspecific cultivars, to compare the chromosome structures of A and B genomes and analyze A/B chromosome segregations in a polyploid context. We showed that interspecific recombination occurred frequently between A and B chromosomes. We identified two large structural variations between A and B genomes, a reciprocal translocation and an inversion that locally affected recombination and led to segregation distortion and aneuploidy in a triploid progeny. Interspecific recombination and large structural variations explained the mosaic genomes observed in edible bananas. The unprecedented resolution in deciphering their genome structure allowed us to start revisiting the origins of banana cultivars and provided new information to gain insight into the impact of interspecificity on genome evolution. It will also facilitate much more effective assessment of breeding strategies.


Figures

Fig. 1.
Fig. 1.
Mosaic genome structure of A/B interspecific banana cultivars. Coverage ratios for alleles specific to the A genome (green dots) and to the B genome (red dots) are plotted along the 11 pseudochromosomes of the Musa acuminata reference genome. Open boxes indicate chromosome segments that differ from the conventional genomic classification (“AB,” “ABB,” “AAB”). The scale is indicated (in Mb) at the bottom of each figure.
Fig. 2.
Fig. 2.
Comparison of the genetic map of the Musa balbisiana PKW accession (genome B) with the M. acuminata (genome A) reference sequence assembly. The 11 linkage groups of PKW (genome B) are represented on the left (scale bar: 10 cM) and the genome A reference sequence assembly on the right with black or open arrows representing oriented or nonoriented scaffolds, respectively (scale bar: 1 Mb). Markers from each LG of the B genetic map that were aligned to one A reference chromosome are connected in gray. Spindles of >10 markers highlighting large structural variations between A and B genomes are connected in different colors: orange for a large inversion on chromosome 5 and blue or purple for a large reciprocal translocation involving chromosomes 1 (T1) and 3 (T3).
Fig. 3.
Fig. 3.
Pairwise association of B genome specific SNPs in AAAB×AA progeny projected on chromosomes 1, 3, and 5 of the A genome reference assembly. Chromosomes 1, 3, and 5 of the Musa acuminata reference genome assembly are represented by horizontal and vertical gray arrow boxes (each one representing a scaffold). The marker linkage/pairwise association is represented by a warm-cool color gradient from dark red to blue for strong linkage and weak linkage, respectively. The black curve on the right represents segregation distortion (calculated as the log10P value of the χ2 test to assess the deviation from the expected Mendelian segregation ratio). Two clusters of B markers linking two independent A reference chromosomes corresponding to the reciprocal translocation detected in PKW (fig. 2) are observed (Clusters 1 and 2, open arrowheads). No recombination was detected (dash line) in the region corresponding to the inversion in PKW as compared with the A reference genome. The putative karyotype of the tetraploid CRBP39 is indicated on the left. Vertical bars represent chromosome arms, circles represent centromeric regions and A/B chromosome segments are in green and red, respectively. Structural variations are indicated in the chromosome bodies (translocated fragments: T1 = blue, T3 = purple; inverted fragment = open arrow) and connected to the dot plot with black lines. In chromosome 3, the black arrows indicate a breakpoint in genetic linkage, potentially corresponding to an A/B recombination breakpoint in the CRBP39 chromosome.
Fig. 4.
Fig. 4.
Interspecific A/B recombination detected in the CRBP39 “AAAB” progeny. The A/B mosaic genome structure of the 11 chromosome sets of the parent CRBP39 “AAAB” are represented based on the A reference chromosome assembly (bottom box) (see fig. 1 legend). Interspecific recombination breakpoints (black vertical lines) recorded in the 180 progenies from CRBP39×Pahang are plotted on the A reference chromosome assembly (top box). The total number of breakpoints per chromosome recorded in the 185 progenies is indicated on the right. Large structural variations between the A and B genome are indicated in blue and purple for reciprocal translocation (T1, T3) and orange for inversion.
Fig. 5.
Fig. 5.
Aneuploidy pattern involving chromosomes 1 and 3 observed in CRBP39 “AAAB”×Pahang “AA” progeny. (A) Number of progeny observed resulting from gametes with distinct combinations of homeologous chromosomes 1 (rows) and chromosomes 3 (columns). Aneuploid gametes with complete gain (+1) or loss (−1) are indicated. (B) Schematic representation of the homeologous chromosome constitution of the progeny parents for chromosomes 1 and 3. (C) Schematic representation of the homeologous chromosome constitution for chromosomes 1 and 3 for Type I and Type II progeny individuals (top boxes). A/B mosaic chromosome structure (see fig. 1 legend) and chromosomal segment coverage with the read-depth of each SNP marker plotted along the chromosomes for Type I and Type II progeny individuals (bottom boxes). T1 and T3 correspond to the reciprocal translocation differentiating chromosome 1 and 3 in A and B genomes. Arrows point to observed changes in allele ratios and read coverage.
Fig. 6.
Fig. 6.
Focus on A/B mosaic structure of chromosome 9 in the studied cultivated banana accessions. Coverage ratios for alleles specific to the A genome (green dots) and to the B genome (red dots) are plotted along the 11 pseudochromosomes of the Musa acuminata reference genome. Vertical dash lines indicate interspecific recombination breakpoints. The scale is indicated (in Mb) at the bottom of each figure.

References

    1. Boonruangrod R, Desai D, Fluch S, Berenyi M, Burg K.. 2008. Identification of cytoplasmic ancestor gene-pools of Musa acuminata Colla and Musa balbisiana Colla and their hybrids by chloroplast and mitochondrial haplotyping. Theor Appl Genet. 118(1):43–55. - PubMed
    1. Carreel F, de Leon DG, Lagoda P, Lanaud C, Jenny C, Horry JP, du Montcel HT.. 2002. Ascertaining maternal and paternal lineage within Musa by chloroplast and mitochondrial DNA RFLP analyses. Genome 45(4):679–692. - PubMed
    1. Carreel F, Fauré S, De Leon DG, Lagoda PJL, Perrier X, Bakry F, Du Montcel HT, Lanaud C, Horry J-P.. 1994. Evaluation de la diversité génétique chez les bananiers diploïdes (Musa sp.). Genet Sel Evol. 26(Suppl):125s–136s.
    1. Chabannes M, Baurens F-C, Duroy P-O, Bocs S, Vernerey M-S, Rodier-Goud M, Barbe V, Gayral P, Iskra-Caruana M-L.. 2013. Three infectious viral species lying in wait in the banana genome. J Virol. 87(15):8624–8637. - PMC - PubMed
    1. Cheesman EE. 1947. Classification of the bananas. I. The genus Ensete Horan and the genus Musa L. Kew Bulletin 2(2):97–117.

Publication types