

Inhibitors of the renin-angiotensin system ameliorates clinical and pathological aspects of experimentally induced nephrotoxic serum nephritis
- PMID: 30403908
- PMCID: PMC6225365
- DOI: 10.1080/0886022X.2018.1533867
Inhibitors of the renin-angiotensin system ameliorates clinical and pathological aspects of experimentally induced nephrotoxic serum nephritis
Abstract
Introduction: Chronic kidney disease (CKD) is a global health concern, but the current treatments only slow down the progression. Thus an improved understanding of the pathogenesis and novel treatments of CKD are needed. The nephrotoxic nephritis (NTN) model has the potential to study the pathogenesis of CKD as it resembles human CKD. The classical treatments with angiotensin II receptor blocker (ARB) or the angiotensin-converting enzyme inhibitor (ACE I) have shown a clinical effect in CKD.
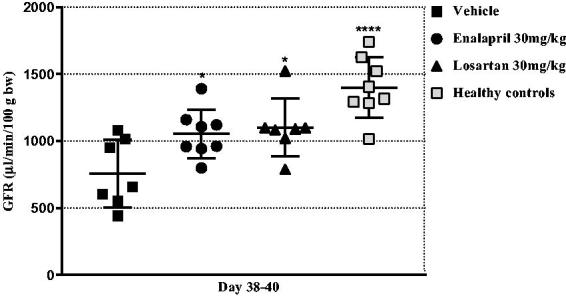
Methods: We characterized the disease development in the NTN model over 11 weeks by investigating functional and histopathological changes. We tested doses of 15 and 30 mg/kg/day enalapril and losartan in the NTN model in order to investigate the effect of inhibiting the renin-angiotensin-system (RAS).
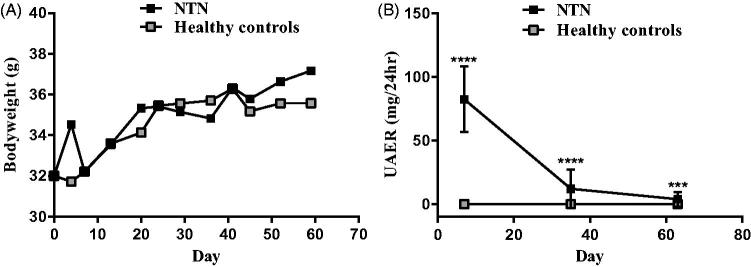
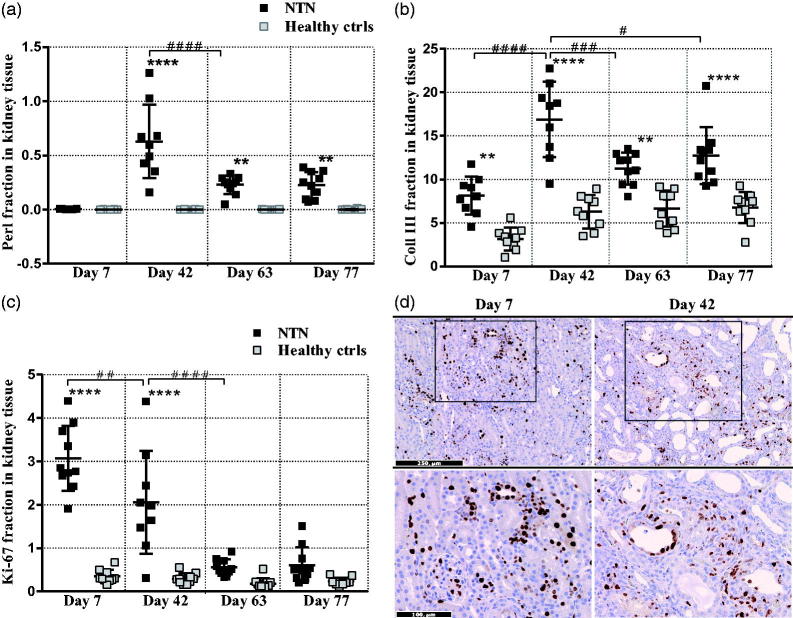
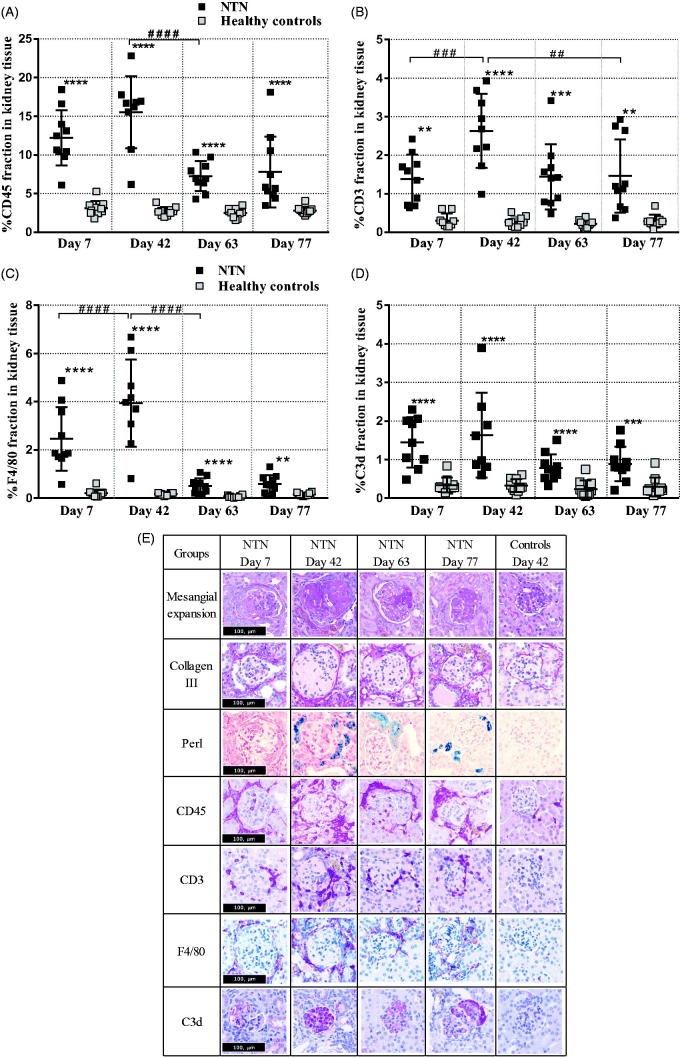
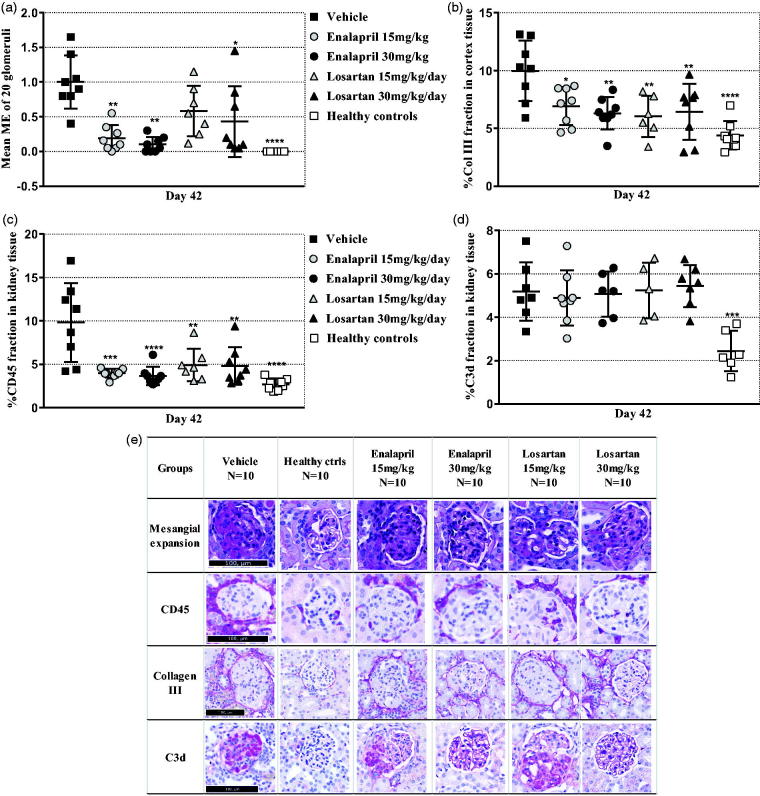
Results: The NTN model displayed albuminuria peaking on days 6-7, mesangial expansion (ME), renal fibrosis, inflammation and iron accumulation peaking on day 42. However, albuminuria, ME, renal fibrosis and inflammation were still significantly present on day 77, suggesting that the NTN model is useful for studying both the acute and chronic disease phases. Enalapril and losartan significantly enhanced the glomerular filtration rate (GFR) and decreased albuminuria, ME, renal fibrosis and inflammation of NTN-induced kidney disease in mice.
Conclusions: This is the first study showing a comprehensive pathological description of the chronic features of the murine NTN model and that inhibiting the RAS pathway show a significant effect on functional and morphological parameters.
Keywords: Nephrotoxic serum nephritis; angiotensin II receptor blocker; angiotensin-converting enzyme inhibitor; pathology.
Figures
Similar articles
-
Liraglutide Improves the Kidney Function in a Murine Model of Chronic Kidney Disease.Nephron. 2020;144(11):595-606. doi: 10.1159/000509418. Epub 2020 Sep 2. Nephron. 2020. PMID: 32877912
-
Renin-angiotensin system blockade alone or combined with ETA receptor blockade: effects on the course of chronic kidney disease in 5/6 nephrectomized Ren-2 transgenic hypertensive rats.Clin Exp Hypertens. 2017;39(2):183-195. doi: 10.1080/10641963.2016.1235184. Epub 2017 Mar 1. Clin Exp Hypertens. 2017. PMID: 28287881
-
Adjunctive therapy with statins reduces residual albuminuria/proteinuria and provides further renoprotection by downregulating the angiotensin II-AT1 pathway in hypertensive nephropathy.J Hypertens. 2017 Jul;35(7):1442-1456. doi: 10.1097/HJH.0000000000001325. J Hypertens. 2017. PMID: 28244896
-
Angiotensin II receptor antagonists versus angiotensin converting enzyme inhibitors: effects on renal function.J Hypertens Suppl. 1994 Nov;12(9):S3-9. J Hypertens Suppl. 1994. PMID: 7884582 Review.
-
Evidence for a dose effect of renin-angiotensin system inhibition on progression of microalbuminuria in Type 2 diabetes: a meta-analysis.Diabet Med. 2011 Oct;28(10):1182-7. doi: 10.1111/j.1464-5491.2011.03341.x. Diabet Med. 2011. PMID: 21627686
Cited by
-
Activation of the renal GLP-1R leads to expression of Ren1 in the renal vascular tree.Endocrinol Diabetes Metab. 2021 Mar 19;4(3):e00234. doi: 10.1002/edm2.234. eCollection 2021 Jul. Endocrinol Diabetes Metab. 2021. PMID: 34277961 Free PMC article.
-
Comprehensive analyses of the microRNA-messenger RNA-transcription factor regulatory network in mouse and human renal fibrosis.Front Genet. 2022 Nov 15;13:925097. doi: 10.3389/fgene.2022.925097. eCollection 2022. Front Genet. 2022. PMID: 36457754 Free PMC article.
-
The impact of dyslipidemia and oxidative stress on vasoactive mediators in patients with renal dysfunction.Int Urol Nephrol. 2019 Dec;51(12):2235-2242. doi: 10.1007/s11255-019-02319-7. Epub 2019 Oct 22. Int Urol Nephrol. 2019. PMID: 31641998 Review.
References
-
- Nagai H, Yamada H, Nishigaki T, et al. . The susceptibility of experimental glomerulonephritis in six different strains of mice. J Pharmacobio-Dyn. 1985;8:586–589. - PubMed
-
- Fyhrquist F, Metsarinne K, Tikkanen I. Role of angiotensin II in blood pressure regulation and in the pathophysiology of cardiovascular disorders. J Hum Hypertens. 1995;9 (Suppl 5):S19–S24. - PubMed
MeSH terms
Substances
LinkOut - more resources
Full Text Sources
Other Literature Sources
Research Materials
Miscellaneous