. 2018 Nov 6;25(6):1458-1468.e4.
doi: 10.1016/j.celrep.2018.10.047.

Analysis of Single-Cell RNA-Seq Identifies Cell-Cell Communication Associated with Tumor Characteristics

Affiliations

Analysis of Single-Cell RNA-Seq Identifies Cell-Cell Communication Associated with Tumor Characteristics

Manu P Kumar et al. Cell Rep. .

Abstract

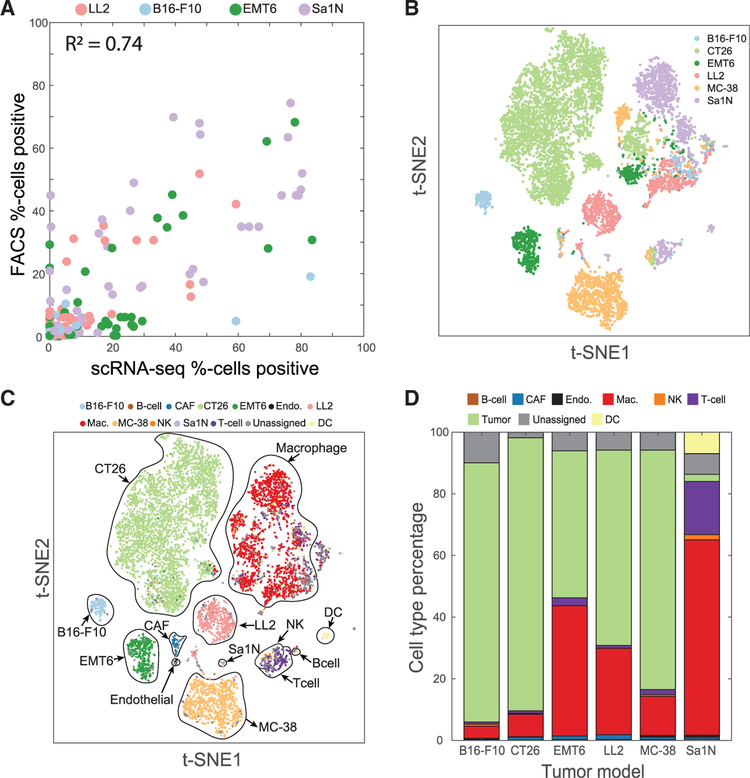
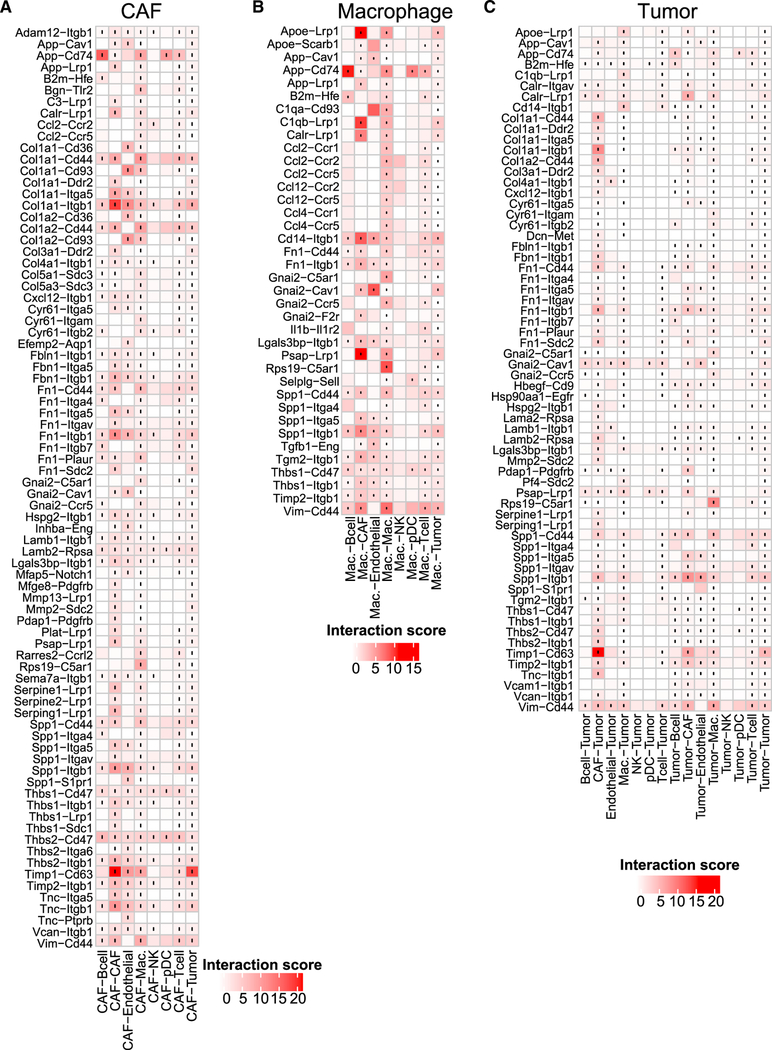
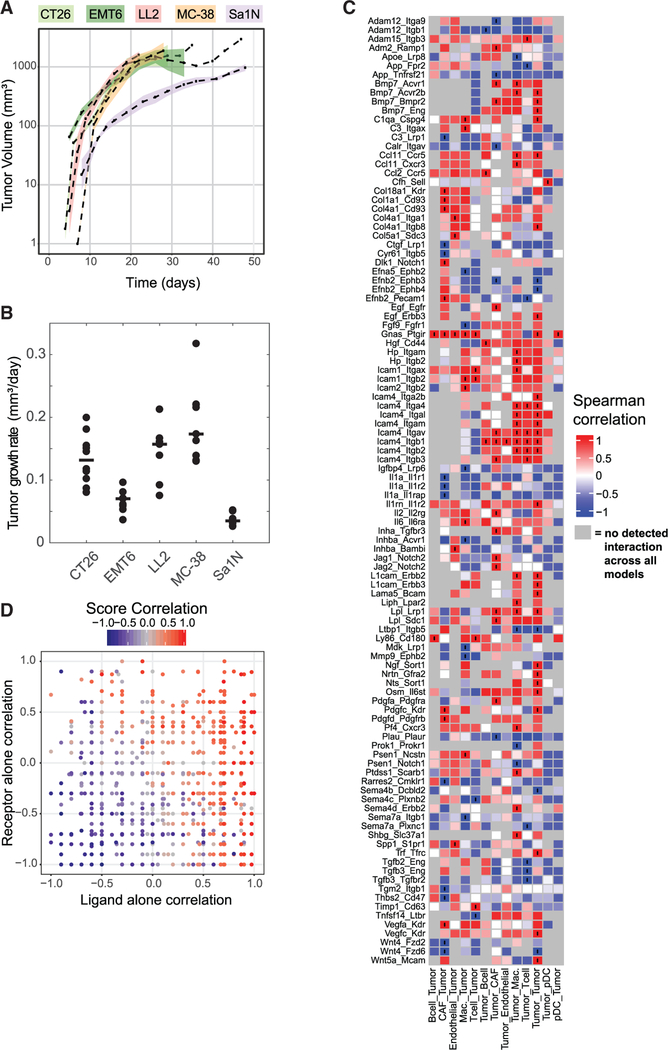
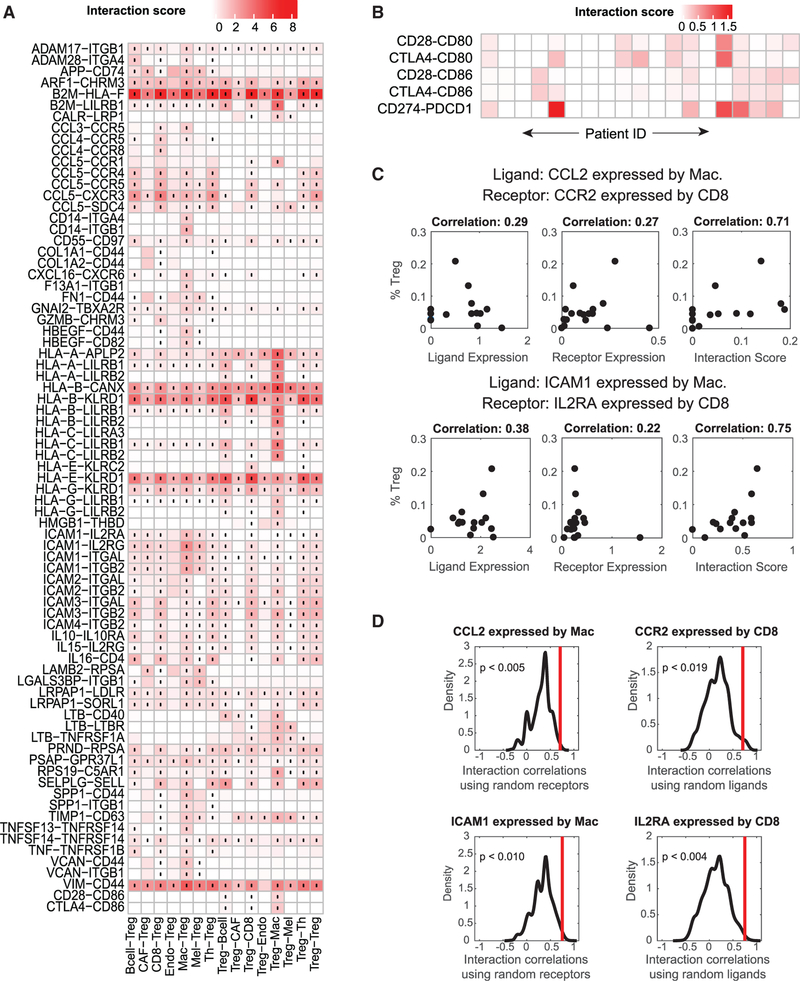
Tumor ecosystems are composed of multiple cell types that communicate by ligand-receptor interactions. Targeting ligand-receptor interactions (for instance, with immune checkpoint inhibitors) can provide significant benefits for patients. However, our knowledge of which interactions occur in a tumor and how these interactions affect outcome is still limited. We present an approach to characterize communication by ligand-receptor interactions across all cell types in a microenvironment using single-cell RNA sequencing. We apply this approach to identify and compare the ligand-receptor interactions present in six syngeneic mouse tumor models. To identify interactions potentially associated with outcome, we regress interactions against phenotypic measurements of tumor growth rate. In addition, we quantify ligand-receptor interactions between T cell subsets and their relation to immune infiltration using a publicly available human melanoma dataset. Overall, this approach provides a tool for studying cell-cell interactions, their variability across tumors, and their relationship to outcome.

Keywords: cancer patient samples; cell-cell communication; computational analysis; ligand-receptor interaction; single-cell RNA sequencing; syngeneic mouse models; tumor microenvironment.


Conflict of interest statement

DECLARATION OF INTERESTS

Several co-authors are employed by Merrimack Pharmaceuticals, Inc.

Figures

Figure 1.
Figure 1.. T-SNE Visualization of Single-Cell Sequencing Data and Cell Type Classification
(A) The percentage of cells positive for a variety of immune cell markers as measured by either scRNA-seq (x axis) or flow cytometry (y axis) is consistent across tumor models.(B and C) t-distributed scholastic neighbor embedding (t-SNE) plots of cells from six syngeneic tumor models show distinct clusters predominantly determined by cell type.(B) Cells are colored by the tumor model from which the cell originated.(C) Cells are colored by the cell type label assigned at the end of the classification procedure.(D) Percentages of cell types vary across the different tumor models. To reflect the actual cell type abundances, only data from samples not enriched for CD45 are shown. See also Figures S1 and S2.
Figure 2.
Figure 2.. Quantification of Cell-Cell Interactions Occurring in the Tumor Microenvironment
Heatmaps show selected interaction scores calculated as the product of the average ligand expression of the first cell type and average receptor expression of the second cell type. Cell type labels are written as (cell type expressing the ligand) ‒ (cell type expressing the receptor). Black dots indicate interactions that are significantly present across all tumor (one-sided Wilcoxon rank-sum test and Benjamini Hochberg false discovery rate [FDR] < 0.33).(A) Interactions where CAFs secrete the ligand (only interactions with a score greater than 2.5 across any cell type pair are displayed).(B) Interactions where macrophages secreted the ligand (only interactions with a score greater than 2.5 across any cell type pair are displayed).(C) Interactions involving tumor cells (only interactions with a score greater than 1.5 across any cell type pair are displayed). See also Figure S3.
Figure 3.
Figure 3.. Interaction Scores Correlate with Relevant Characteristics of the Tumor Microenvironment
(A) Tumor volume (y axis) of treatment-naive mice measured over time (x axis) (Table S4). Dashed lines indicate the mean of a syngeneic tumor model, and shaded areas represent 1 SEM (n = 8 for Sa1N, 7 for LL2, 10 for CT26, 9 for EMT6, and 9 for MC38). Instances with no shading result from only one mouse surviving at the measured time points. Linear curves were fit to the log-normalized growth curves, and the slope of fit curves was used as a metric for tumor growth. (B) Quantified growth rates for each model. Each point represents a single mouse, and the horizontal black line indicates the median growth rate used for correlation with interaction scores.(C) Heatmap showing the Spearman correlation of interaction scores (shown in Figure 2) with tumor growth. Interactions marked with black circles indicate correlations with p < 0.01. Grey boxes indicate interactions for which the interaction score was zero across all models and no correlation could be computed.(D) Distribution of receptor only, ligand only, and interaction score correlations. Each point represents an interaction (only autocrine interactions between tumor cells are displayed). The x axis represents the correlation of ligand expression alone with tumor growth rate, whereas the y axis represents the correlation of the receptor expression alone with tumor growth rate. Points are colored according to the strength of correlation of the interaction scores with tumor growth rate. Gray points represent interactions that were not detected across all syngeneic tumor models.
Figure 4.
Figure 4.. Assessing Cell-Cell Interactions Occurring in Human Metastatic Melanoma
(A) Cell-cell interactions involving Tregs in human metastatic melanoma averaged across 19 tumor samples. The cell type labels are written as (cell type expressing the ligand) ‒ (cell type expressing the receptor). Black dots indicate interactions that are significantly present across all tumors (one-sided Wilcoxon rank-sum test and Benjamini Hochberg FDR < 0.05). Only interactions with a score greater than 0.5 across any cell type pair are displayed.(B) Examination of tumor-specific interactions in the B7 family between CD8+ T cells and Tregs shows that interactions that occur on average in (A) do not occur in all individual patients.(C) Example interactions between macrophages and CD8 cells where the receptor and ligand components of an interaction do not individually correlate with Treg percentage but the interaction score is strongly correlated with phenotype.(D) Distribution of Spearman correlation coefficients between Treg percentage and randomized ligand-receptor interactions from (C). Red lines indicate the Spearman correlation of the actual ligand-receptor pair. The p values indicate the probability that a randomized interaction pair has a stronger correlation than the actual interaction pair. See also Figure S4.

Similar articles

Cited by

References

    1. Biswas SK, and Mantovani A (2010). Macrophage plasticity and interaction with lymphocyte subsets: cancer as a paradigm. Nat. Immunol 11, 889–896. - PubMed
    1. Bittner S, Knoll G, and Ehrenschwender M (2017). Death receptor 3 signaling enhances proliferation of human regulatory T cells. FEBS Lett 591, 1187–1195. - PubMed
    1. Blake JA, Eppig JT, Kadin JA, Richardson JE, Smith CL, and Bult CJ; the Mouse Genome Database Group (2017). Mouse Genome Database (MGD)-2017: community knowledge resource for the laboratory mouse. Nucleic Acids Res 45 (D1), D723–D729. - PMC - PubMed
    1. Bodenmiller B (2016). Multiplexed Epitope-Based Tissue Imaging for Discovery and Healthcare Applications. Cell Syst 2, 225–238. - PubMed
    1. Camp JG, Sekine K, Gerber T, Loeffler-Wirth H, Binder H, Gac M, Kanton S, Kageyama J, Damm G, Seehofer D, et al. (2017). Multilineage communication regulates human liver bud development from pluripotency. Nature 546, 533–538. - PubMed

Publication types