. 2018 Nov 6;25(6):1469-1484.e5.
doi: 10.1016/j.celrep.2018.10.036.

A Screen Using iPSC-Derived Hepatocytes Reveals NAD+ as a Potential Treatment for mtDNA Depletion Syndrome

Affiliations

A Screen Using iPSC-Derived Hepatocytes Reveals NAD+ as a Potential Treatment for mtDNA Depletion Syndrome

Ran Jing et al. Cell Rep. .

Abstract

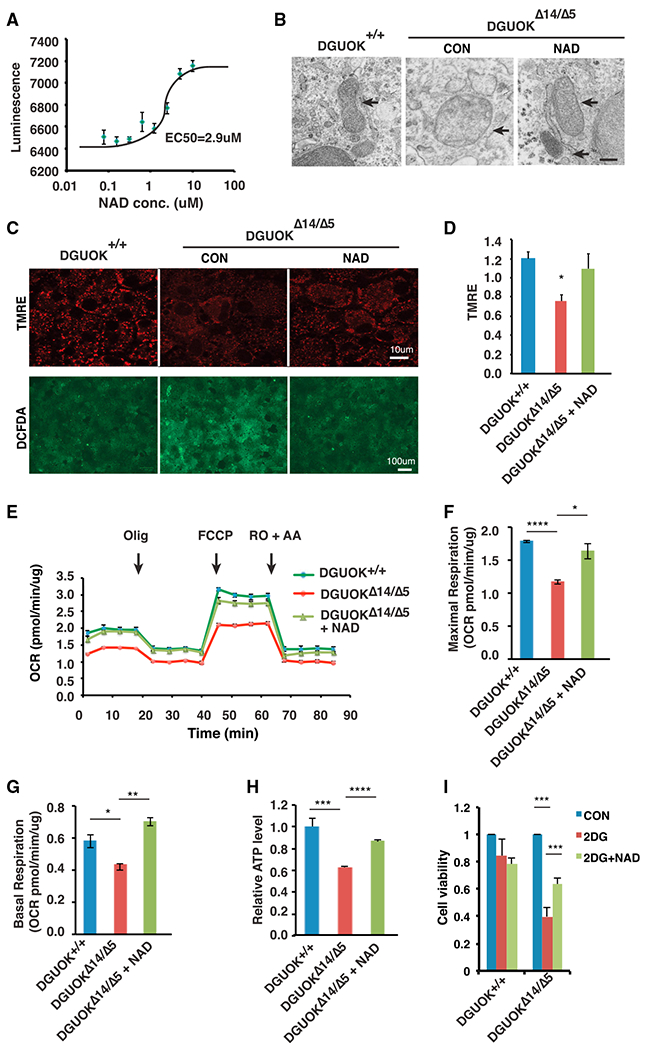
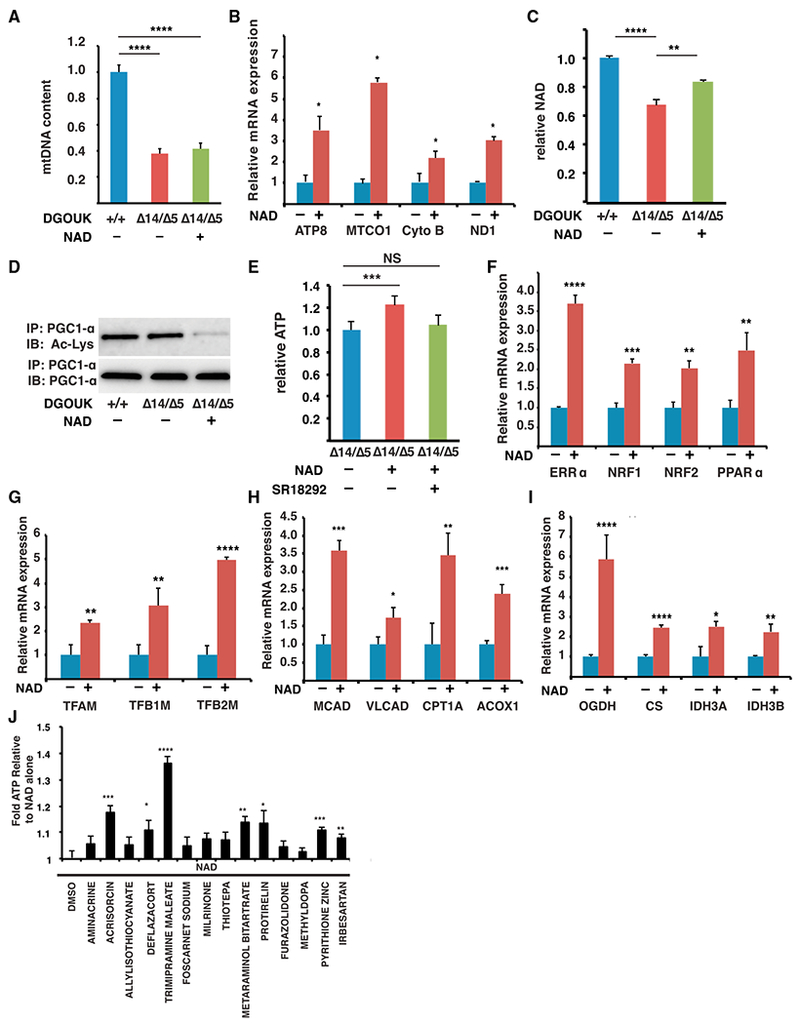
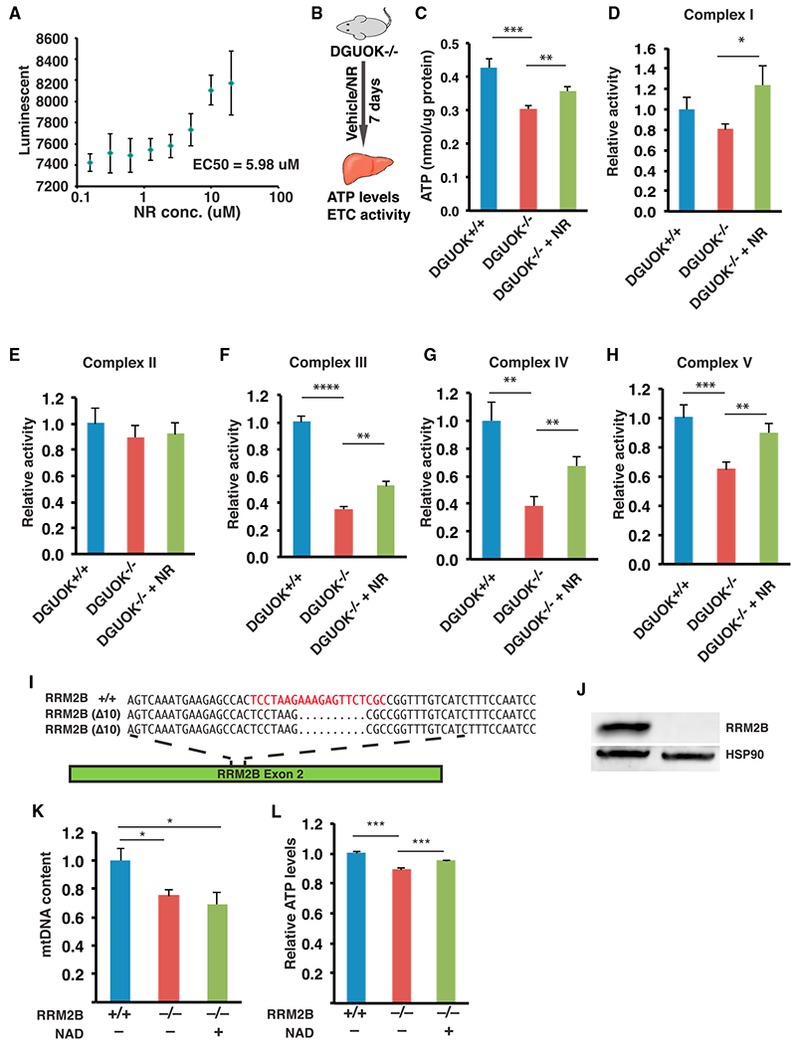
Patients with mtDNA depletion syndrome 3 (MTDPS3) often die as children from liver failure caused by severe reduction in mtDNA content. The identification of treatments has been impeded by an inability to culture and manipulate MTDPS3 primary hepatocytes. Here we generated DGUOK-deficient hepatocyte-like cells using induced pluripotent stem cells (iPSCs) and used them to identify drugs that could improve mitochondrial ATP production and mitochondrial function. Nicotinamide adenine dinucleotide (NAD) was found to improve mitochondrial function in DGUOK-deficient hepatocyte-like cells by activating the peroxisome proliferator-activated receptor gamma coactivator 1-alpha (PGC1α). NAD treatment also improved ATP production in MTDPS3-null rats and in hepatocyte-like cells that were deficient in ribonucleoside-diphosphate reductase subunit M2B (RRM2B), suggesting that it could be broadly effective. Our studies reveal that DGUOK-deficient iPSC-derived hepatocytes recapitulate the pathophysiology of MTDPS3 in culture and can be used to identify therapeutics for mtDNA depletion syndromes.

Keywords: drug screen; iPSC-derived hepatocytes; inborn errors in hepatic metabolism; liver disease; mitochondrial disease.


Conflict of interest statement

DECLARATION OF INTERESTS

The authors declare no competing interests.

Figures

Figure 1.
Figure 1.. Characterization of Glucose Metabolic Pathways during Human iPSC Differentiation to Hepatocyte-like Cells
(A) Heatmap showing relative abundance of 82 mRNAs encoding proteins with roles in glucose metabolism (67 electron transport chain genes and 15 glycolytic genes) (n = 3). (B) Dendrogram representing hierarchical cluster analyses of expression data. (C) OCR of day 0 iPSCs (red) and day 20 hepatocyte-like cells (green) differentiated from wild-type iPSCs, determined by Seahorse assay (n = 3, mean ± SEM). Olig, oligomycin (1 μM); FCCP, carbonyl cyanide-p-trifluoromethoxyphenylhydrazone (1 μM); RO, rotenone (2 μM); AA, antimycin A (1 μM). (D) Bar graph showing the ratio of OCR to ECAR during iPSC differentiation as determined by Seahorse assay (n = 3 biological replicates, mean ± SEM).
Figure 2.
Figure 2.. Generation of DGUOKΔ14/Δ5 iPSC-Derived Hepatocyte-like Cells
(A) Schematic illustration of DGUOK exon 4 showing the CRISPR/Cas9 guide (red) and nucleotide sequences of DGUOK wild-type (DGUOK+/+) and mutant alleles (DGUOKΔ14/Δ5). Black arrow showing relative position of PCR primers used to identify indels. (B) Image of the polyacrylamide gel showing DGUOK exon 4 amplicons from control iPSCs (+/+) and iPSCs harboring compound heterozygous deletions of 14 and 5 bp within DGUOK exon 4 (Δ14/Δ5). (C) Immunoblot to detect DGUOK in either control (+/+) or DGUOKΔ14/Δ5 hepatocytes. HSP90 was used as a loading control. (D) Quantification of DGUOK protein by densitometry of immunoblots. DGUOK protein was normalized to total protein (n = 3 biological replicates, mean ± SEM, ****p ≤ 0.0001). (E) Bar graph showing relative steady-state level of DGUOK mRNA in DGUOK+/+ and DGUOKΔ14/Δ5 iPSCs (n = 3 biological replicates, mean ± SEM, ****p ≤ 0.0001). (F) Representative fluorescent images of DAPI (blue), HNF4A (green), and albumin (red) staining on day 20 wild-type and DGUOKΔ14/Δ5 hepatocyte-like cells. Scale bar, 50 μm. (G) Bar graph showing relative expression levels of hepatic genes in DGUOK+/+ and DGUOKΔ14/Δ5 hepatocytes at day 20 of differentiation (n = 3 biological replicates, mean ± SEM).
Figure 3.
Figure 3.. Analysis of DGUOK-Deficient iPSC-Derived Hepatocyte-like Cells
(A) Bar graph showing mtDNA content during the differentiation of wild-type (blue) and DGUOKΔ14/Δ5 (red) iPSCs (n = 8 biological replicates, mean ± SEM, *p ≤ 0.05, **p ≤ 0.001). (B) Bar graph showing mtDNA content in iPSC-derived hepatocyte-like cells from wild-type, DGUOKΔ14/Δ5, and DGUOKΔ14/Δ5;;indDGUOK iPSCs in the absence (blue) or presence (red) of Dox (10 ng/mL) (n = 8 biological replicates, mean ± SEM, *p ≤ 0.05). (C) Bar graph showing mtDNA content in day 20 hepatocytes from wild-type and DGUOKΔ14/Δ5 iPSCs with (blue) or without (red) treatment with dAMP and dGMP (n = 16, mean ± SEM, *p ≤ 0.05). (D) Micrographs showing electron microscopy (left and middle) and TMRE staining (right) of day 20 DGUOK+/+ and DGUOKΔ14/Δ5 hepatocytes. Arrows, mitochondria. Black scale bar, 800 nm; white scale bar, 100 μm. (E) Immunoblot showing levels of electron transport chain proteins encoded by mitochondrial or nuclear genomes in day 20 wild-type (+/+), DGUOKΔ14/Δ5, and DGUOKΔ14/Δ5;indDGUOK hepatocytes in the presence (+) or absence (−) of Dox (10 ng/mL). HSP90 was used as a loading control. (F) Graph showing oxygen consumption rate (OCR) of control (green) and DGUOKΔ14/Δ5 (red) hepatocytes at day 20 of differentiation as determined by Seahorse assay (n = 3, mean ± SEM). (G) Basal respiration in DGUOK+/+ and DGUOKΔ14/Δ5 iPSC-derived hepatocyte-like cells (mean ± SEM, n = 3, *p ≤ 0.05). (H) Maximal respiration in DGUOK+/+ and DGUOKΔ14/Δ5 iPSC-derived hepatocyte-like cells (mean ± SEM, n = 3, *p ≤ 0.05). (I) Bar graph showing intracellular ATP levels in day 20 DGUOK+/+, DGUOKΔ14/Δ5, and DGUOKΔ14/Δ5;;indDGUOK hepatocytes in the presence (red) or absence (blue) of Dox (10 ng/mL) (n = 8, mean ± SEM, ****p ≤ 0.0001). (J) ROS levels measured by DCFDA staining in day 20 DGUOK+/+ and DGUOKΔ14/Δ5 hepatocytes (scale bar, 100 μm). (K) Bar graph showing extracellular lactate levels in day 20 DGUOK+/+ and DGUOKΔ14/Δ5 hepatocytes (mean ± SEM, n = 3, *p ≤ 0.05).
Figure 4.
Figure 4.. Drug Screen Using DGUOK-Deficient iPSC-Derived Hepatocyte-like Cells
(A) Flow chart showing approach to identify drugs. (B) Graphs showing the ATP levels in DGUOK+/+ (blue diamond) and DGUOKΔ14/Δ5 (red box) cells on day 20 of differentiation. Results were used to calculate Z factor (Z′robust = 0.7). (C) Schematic showing the experimental approach used in the primary screen. (D) Graphs showing the result of primary screen. Z scores were calculated on the basis of ATP levels. Drugs with Z scores ≥ 3 (blue bar) were identified as primary hits. (E) Graph showing relative levels of ATP (normalized to control wells) of confirmed hits (p ≥ 0.05). (F) Table showing a list of top 15 confirmed hits with increases in ATP levels ≥ 20%.
Figure 5.
Figure 5.. NAD Is Capable of Restoring Mitochondrial Activity and ATP Levels
(A) Graph showing the result of a dose-response assay to detect ATP levels (luminescence) in DGUOKΔ14/Δ5 hepatocyte-like cells treated with NAD at 0.08, 0.16, 0.32, 0.6, 1.25, 2.5, 5, and 10 μM (n = 4 biological replicates, mean ± SEM). (B) Representative electron microscopy images of mitochondria in DGUOK+/+, untreated DGUOKΔ14/Δ5, and NAD (5 μM) treated DGUOKΔ14/Δ5 hepatocyte-like cells. Arrow, mitochondria. Scale bar, 200 nM. (C) Micrographs showing TMRE (red) and DCFDA (green) staining of day 20 DGUOK+/+ and DGUOKΔ14/Δ5 hepatocytes. Scale bars, 100 μm (lower) and 10 μm (upper). (D) Bar graph showing relative TMRE staining intensity measured by plate reader (n = 8, mean ± SEM, *p ≤ 0.05). (E) Graph showing OCR in wild-type, untreated DGUOKΔ14/Δ5, and NAD (5 μM) treated DGUOKΔ14/Δ5 hepatocyte-like cells, determined by seahorse assay. (F and G) Maximal respiration (F) and basal respiration (G) were calculated on the basis of OCR (n = 3 biological replicates, mean ± SEM, *p ≤ 0.05, **p ≤ 0.01, ****p ≤ 0.0001). (H) Bar graph showing relative ATP levels in wild-type cells, untreated DGUOKΔ14/Δ5 hepatocyte-like cells, and NAD (5 μM) treated DGUOKΔ14/Δ5 hepatocyte-like cells (n = 8 biological replicates, mean ± SEM, ****p ≤ 0.0001). (I) Bar graph showing cell viability of DGUOK+/+ and DGUOKΔ14/Δ5 hepatocyte-like cells that were untreated (blue) or treated for 24 hr with 20 mM 2-DG (red) or 2-DG + 5 μM NAD (green) (n = 3, mean ± SEM, *p % 0.05, ***p ≤ 0.001).
Figure 6.
Figure 6.. NAD Restores ATP Levels through Activation of PGC1α
(A) Bar graph showing relative mtDNA content in DGUOK+/+ cells, untreated DGUOKΔ14/Δ5 hepatocyte-like cells, and NAD-treated DGUOKΔ14/Δ5 hepatocyte-like cells (n = 8 biological replicates, mean ± SEM, ****p ≤ 0.0001) (B) Bar graph showing levels of mRNAs encoding electron transport chain proteins in DGUOKΔ14/Δ5 hepatocyte-like cells in the presence and absence of NAD (5 μM) (mean ± SEM, *p ≤ 0.05). (C) Bar graph showing that NAD treatment increases intracellular NAD+ levels in DGUOKΔ14/Δ5 hepatocyte-like cells (n = 8 biological replicates, mean ± SEM, ****p ≤ 0.0001). (D) Micrograph showing the results of an immunoprecipitation (anti-PGC1α) followed by immunoblot to detect total PGC1α and acetylated PGC1α in DGUOK+/+ iPSC-derived hepatocytes and in DGUOKΔ14/Δ5 hepatocyte-like cells with and without 5 μM NAD treatment. (E) Bar graph showing relative ATP levels in control DGUOK+/+ hepatocyte-like cells and in DGUOKΔ14/Δ5 hepatocyte-like cells treated with NAD in the absence and presence of SR18292 (n = 8, mean ± SEM, ***p ≤ 0.001). (F) Bar graph showing relative steady-state mRNA levels encoding transcription factors regulated by PGC1α (ERRα, NRF1, NRF2, and PPARα) (n = 3 biological replicates, mean ± SD, **p ≤ 0.01, ***p ≤ 0.001, ****p ≤ 0.0001). (G) Bar graph showing relative steady-state mRNA levels encoding mitochondrial transcription factors (TFAM, TFB1M, and TFB2M) (n = 3 biological replicates, mean ± SD, **p ≤ 0.01, ****p ≤ 0.0001). (H) Bar graph showing relative steady-state mRNA levels encoding FAO enzymes (MCAD, VLCAD, CPT1A, and ACOX1) (n = 3 biological replicates, mean ± SD, *p ≤ 0.05, **p ≤ 0.01, ***p ≤ 0.001). (I) Bar graph showing relative steady-state mRNA levels encoding key TCA cycle enzymes (OGDH, CS, IDH3A, and IDH3B) (n = 3 biological replicates, mean ± SD, *p ≤ 0.05, **p ≤ 0.01, ****p ≤ 0.0001). (J) Bar graph showing relative ATP levels in DGUOKΔ14/Δ5 hepatocyte-like cells treated with 5 μM NAD alone (DMSO) or with 5 μM NAD + 5 μM of each drug identified in the primary screen to increase ATP ≥ 20% (n = 8 biological replicates, mean ± SD, *p ≤ 0.05, **p ≤ 0.01, ***p ≤ 0.001, ****p ≤ 0.0001).
Figure 7.
Figure 7.. NR Increases Mitochondrial Activity and ATP Levels in DGUOK-Deficient Rats and RRM2B-Deficient Hepatocyte-like Cells
(A) Graph showing the result of a dose-response assay to detect ATP levels (luminescence) in DGUOKΔ14/Δ5 hepatocyte-like cells treated with nicotinamide riboside (NR) at 0.08, 0.16, 0.32, 0.6, 1.25, 2.5, 5, and 10 μM (n = 4 biological replicates, mean ± SEM). (B) Scheme of experimental approach used to test the effect of NR in DGUOK-deficient rats. (C–H) Bar graphs showing relative ATP levels (C), and electron transport chain complex I (D), II (E), III (F), IV (G), and V (H) activities in livers from DGUOK+/+ (n = 6, blue) or DGUOK−/− rats without (n = 6, red) or with 500 mg/kg/day NR treatment for 7 days (n = 7, green) (mean ± SEM, **p ≤ 0.01, ***p ≤ 0.001) (I) Schematic illustration of RRM2B exon 2 showing the CRISPR/Cas9 guide (red) and nucleotide sequences of RRM2B wild-type (RRM2B+/+) and mutant alleles (RRM2BΔ10/Δ10). (J) Micrograph of an immunoblot to detect expression of RRM2B and HSP90 in RRM2B+/+ and RRM2BΔ10/Δ10 iPSC–derived hepatocytes. (K) Bar graph showing relative mtDNA content in wild-type cells, untreated RRM2B−/− hepatocyte-like cells, and NAD-treated RRM2B−/− hepatocyte-like cells (n = 6, mean ± SEM, *p ≤ 0.05). (L) Bar graph showing relative ATP levels in control RRM2B+/+ iPSC-derived hepatocytes and in RRM2B−/− hepatocyte-like cells untreated or treated with 5 mM NAD (n = 12, mean ± SEM, ***p ≤ 0.001).

Similar articles

Cited by

References

    1. Almannai M, El-Hattab AW, and Scaglia F (2018). Mitochondrial DNA replication: clinical syndromes. Essays Biochem 62, 297–308. - PubMed
    1. Antonenkov VD, Isomursu A, Mennerich D, Vapola MH, Weiher H, Kietzmann T, and Hiltunen JK (2015). The human mitochondrial DNA depletion syndrome gene MPV17 encodes a non-selective channel that modulates membrane potential. J. Biol. Chem 290, 13840–13861. - PMC - PubMed
    1. Bai RK, and Wong LJ (2005). Simultaneous detection and quantification of mitochondrial DNA deletion(s), depletion, and over-replication in patients with mitochondrial disease. J. Mol. Diagn 7, 613–622. - PMC - PubMed
    1. Bennett B, Helbling D, Meng H, Jarzembowski J, Geurts AM, Friederich MW, Van Hove JLK, Lawlor MW, and Dimmock DP (2016). Potentially diagnostic electron paramagnetic resonance spectra elucidate the underlying mechanism of mitochondrial dysfunction in the deoxyguanosine kinase deficient rat model of a genetic mitochondrial DNA depletion syndrome. Free Radic. Biol. Med 92, 141–151. - PMC - PubMed
    1. Berger M, and Gastpar M (1996). Trimipramine: a challenge to current concepts on antidepressives. Eur. Arch. Psychiatry Clin. Neurosci 246, 235–239. - PubMed

Publication types

MeSH terms

Substances

LinkOut - more resources