. 2018 Nov 6;25(6):1650-1667.e8.
doi: 10.1016/j.celrep.2018.10.026.

The Mammalian Spermatogenesis Single-Cell Transcriptome, from Spermatogonial Stem Cells to Spermatids

Affiliations

The Mammalian Spermatogenesis Single-Cell Transcriptome, from Spermatogonial Stem Cells to Spermatids

Brian P Hermann et al. Cell Rep. .

Abstract

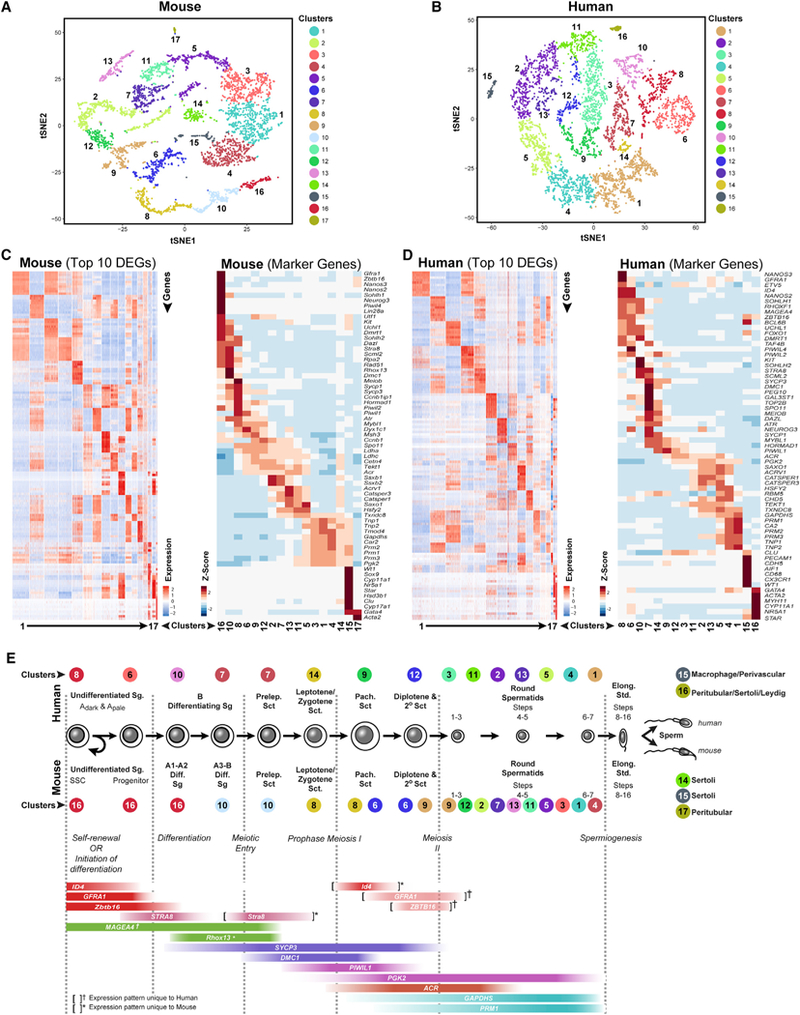
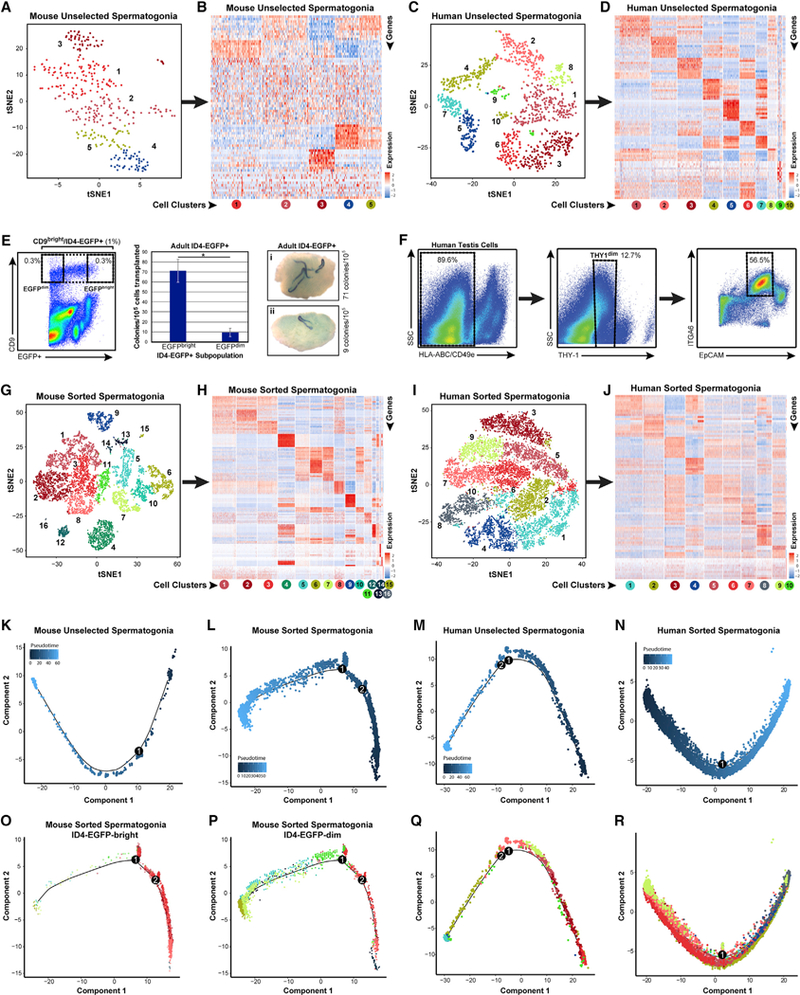
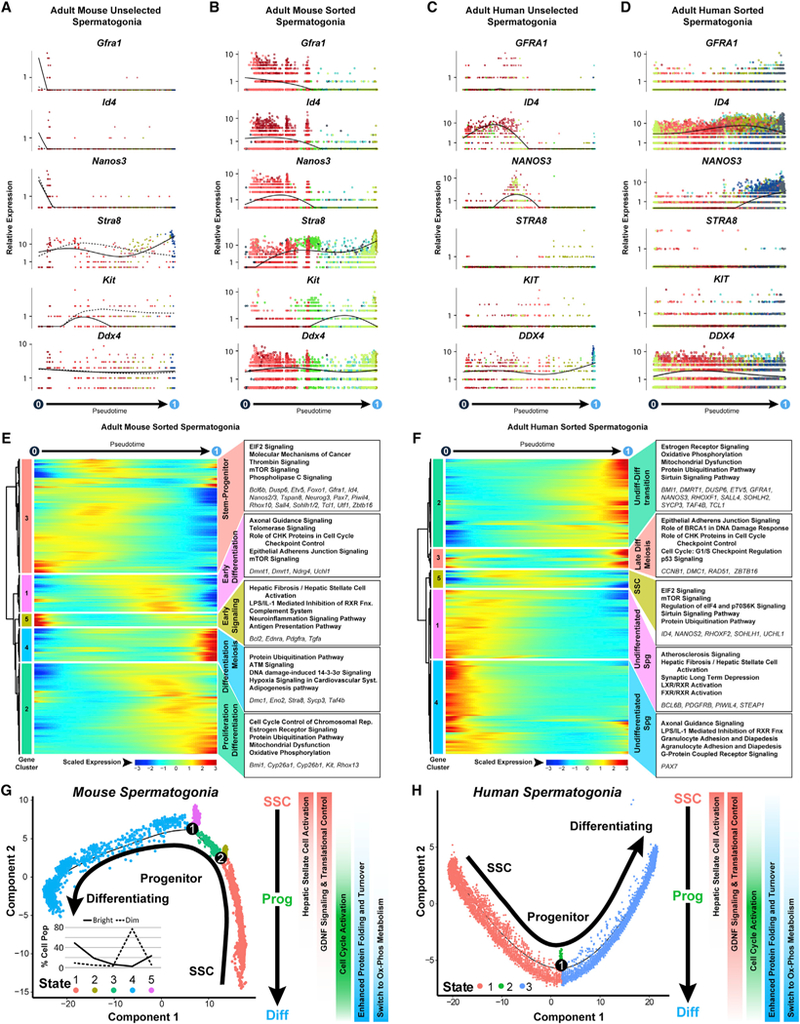
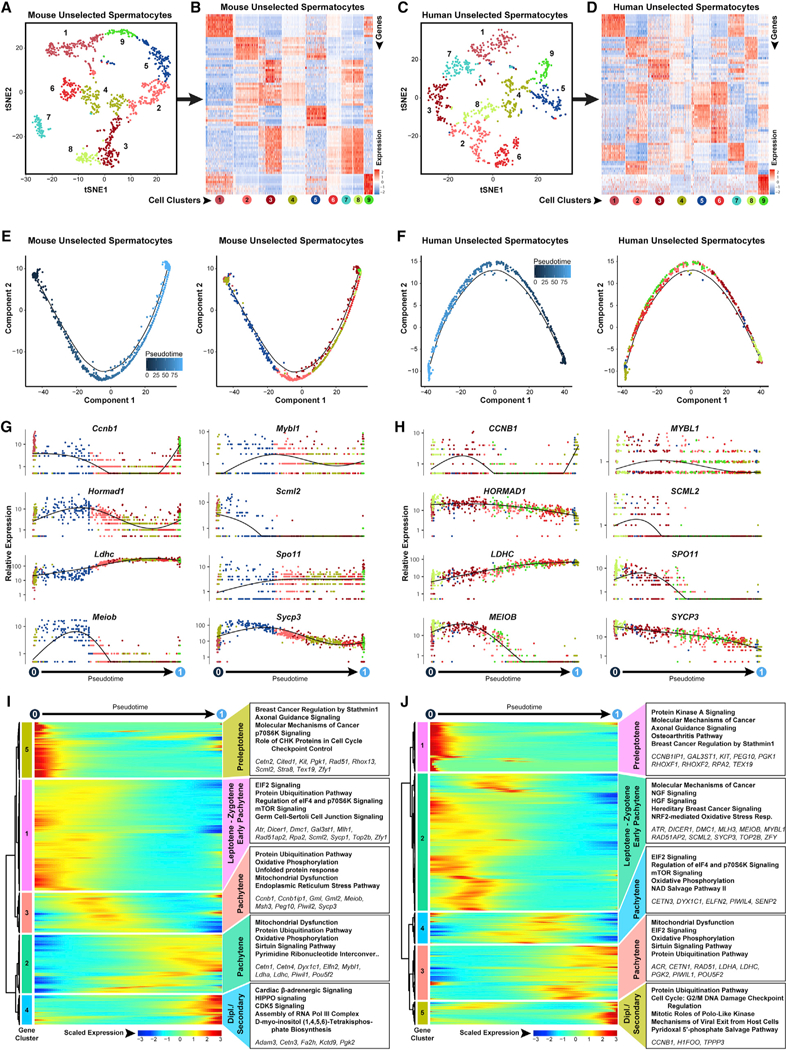
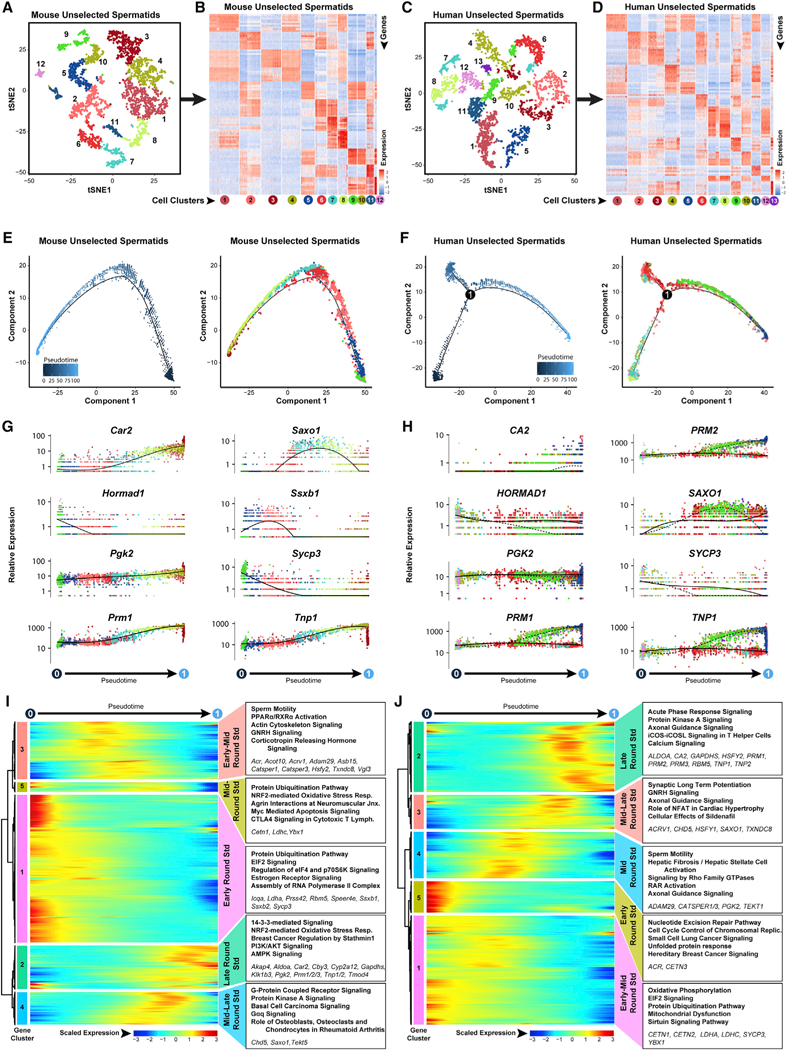
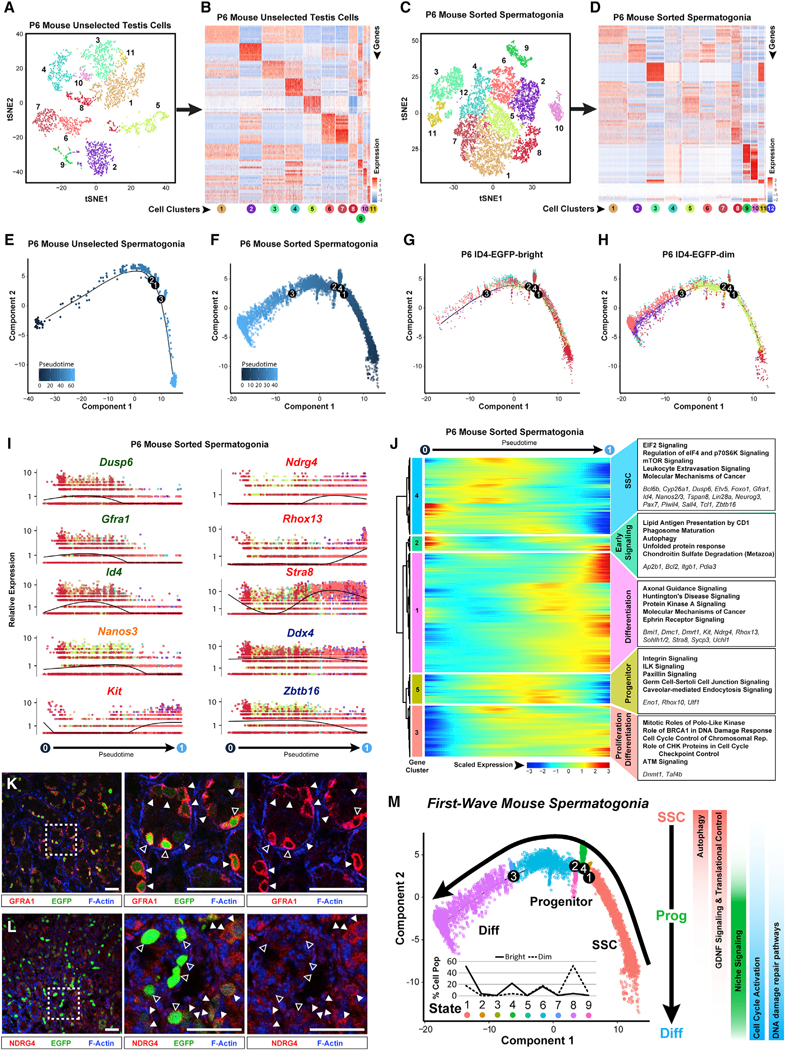
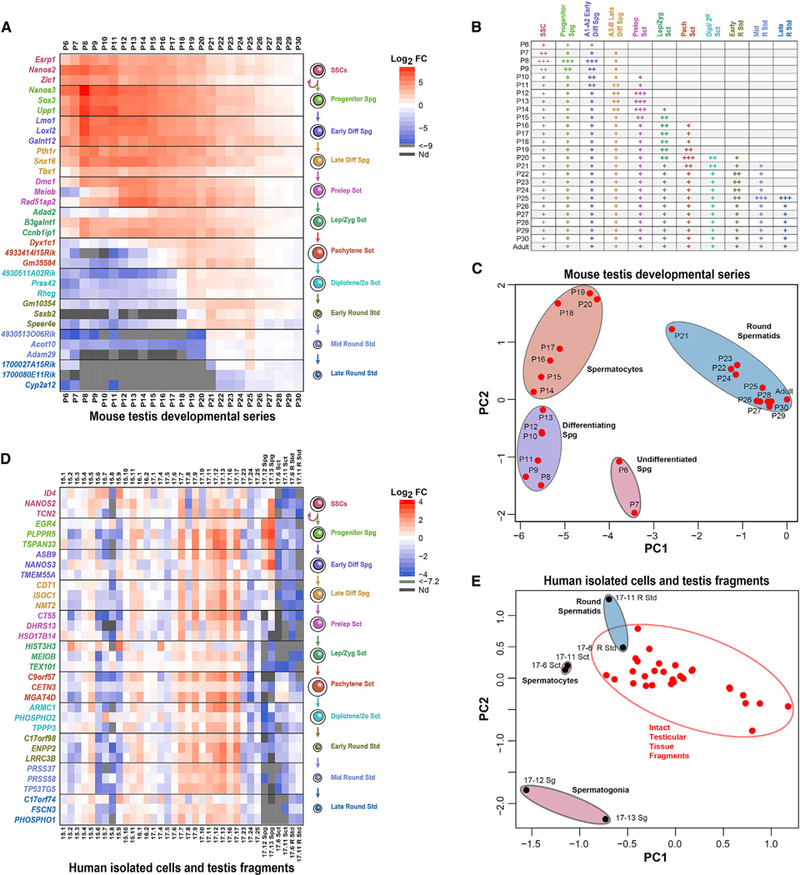
Spermatogenesis is a complex and dynamic cellular differentiation process critical to male reproduction and sustained by spermatogonial stem cells (SSCs). Although patterns of gene expression have been described for aggregates of certain spermatogenic cell types, the full continuum of gene expression patterns underlying ongoing spermatogenesis in steady state was previously unclear. Here, we catalog single-cell transcriptomes for >62,000 individual spermatogenic cells from immature (postnatal day 6) and adult male mice and adult men. This allowed us to resolve SSC and progenitor spermatogonia, elucidate the full range of gene expression changes during male meiosis and spermiogenesis, and derive unique gene expression signatures for multiple mouse and human spermatogenic cell types and/or subtypes. These transcriptome datasets provide an information-rich resource for studies of SSCs, male meiosis, testicular cancer, male infertility, or contraceptive development, as well as a gene expression roadmap to be emulated in efforts to achieve spermatogenesis in vitro.

Keywords: RNA; continuum; heterogeneity; human; male germ cells; meiosis; mouse; spermiogenesis.


Conflict of interest statement

DECLARATION OF INTERESTS

The authors declare no competing interests.

Figures

Figure 1.
Figure 1.. 10x Genomics Profiling of Unselected Adult Mouse and Human Spermatogenic Cells Reveals the Extent of Gene Expression Heterogeneity during Steady-State Spermatogenesis
(A and B) tSNE plots show 10x Genomics profiling of unselected spermatogenic cells from (A) mouse testes and (B) human testes. Unbiased cell clusters are distinguished by color according to the key. (C and D) Heatmaps show the top 10significantly differentially expressed genes (DEGs) between each cell cluster (left) and expression of key cell-type-specific markers (right) for (C) mouse and (D) human spermatogenic cells. Gene lists can be found in Table S1. (E) Identification of cell clusters expressing the noted marker genes allowed clusters to be aligned with specific spermatogenic cell types (*mouse- or human-specific expression patterns).
Figure 2.
Figure 2.. Adult Spermatogonia Are Heterogeneous in Mice and Men
(A and C) Clusters of steady-state spermatogenic cells (Figures 1A and 1B) containing spermatogonia (mouse clusters 10and 16; human clusters 6,7, 8, and 10) were isolated and re-analyzed. tSNE plots show unbiased re-clustering of unselected spermatogonia from (A) mouse or (C) human testes (colors distinguish clusters). (B and D) Heatmaps show the top 10 significantly differentially expressed genes (DEGs) between each cell cluster for (B) mouse and (D) human unselected spermatogonia (circles below heatmaps are colored and numbered by tSNE cluster). Gene lists can be found in Table S1. (E and F) We also profiled sorted spermatogonia from (E) adult Id4-Egfp mouse testes (CD9bright/EGFP+, 1% of unsorted, and CD9bright/EGFPbright or CD9bright/EGFPdim subpopulations, each 0.3% of unsorted) and (F) adult human testes (HLA-ABCnegative, CD49enegative, THY1dim, ITGA6+, and EpCAMdim; ~6.4% of unsorted). Transplant of adult mouse EGFPbright/CD9bright versus EGFPdim/CD9bright spermatogonia shows 7.5-fold greater colonization activity of EGFPbright versus EGFPdim cells (*Student’s t test p < 0.02), demonstrating functional SSC enrichment and depletion, respectively. (G and I) Additional tSNE plots show unbiased clustering of sorted adult spermatogonia from (G) mouse and (I) human testes (colors distinguish clusters). (H and J) Heatmaps show the top 10 significantly DEGs between each cell cluster for sorted (H) mouse and (J) human spermatogonia. (K-R) Pseudotime trajectories of (K-N) unselected and sorted spermatogonia in which cells are ordered from beginning (darkest blue color) to end (lightest blue) according tothe legend or (M), (N), (P), and (R), in which cells are colored asthey appear by cluster in the corresponding tSNE plots. Branch points in the singlecell trajectories are noted by black numbered circles. Spermatogonial clusters included in this trajectory analysis included (K) mouse unselected spermato- gonia—all clusters; (L, O, and P) mouse sorted spermatogonia—clusters 1–3, 5–8,10,11,13, and 14; (M and Q) human unselected spermatogonia—all clusters; and (N and R) human sorted spermatogonia—all clusters. (L, O, and P) For mouse sorted spermatogonia (L) that were analyzed and displayed in pseudotime together, we also retrospectively displayed the two input subpopulations separately from the same pseudotime trajectory in (O) ID4-EGFPbright spermatogonia and (P) ID4-EGFPdim spermatogonia.
Figure 3.
Figure 3.. Single-Cell Spermatogonial Trajectories Reveal Biological Transitions Coinciding with SSC Self-Renewal and Initiation of Differentiation in Pseudotime
(A-D) Expression patterns of key landmark genes over pseudotime among (A) adult mouse unselected spermatogonia, (B) adult mouse sorted spermatogonia. (C) adult human unselected spermatogonia, and (D) adult human sorted spermatogonia. Cells are colored according to the cluster colors in the corresponding tSNE plots(Figures 2A, 2C, 2G, and 2I) and ordered according tothe pseudotime plots (Figures 2K-2N). Pseudotime(scaled,0to 1)is indicated beloweach gene plot column. (E and F) Clusters of genes that were differentially expressed across pseudotime from (E) adult mouse sorted spermatogonial and (F) adult human sorted spermatogonial datasets are shown as heatmaps according to expression color code noted at the bottom (see Table S2). Dendrograms show hierarchical relationship between gene clusters. The top five over-represented biological pathways from Ingenuity Pathway Analysis of each cluster are noted at the right in bold (see Table S3), and key genes are italicized. (G and H) Trajectories (identical to Figures 2L and 2N) from (G) adult mouse sorted spermatogonia and (H) adult human sorted spermatogonia are colored by cell state and illustrate biologicallysignificant differences acrossthistrajectory, which is summarized tothe right ofeach plot. Inset graph in (G) showsthe distribution (percentage) ofthe sorted ID4-EGFPbright spermatogonia and ID4-EGFPdim spermatogonia as shown in Figures 2O and 2P, among the noted five spermatogonial states.
Figure 4.
Figure 4.. Meiotic Progression among Steady-State Spermatocytes Is Characterized by Regulation of Dynamic Metabolic Transitions and Protein Turnover
Clusters of steady-state spermatogenic cellsthat contained spermatocytes (Figure 1 Amouse clusters 6,8,9, and 10; Figure 1B human clusters 7, 9,12, and 14) were extracted and re-analyzed here. (A and C) The tSNE plots show unbiased re-clustering of unselected spermatocytes from (A) mouse testes and (C) human testes, with color distinguishing clusters. (B and D) Heatmaps show the top 10 significantly differentially expressed genes (DEGs) between each cell cluster for (B) mouse and (D) human unselected spermatocytes. Gene lists can be found in Table S1. Colors and numbering of circles below heatmaps match the cell clusters in the corresponding tSNE plot. (E and F) Single-cell transcriptomes from (E) mouse unselected spermatocytes and (F) human unselected spermatocyteswere subsequently used for unbiased dynamic lineage analysis producing cell trajectories ordered in pseudotime (left) and cells colored according to tSNE cell cluster (right). (G and H) Expression levels (vertical axis) of key genes among (G) mouse unselected spermatocytes and (H) human unselected spermatocytes ordered in pseudotime (cell coloring is according to tSNE clusters from A and C, respectively). (I and J) Heatmaps show hierarchical relationship between clusters of genes that were differentially expressed across pseudotime from (I) mouse unselected spermatocytes and (J) human unselected spermatocytes (scaled expression according to legend; see Table S2). The top five over-represented biological pathways from GO analyses of each cluster are noted at the right in bold (see Table S3), and key genes are italicized
Figure 5.
Figure 5.. Dynamic Transcriptome Changes during Spermiogenesis Precede Production of Functional Spermatozoa
Spermatid-containing clustersfrom steady-state spermatogenic cells (Figure 1A, mouse clusters 1,2,3,4,5,7,9,11,12, and 13; Figure 1B, human clusters 1,2,3,4,5, 11, and 13) were extracted and re-analyzed here. (A and C) These unselected spermatids were re-clustered, and the tSNE plots are shown for (A) mouse testes and (C) human testes, with color distinguishing clusters. (B and D) Heatmaps show the top 10 significantly DEGs between each cell cluster for (B) mouse and (D) human unselected spermatids. Gene lists can befound in Table S1. Colors and numbering of circles below heatmaps match the corresponding tSNE plot. (E and F) Single-cell transcriptomes from (E) mouse unselected spermatids and (F) human unselected spermatocytes were subsequently used for unbiased dynamic lineage analysis producing cell trajectories with spermatids ordered in pseudotime (left) and colored according to tSNE cell cluster (right). (G and H) Expression levels (vertical axis) of key genes among (G) mouse unselected spermatids and (H) human unselected spermatids ordered in pseudotime (cell coloring is according to tSNE clusters from A and C, respectively). (I and J) Heatmaps show a hierarchical relationship between clusters of genes that were differentially expressed across pseudotime from (I) mouse unselected spermatidsand (J) human unselected spermatids (scaled expression according to legend; see Table S2). The top five over-represented biological pathways from GO analyses of each gene cluster are noted at the right in bold (see Table S3), and key genes are italicized.
Figure 6.
Figure 6.. Neonatal Mouse Spermatogonia Exhibit Unique Developmental Characteristics during the First Wave of Spermatogenesis
Unselected testis cells (containing a mixture of spermatogonia and testicular somatic cells) and sorted spermatogonia from P6 mouse testes were profiled by 10x Genomics analysis. (A and C) Resulting tSNE plots show unbiased clustering of (A) P6 mouse unselected testiscellsand (C) sorted P6 sorted spermatogonia, with colordistinguishing clusters. (B and D) Heatmaps show the top 10 significantly DEGs between each cell cluster for (B) P6 mouse unselected testis cells and (D) P6 mouse sorted spermatogonia. Gene lists can be found in Table S1. Colors and numbering of circles below heatmaps match the corresponding tSNE plot. (E and F) Clusters of cells containing spermatogonia from (E) unselected P6 mouse testis cells (clutster 5 from A and B) or (F) sorted P6 mouse spermatogonia (clusters 1–9 from C and D) were subsequently used for unbiased dynamic lineage analysis producing cell trajectories with cells ordered in pseudotime. (G and H) Retrospectively, (G) ID4-EGFPbr9ht and (H) ID4-EGFPdim subpopulations contained within the sorted spermatogonia trajectory were displayed on the trajectory in isolation. (I) Expression levels (vertical axis) of key genes among P6 sorted spermatogonia ordered in pseudotime (cell coloring is according to tSNE clusters from C). Similar plots for P6 mouse unselected spermatogonia are shown in Figure S6D. (J) The heatmap shows hierarchical relationship between clusters of genesthat were differentially expressed across pseudotimefrom P6 sorted spermatogonia (scaled expression according to legend; see Table S2). The top five over-represented biological pathways from GO analyses ofeach cluster are noted at the right in bold (see Table S3), and key genes are italicized. (K and L) Red immunostaining for (K) GFRA1 or (L) NDRG4 is shown together with green ID4-EGFP epifluorescence and blue F-actin counterstain (phalloidin) in sections of P6 Id4-Gfp testes (bar represents 50 μm; open arrowheads represent EGFPbright; solid arrowheads represent EGFPdim). (M) The P6 spermatogonial trajectory (identical to Figure 6F) is colored by cell state and illustrates biologically significant differences across pseudotime and significant pathways are summarized to the right. Inset graph shows the distribution (percentage of the sorted ID4-EGFPbright spermatogonia and ID4-EGFPdim spermatogonia) as shown in (G) and (H), among the noted nine spermatogonial states.
Figure 7.
Figure 7.. Validation of Single-Cell Transcriptomes and Derivation of Spermatogenic Cell-type-Specific Gene Expression Signatures
Germ-cell-specific genes that were significantly differentially expressed in pseudotime among spermatogonia, spermatocytes, and spermatids in both mice and men were tested for their ability to recognize specific spermatogenic cell types in complex mixtures using qRT-PCR. (A) Log2 fold change values for qRT-PCR detection of 33 cell-type-specific signature genes in mouse testes at ages P6-P30 (made relative to levels in adult mouse testes). (B) Detection of cell types in mouse testes by postnatal age (+++, robust; ++, moderate; +, detectable). (C) Principal-component analysis (PCA) plot projects the qRT-PCR results from the 33-gene mouse spermatogenic cell gene expression panel. (D) Log2 fold change values for qRT-PCR detection of 33 cell-type-specific signature genes in testis tissue fragments from 29 men or aggregate populations of isolated human spermatogonia, spermatocytes, or spermatids (relative to the gene-specific average from all 29 human tissue fragments). (E) PCA plot of qRT-PCR results from the 33-gene human spermatogenic cell gene expression panel.

Comment in

Similar articles

Cited by

References

    1. Ames K, Da Cunha DS, Gonzalez B, Konta M, Lin F, Shechter G, Starikov L, Wong S, Bulow HE, and Melendez A (2017). A non-cell-autonomous role of BEC-1/BECN1/Beclin1 in coordinating cell-cycle progression and stem cell proliferation during germline development. Curr. Biol. 27, 905–913. - PMC - PubMed
    1. Bellvé AR, Cavicchia JC, Millette CF, O’Brien DA, Bhatnagar YM, and Dym M (1977a). Spermatogenic cells of the prepuberal mouse. Isolation and morphological characterization. J. Cell Biol. 74, 68–85. - PMC - PubMed
    1. Bellvé AR, Millette CF, Bhatnagar YM, and O’Brien DA (1977b). Dissociation of the mouse testis and characterization of isolated spermatogenic cells. J. Histochem. Cytochem. 25, 480–494. - PubMed
    1. Bolcun-Filas E, Bannister LA, Barash A, Schimenti KJ, Hartford SA, Eppig JJ, Handel MA, Shen L, and Schimenti JC (2011). A-MYB (MYBL1) transcription factor is a master regulator of male meiosis. Development 138, 3319–3330. - PMC - PubMed
    1. Busada JT, Chappell VA, Niedenberger BA, Kaye EP, Keiper BD, Hogarth CA, and Geyer CB (2015). Retinoic acid regulates Kit translation during spermatogonial differentiation in the mouse. Dev. Biol. 397, 140–149. - PMC - PubMed

Publication types

MeSH terms