. 2016 May 2;7(5):80.
doi: 10.3390/mi7050080.

High-Resolution Microfluidic Paper-Based Analytical Devices for Sub-Microliter Sample Analysis

Affiliations

High-Resolution Microfluidic Paper-Based Analytical Devices for Sub-Microliter Sample Analysis

Keisuke Tenda et al. Micromachines (Basel). .

Abstract

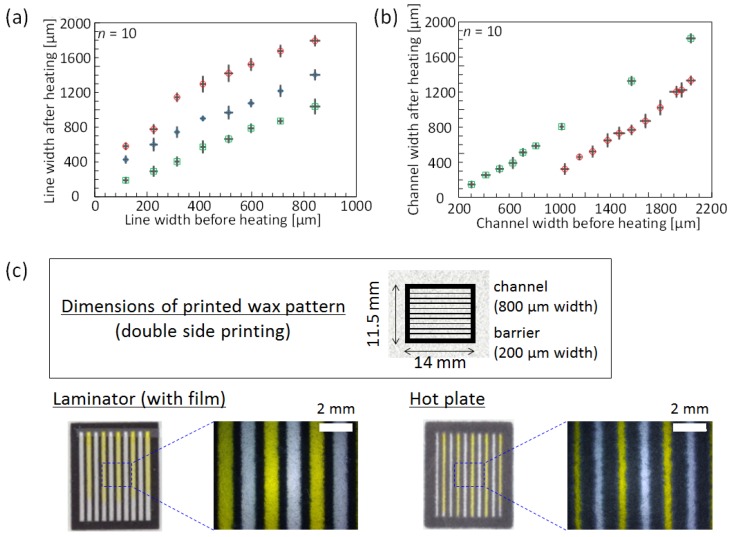
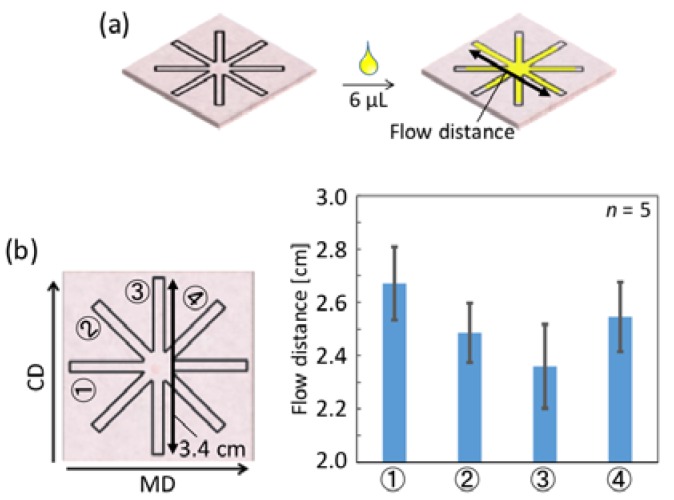
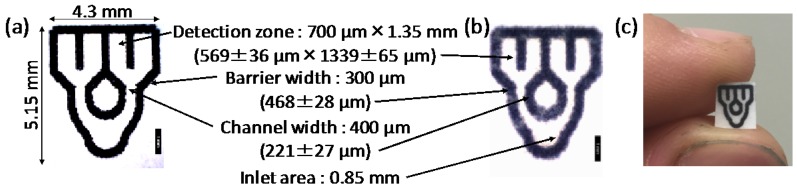
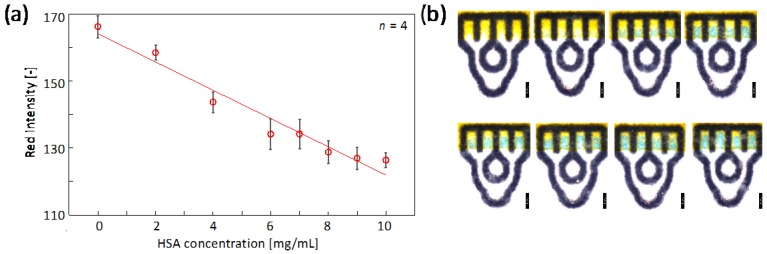
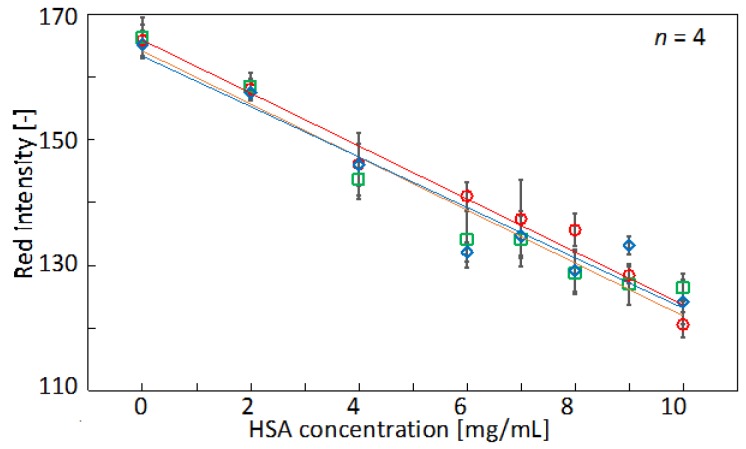
This work demonstrates the fabrication of microfluidic paper-based analytical devices (µPADs) suitable for the analysis of sub-microliter sample volumes. The wax-printing approach widely used for the patterning of paper substrates has been adapted to obtain high-resolution microfluidic structures patterned in filter paper. This has been achieved by replacing the hot plate heating method conventionally used to melt printed wax features into paper by simple hot lamination. This patterning technique, in combination with the consideration of device geometry and the influence of cellulose fiber direction in filter paper, led to a model µPAD design with four microfluidic channels that can be filled with as low as 0.5 µL of liquid. Finally, the application to a colorimetric model assay targeting total protein concentrations is shown. Calibration curves for human serum albumin (HSA) were recorded from sub-microliter samples (0.8 µL), with tolerance against ±0.1 µL variations in the applied liquid volume.

Keywords: colorimetry; inkjet printing; protein assay; wax printing; µPAD.


Conflict of interest statement

The authors declare no conflict of interest.

Figures

Figure 1
Figure 1
Comparison of resolution achieved for melting of printed wax into paper substrates by hot plate or hot lamination. (a) Wax line widths observed directly after printing and after heating with hot plate (red circles), hot laminator without top side lamination (blue diamonds), and hot laminator with full lamination (green squares) (mean value ± 1σ); (b) Microfluidic channel widths after heating by hot plate (red circles) or hot laminator with full lamination (green squares) (mean value ± 1σ); (c) Dimensions and photographs of 10 parallel microfluidic channels after lamination or hot plate (150 °C for 15 s) treatment. Channels visualized by application of colored aqueous solution.
Figure 2
Figure 2
(a) Schematic representation of the evaluation of the influence of cellulose fiber direction on sample wicking in patterned filter paper (channel width: 553 ± 31 µm (n = 20) after lamination). The flow distances are measured as indicated by the arrow; (b) Quantitative results averaged for 5 independently fabricated devices (mean value ± 1σ). Circled numbers indicate the respective flow direction.
Figure 3
Figure 3
Schematic of the experimental method used to evaluate the minimally required wax barrier width. The indicated dimensions (x = 200–350 µm) refer to the values set for wax printing and do not represent the actual dimensions obtained after hot lamination.
Figure 4
Figure 4
Schematic of the experimental method used to evaluate the minimally required width of microfluidic channels aligned to the cellulose fiber direction in the filter paper. The indicated dimensions refer to the values set for wax printing and do not represent the actual dimensions obtained after hot lamination.
Figure 5
Figure 5
Micrographs of a wax-printed microfluidic paper-based analytical device (µPAD): (a) before and (b) after hot lamination. The scale bars correspond to a length of 1 mm. Dimensions are indicated before and after hot lamination (values in parentheses). (c) Corresponding photograph.
Figure 6
Figure 6
Colorimetric human serum albumin (HSA) analysis through the application of 0.8 µL of sample liquid to an optimized µPAD. (a) Calibration curve with data plots and error bars representing mean red intensities and corresponding standard deviations extracted from the four detection zones (parameters of regression line shown in Table 4); (b) Micrographs of µPADs after application of 0, 2, 4, 6, 7, 8, 9, and 10 mg/mL HSA (from upper left to lower right). The scale bars correspond to a length of 1 mm (brightness and contrast adjusted for improved visibility).
Figure 7
Figure 7
Calibration curves for HSA obtained with variable sample volumes: 0.7 µL (red circles), 0.8 µL (green squares), and 0.9 µL (blue diamonds). Data plots and error bars represent mean red intensities and corresponding standard deviations extracted from four detection zones (parameters of regression lines shown in Table 4).

References

    1. Xia Y., Si J., Li Z. Fabrication techniques for microfluidic paper-based analytical devices and their applications for biological testing: A review. Biosens. Bioelectron. 2016;77:774–789. doi: 10.1016/j.bios.2015.10.032. - DOI - PubMed
    1. Cate D.M., Adkins J.A., Mettakoonpitak J., Henry C.S. Recent Developments in Paper-Based Microfluidic Devices. Anal. Chem. 2015;87:19–41. doi: 10.1021/ac503968p. - DOI - PubMed
    1. Yamada K., Henares T.G., Suzuki K., Citterio D. Paper-Based Inkjet-Printed Microfluidic Analytical Devices. Angew. Chem. Int. Ed. 2015;54:5294–5310. doi: 10.1002/anie.201411508. - DOI - PubMed
    1. He Y., Wu Y., Fu J.-Z., Wu W.-B. Fabrication of paper-based microfluidic analysis devices: A review. RSC Adv. 2015;5:78109–78127. doi: 10.1039/C5RA09188H. - DOI
    1. Ahmed S., Bui M.-P.N., Abbas A. Paper-based chemical and biological sensors: Engineering aspects. Biosens. Bioelectron. 2016;77:249–263. doi: 10.1016/j.bios.2015.09.038. - DOI - PubMed

LinkOut - more resources