

Differential effects of coconut versus soy oil on gut microbiota composition and predicted metabolic function in adult mice
- PMID: 30404613
- PMCID: PMC6223047
- DOI: 10.1186/s12864-018-5202-z
Differential effects of coconut versus soy oil on gut microbiota composition and predicted metabolic function in adult mice
Abstract
Background: Animal studies show that high fat (HF) diet-induced gut microbiota contributes to the development of obesity. Oil composition of high-fat diet affects metabolic inflammation differently with deleterious effects by saturated fat. The aim of the present study was to examine the diversity and metabolic capacity of the cecal bacterial community in C57BL/6 N mice administered two different diets, enriched respectively with coconut oil (HFC, high in saturated fat) or soy oil (HFS, high in polyunsaturated fat). The relative impact of each hypercaloric diet was evaluated after 2 and 8 weeks of feeding, and compared with that of a low-fat, control diet (LF).
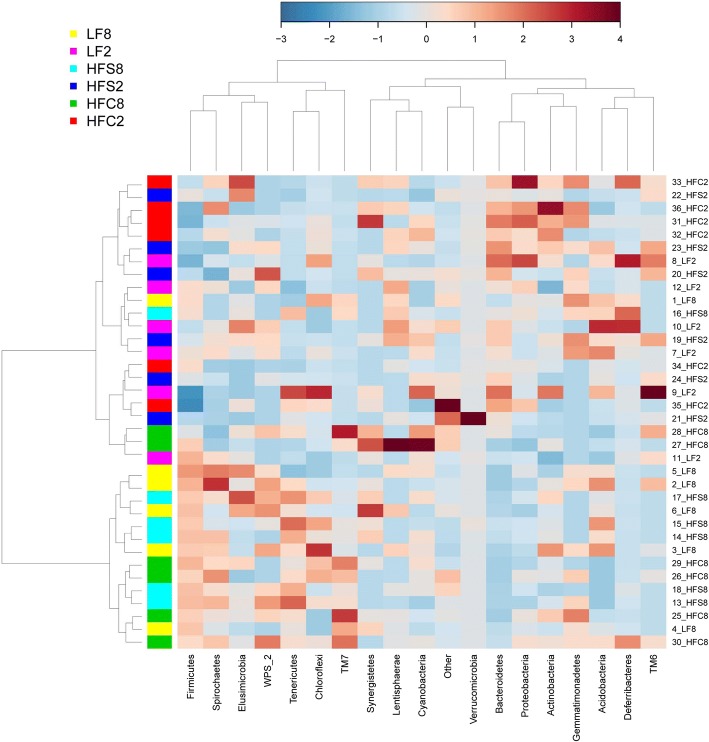
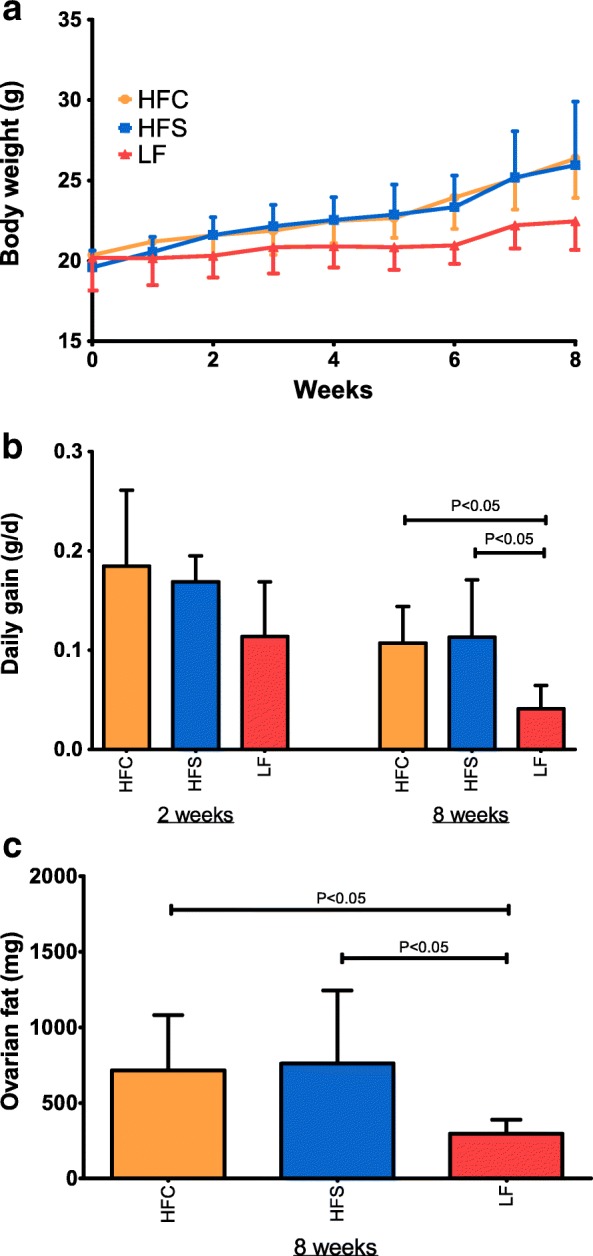
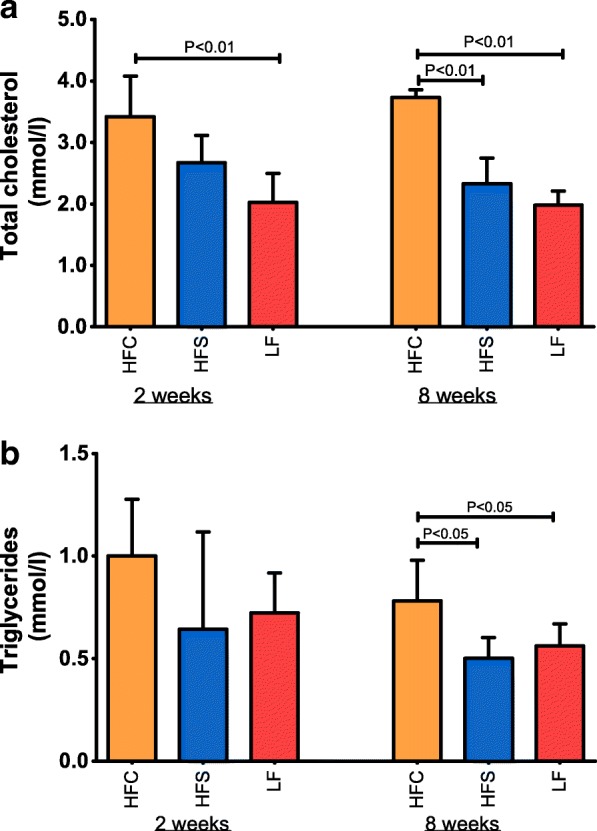
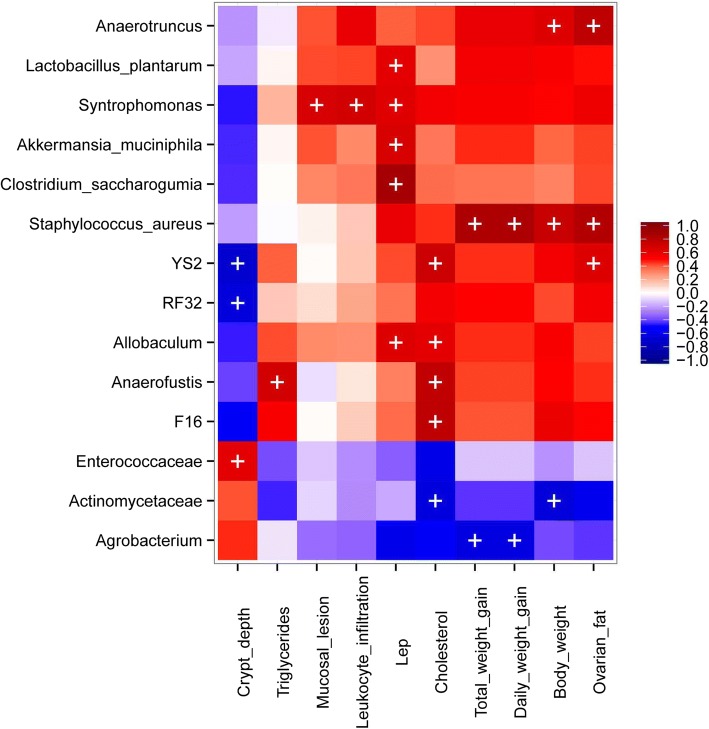
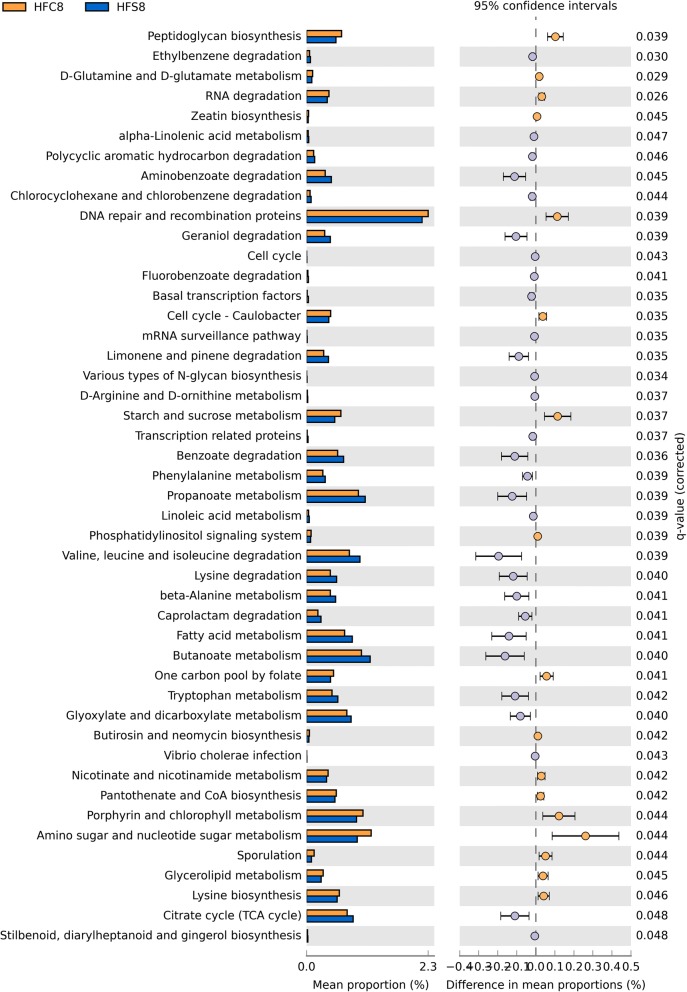
Results: The HFC diet induced the same body weight gain and fat storage as the HFS diet, but produced higher plasma cholesterol levels after 8 weeks of treatment. At the same time point, the cecal microbiota of HFC diet-fed mice was characterized by an increased relative abundance of Allobaculum, Anaerofustis, F16, Lactobacillus reuteri and Deltaproteobacteria, and a decreased relative abundance of Akkermansia muciniphila compared to HFS mice. Comparison of cecal microbiota of high-fat fed mice versus control mice indicated major changes that were shared between the HFC and the HFS diet, including the increase in Lactobacillus plantarum, Lutispora, and Syntrophomonas, while some other shifts were specifically associated to either coconut or soy oil. Prediction of bacterial gene functions showed that the cecal microbiota of HFC mice was depleted of pathways involved in fatty acid metabolism, amino acid metabolism, xenobiotic degradation and metabolism of terpenoids and polyketides compared to mice on HFS diet. Correlation analysis revealed remarkable relationships between compositional changes in the cecal microbiota and alterations in the metabolic and transcriptomic phenotypes of high-fat fed mice.
Conclusions: The study highlights significant differences in cecal microbiota composition and predictive functions of mice consuming a diet enriched in coconut vs soy oil. The correlations established between specific bacterial taxa and various traits linked to host lipid metabolism and energy storage give insights into the role and functioning of the gut microbiota that may contribute to diet-induced metabolic disorders.
Keywords: 16S rDNA; Adipose tissue; High-fat diet; Illumina sequencing; Microbiota; Mouse; Obesity; Real-time PCR.
Conflict of interest statement
Ethics approval and consent to participate
All animal manipulations were performed according to the Italian regulations (Ministerial Decree 116/92) and EU guidelines. The experimental protocol was approved by the Veterinarian Bureau of the Italian Ministry of Health.
Consent for publication
Not applicable.
Competing interests
The authors declare that they have no competing interests.
Publisher’s Note
Springer Nature remains neutral with regard to jurisdictional claims in published maps and institutional affiliations.
Figures


Similar articles
-
Dietary fat and gut microbiota interactions determine diet-induced obesity in mice.Mol Metab. 2016 Oct 13;5(12):1162-1174. doi: 10.1016/j.molmet.2016.10.001. eCollection 2016 Dec. Mol Metab. 2016. PMID: 27900259 Free PMC article.
-
The gut microbiota drives the impact of bile acids and fat source in diet on mouse metabolism.Microbiome. 2018 Aug 2;6(1):134. doi: 10.1186/s40168-018-0510-8. Microbiome. 2018. PMID: 30071904 Free PMC article.
-
Short Term High Fat Diet Induces Obesity-Enhancing Changes in Mouse Gut Microbiota That are Partially Reversed by Cessation of the High Fat Diet.Lipids. 2017 Jun;52(6):499-511. doi: 10.1007/s11745-017-4253-2. Epub 2017 Apr 20. Lipids. 2017. PMID: 28429150
-
N-3 polyunsaturated fatty acids: An innovative strategy against obesity and related metabolic disorders, intestinal alteration and gut microbiota dysbiosis.Biochimie. 2019 Apr;159:66-71. doi: 10.1016/j.biochi.2019.01.017. Epub 2019 Jan 25. Biochimie. 2019. PMID: 30690133 Review.
-
Effects of gut microbiota-derived extracellular vesicles on obesity and diabetes and their potential modulation through diet.J Physiol Biochem. 2022 May;78(2):485-499. doi: 10.1007/s13105-021-00837-6. Epub 2021 Sep 2. J Physiol Biochem. 2022. PMID: 34472032 Free PMC article. Review.
Cited by
-
High-dose saccharin supplementation does not induce gut microbiota changes or glucose intolerance in healthy humans and mice.Microbiome. 2021 Jan 12;9(1):11. doi: 10.1186/s40168-020-00976-w. Microbiome. 2021. PMID: 33431052 Free PMC article. Clinical Trial.
-
Diet and the Microbiota-Gut-Brain Axis: Sowing the Seeds of Good Mental Health.Adv Nutr. 2021 Jul 30;12(4):1239-1285. doi: 10.1093/advances/nmaa181. Adv Nutr. 2021. PMID: 33693453 Free PMC article. Review.
-
Implications of Tributyrin on Gut Microbiota Shifts Related to Performances of Weaning Piglets.Microorganisms. 2021 Mar 12;9(3):584. doi: 10.3390/microorganisms9030584. Microorganisms. 2021. PMID: 33809105 Free PMC article.
-
Chewing the Fat with Microbes: Lipid Crosstalk in the Gut.Nutrients. 2022 Jan 28;14(3):573. doi: 10.3390/nu14030573. Nutrients. 2022. PMID: 35276931 Free PMC article. Review.
-
Spotlight on Icosapent Ethyl for Cardiovascular Risk Reduction: Evidence to Date.Vasc Health Risk Manag. 2020 Jan 9;16:1-10. doi: 10.2147/VHRM.S210149. eCollection 2020. Vasc Health Risk Manag. 2020. PMID: 32021223 Free PMC article. Review.
References
MeSH terms
Substances
LinkOut - more resources
Full Text Sources
Molecular Biology Databases
Research Materials
Miscellaneous
