

Systematic review and meta-analysis of diagnostic accuracy of detection of any level of diabetic retinopathy using digital retinal imaging
- PMID: 30404665
- PMCID: PMC6222985
- DOI: 10.1186/s13643-018-0846-y
Systematic review and meta-analysis of diagnostic accuracy of detection of any level of diabetic retinopathy using digital retinal imaging
Erratum in
-
Correction to: Systematic review and meta-analysis of diagnostic accuracy of detection of any level of diabetic retinopathy using digital retinal imaging.Syst Rev. 2019 Apr 30;8(1):106. doi: 10.1186/s13643-019-1023-7. Syst Rev. 2019. PMID: 31039817 Free PMC article.
Abstract
Background: Visual impairment from diabetic retinopathy (DR) is an increasing global public health concern, which is preventable with screening and early treatment. Digital retinal imaging has become a preferred choice as it enables higher coverage of screening. The aim of this review is to evaluate how different characteristics of the DR screening (DRS) test impact on diagnostic test accuracy (DTA) and its relevance to a low-income setting.
Methods: We conducted a systematic literature search to identify clinic-based studies on DRS using digital retinal imaging of people with DM (PwDM). Summary estimates of different sub-groups were calculated using DTA values weighted according to the sample size. The DTA of each screening method was derived after exclusion of ungradable images and considering the eye as the unit of analysis. The meta-analysis included studies which measured DTA of detecting any level of DR. We also examined the effect on detection from using different combinations of retinal fields, pupil status, index test graders and setting.
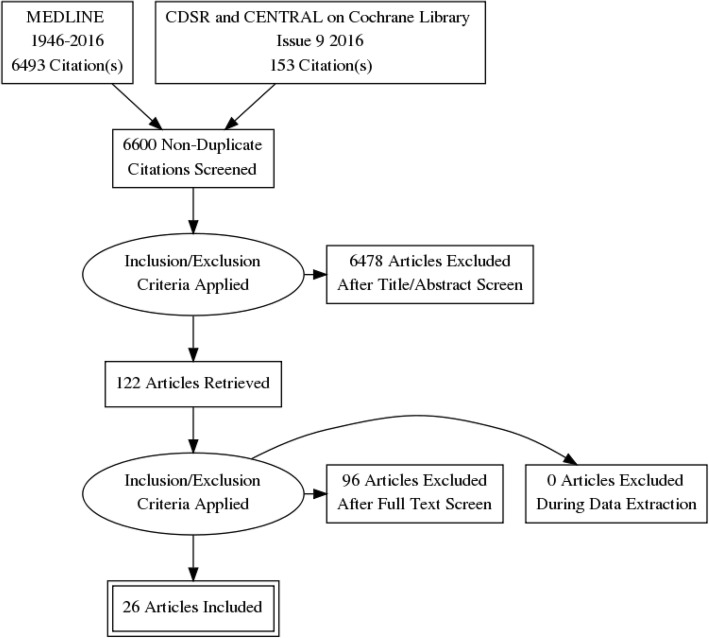
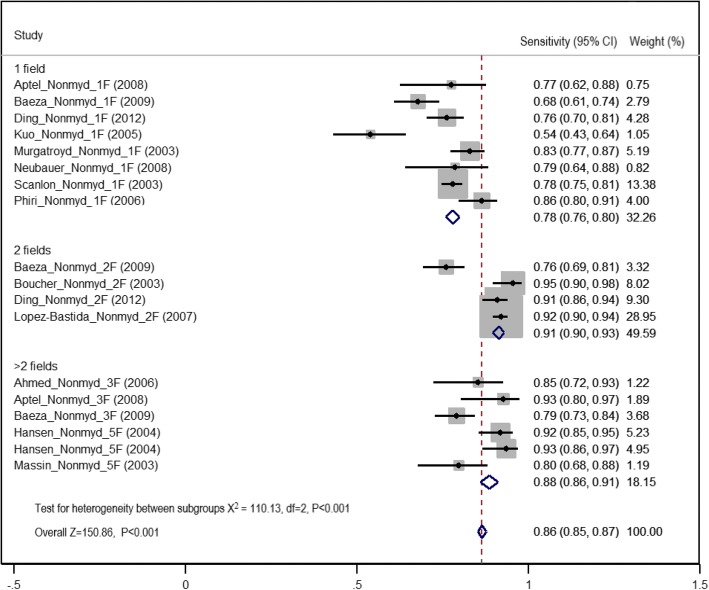
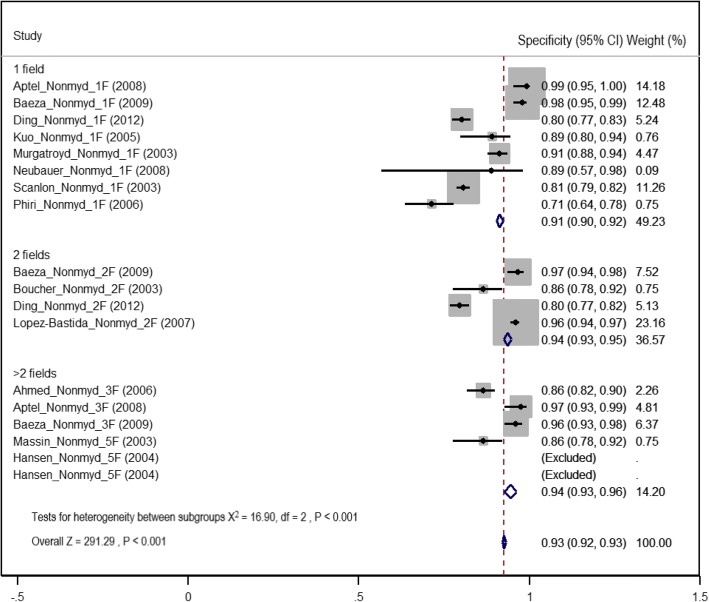
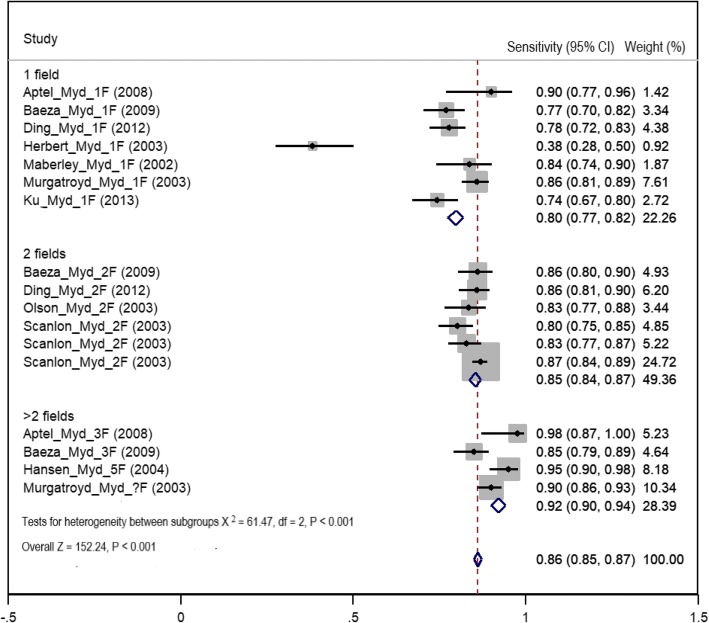
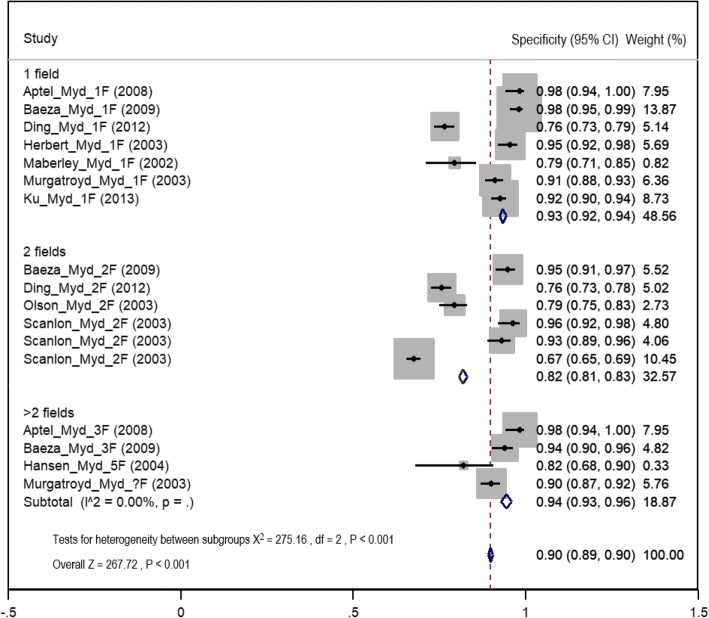
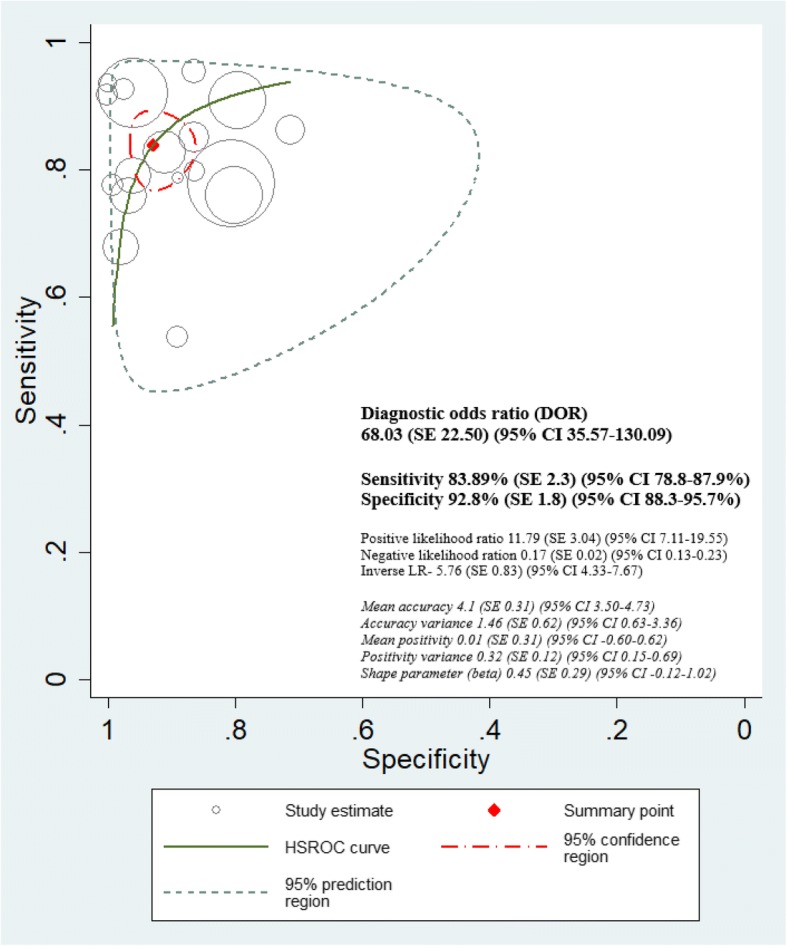
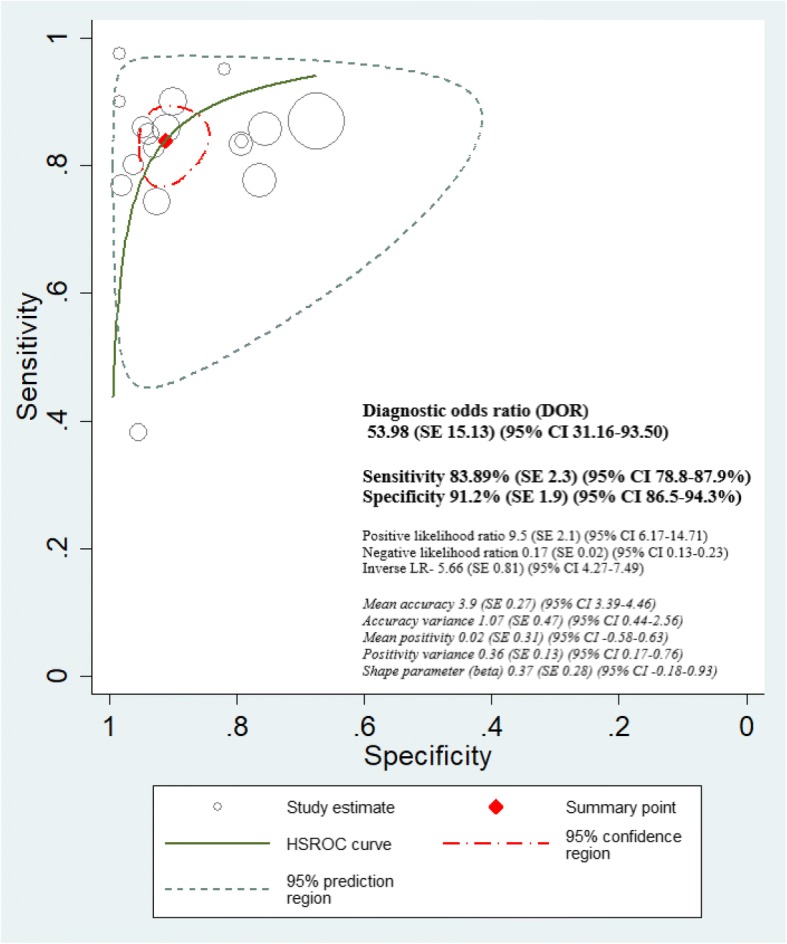
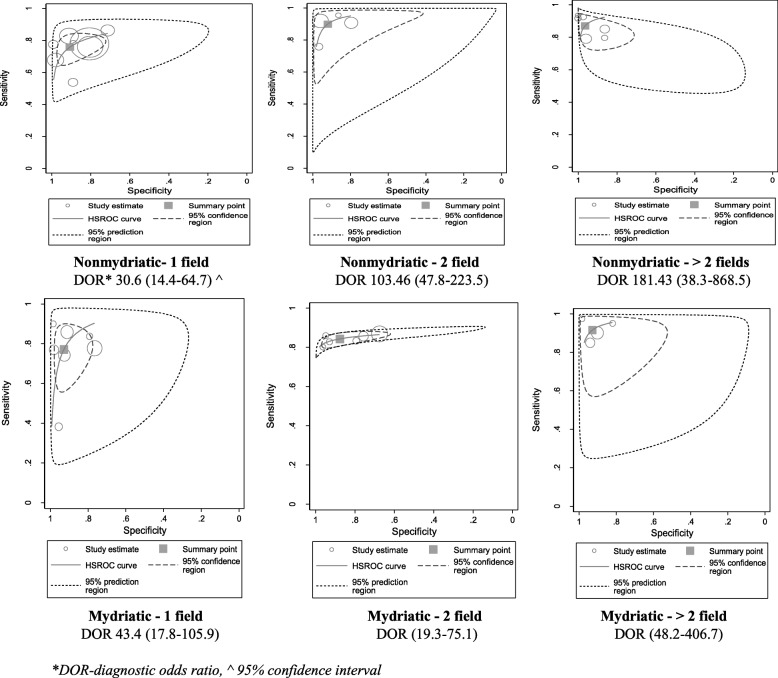
Results: Six thousand six hundred forty-six titles and abstracts were retrieved, and data were extracted from 122 potentially eligible full reports. Twenty-six studies were included in the review, and 21 studies, mostly from high-income settings (18/21, 85.7%), were included in the meta-analysis. The highest sensitivity was observed in the mydriatic greater than two field strategy (92%, 95% CI 90-94%). The highest specificity was observed in greater than two field methods (94%, 95% CI 93-96%) where mydriasis did not affect specificity. Overall, there was no difference in sensitivity between non-mydriatic and mydriatic methods (86%, 95% CI 85-87) after exclusion of ungradable images. The highest DTA (sensitivity 90%, 95% CI 88-91%; specificity 95%, 95% CI 94-96%) was observed when screening was delivered at secondary/tertiary level clinics.
Conclusions: Non-mydriatic two-field strategy could be a more pragmatic approach in starting DRS programmes for facility-based PwDM in low-income settings, with dilatation of the pupils of those who have ungradable images. There was insufficient evidence in primary studies to draw firm conclusions on how graders' background influences DTA. Conducting more context-specific DRS validation studies in low-income and non-ophthalmic settings can be recommended.
Keywords: Diabetes mellitus; Diabetic retinopathy; Diagnostic test accuracy; Digital imaging; Low income; Mydriatic; Non-mydriatic; Screening.
Conflict of interest statement
Ethics approval and consent to participate
Ethics approval was obtained from Research Ethics Committee of London School of Hygiene and Tropical Medicine, UK.
Consent for publication
The authors provided an approval for publication in BMC Systematic Review.
Competing interests
The authors declare that they have no competing interests.
Publisher’s Note
Springer Nature remains neutral with regard to jurisdictional claims in published maps and institutional affiliations.
Figures
References
-
- Diabetes - International Diabetes Federation. 2017. http://www.idf.org/idf-diabetes-atlas-seventh-edition. Accessed 10 Jan 2018. - PubMed
-
- Klein Ronald, Klein Barbara E.K. Retina. 2013. The Epidemiology of Diabetic Retinopathy; pp. 907–924.
Publication types
MeSH terms
Substances
Grants and funding
LinkOut - more resources
Full Text Sources
Medical
