. 2018 Dec 3;215(12):3094-3114.
doi: 10.1084/jem.20180570. Epub 2018 Nov 7.

PRC2 loss induces chemoresistance by repressing apoptosis in T cell acute lymphoblastic leukemia

Affiliations

PRC2 loss induces chemoresistance by repressing apoptosis in T cell acute lymphoblastic leukemia

Ingrid M Ariës et al. J Exp Med. .

Abstract

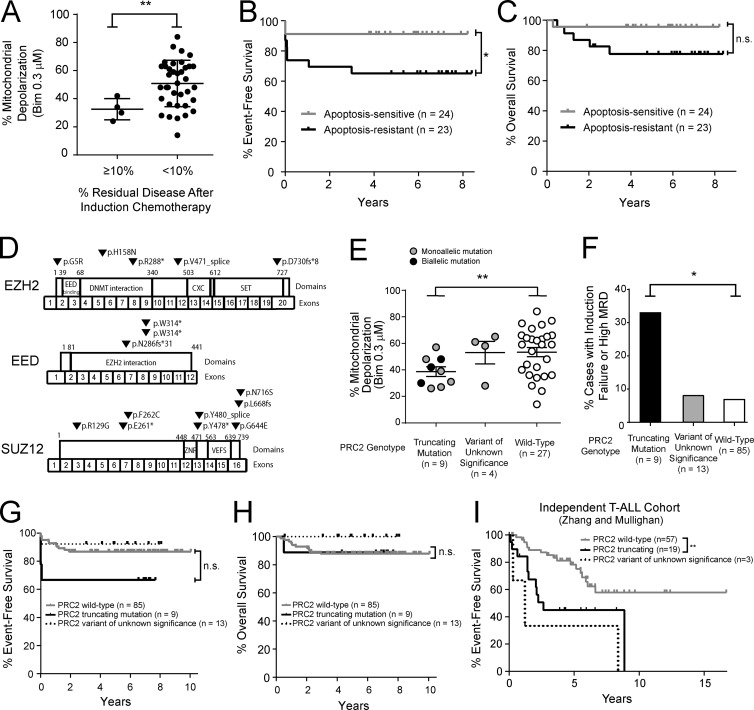
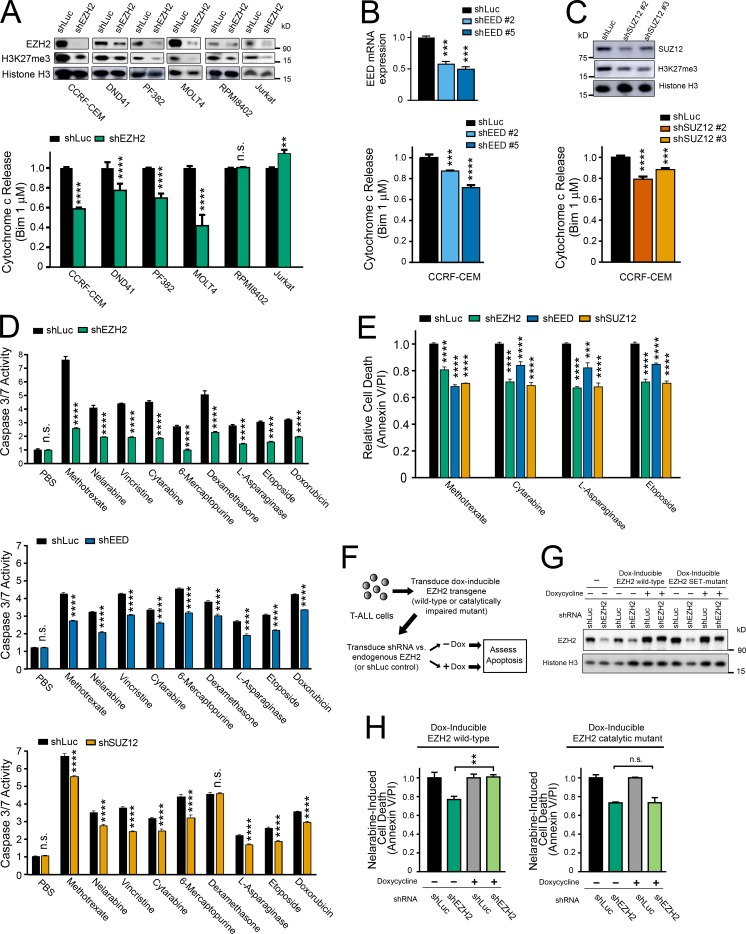
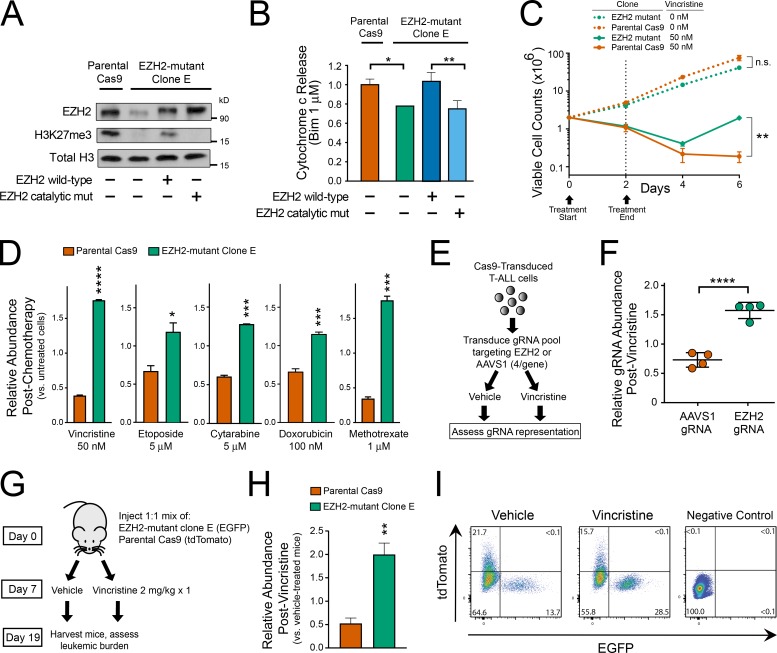
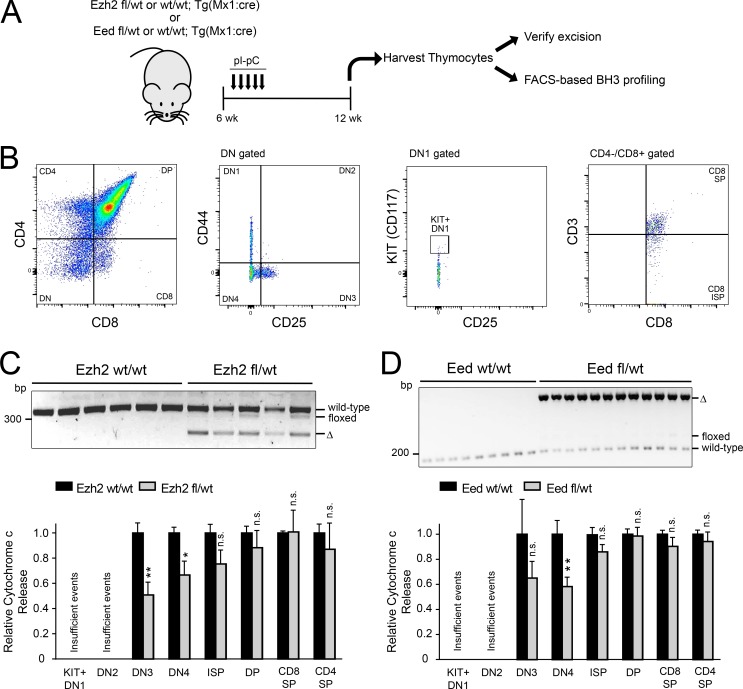
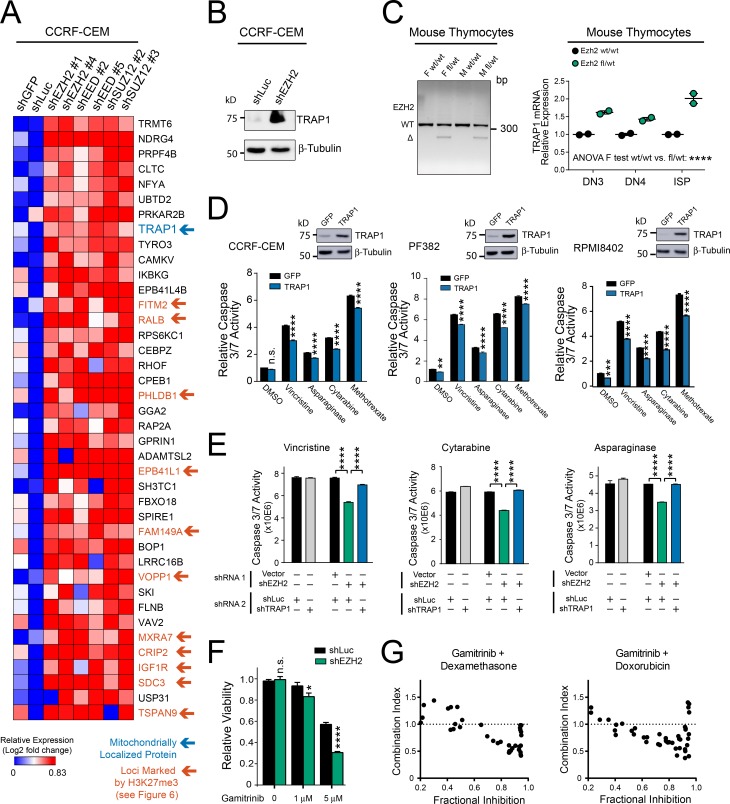
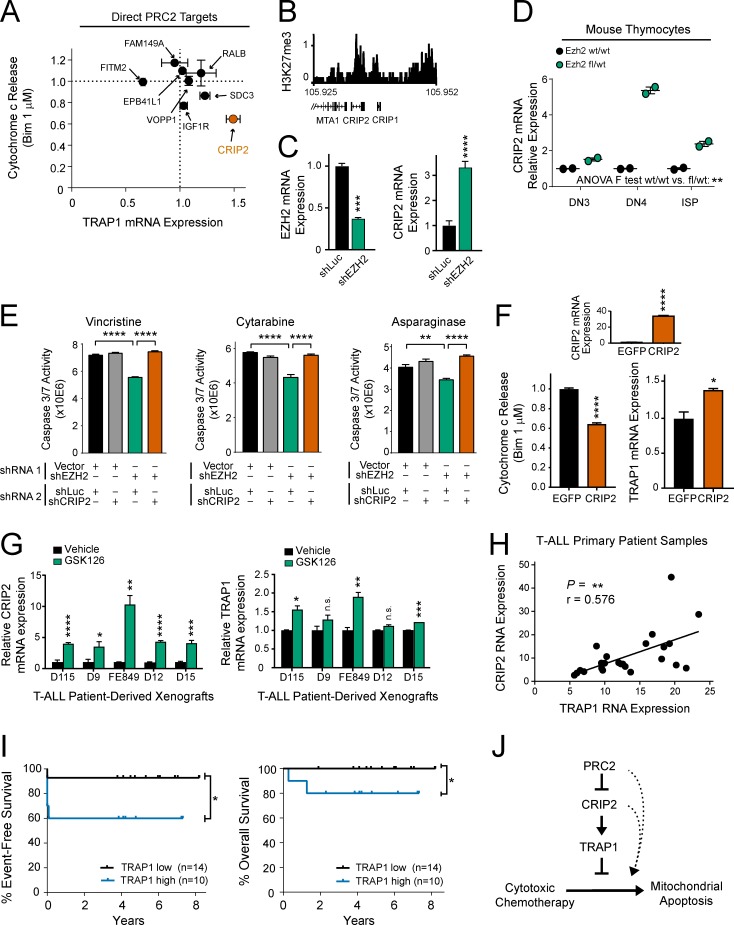
The tendency of mitochondria to undergo or resist BCL2-controlled apoptosis (so-called mitochondrial priming) is a powerful predictor of response to cytotoxic chemotherapy. Fully exploiting this finding will require unraveling the molecular genetics underlying phenotypic variability in mitochondrial priming. Here, we report that mitochondrial apoptosis resistance in T cell acute lymphoblastic leukemia (T-ALL) is mediated by inactivation of polycomb repressive complex 2 (PRC2). In T-ALL clinical specimens, loss-of-function mutations of PRC2 core components (EZH2, EED, or SUZ12) were associated with mitochondrial apoptosis resistance. In T-ALL cells, PRC2 depletion induced resistance to apoptosis induction by multiple chemotherapeutics with distinct mechanisms of action. PRC2 loss induced apoptosis resistance via transcriptional up-regulation of the LIM domain transcription factor CRIP2 and downstream up-regulation of the mitochondrial chaperone TRAP1 These findings demonstrate the importance of mitochondrial apoptotic priming as a prognostic factor in T-ALL and implicate mitochondrial chaperone function as a molecular determinant of chemotherapy response.


Figures

Figure 1.
Figure 1.
PRC2 mutations are associated with resistance to mitochondrial apoptosis in human T-ALL. (A) T-ALL blasts were collected before the initiation of chemotherapy from children treated on DFCI 05001 or COG AALL0434 clinical trials, and BH3 profiling analysis was performed to assess mitochondrial apoptotic priming, based on the degree of mitochondrial depolarization in response to 0.3 µM BIM peptide. Results were compared with the degree of residual leukemia in the bone marrow following the initial induction phase of combination chemotherapy. P = 0.008 by Welch t test. Number of samples per group: MRD ≥ 10%, n = 4; MRD < 10%, n = 37. Each data point represents percent mitochondrial depolarization in an independent patient sample. (B and C) Comparison of event-free survival (P = 0.0376 by log-rank test; B) and overall survival (P = 0.091 by log-rank test; C) among T-ALL cases classified as apoptosis sensitive or resistant based on whether mitochondrial depolarization was above or below the mean. Number of samples per group: apoptosis sensitive, n = 24; apoptosis resistant, n = 23. (D) Targeted exome sequencing and array CGH revealed mutations or deletions of EZH2, EED, or SUZ12 in 13 of 40 T-ALL cases analyzed by both BH3 profiling and sequencing analysis. (E) Association of PRC2 genotype with percent mitochondrial depolarization by BH3 profiling in primary T-ALL patient samples. Truncating mutations were defined as stop or frameshift mutations predicted to result in premature termination of translation or deletions identified by array CGH analysis. Variants of unknown significance are missense substitutions or splice region variants of unknown functional consequence. Each data point represents percent mitochondrial depolarization in an independent patient sample. Color of each circle reflects the allelic nature of the mutation in each sample (blank circle, WT); cases with two distinct heterozygous mutations of the same gene were presumed to have biallelic mutations. P = 0.007 by Welch t test for truncating mutations versus WT cases. The significance of other comparisons was not assessed. Number of samples per group: truncating mutation, n = 9; variant of unknown significance, n = 4; WT, n = 27. (F) Association of PRC2 mutation type with resistance to induction chemotherapy. P = 0.040 by Welch t test for truncating mutations versus WT cases. The significance of other comparisons was not assessed. Number of samples per group: truncating mutation, n = 9; variant of unknown significance, n = 13; WT, n = 85. (G and H) Comparison of event-free survival (P = 0.09 by log-rank test; G) and overall survival (P = 0.87 by log-rank test; H) among T-ALL cases by PRC2 mutation type. Note that the data shown in F–H include T-ALL cases analyzed by BH3 profiling and genomic analyses shown in A–E, as well as an additional cohort of T-ALL cases subjected to sequencing analysis only, on which BH3 profiling data were not available (see Table S1). Number of samples per group: WT, n = 85; truncating mutations, n = 9; variant of unknown significance, n = 13. (I) Validation of the association of PRC2 mutations with outcome in an independent cohort of T-ALL cases treated on St. Jude or Associazione Italiana di Ematologia e Oncologia Pediatrica clinical trials and subjected to sequencing and copy number analyses, as described (Zhang et al., 2012). P = 0.002 by log-rank test. Number of samples per group: WT, n = 57; truncating mutations, n = 19; variant of unknown significance, n = 3. *, P ≤ 0.05; **, P ≤ 0.01; n.s., P > 0.05.
Figure 2.
Figure 2.
PRC2 depletion induces resistance to chemotherapy-induced apoptosis in human T-ALL. (A) The indicated human T-ALL cell lines were transduced with shRNA targeting EZH2 or Luciferase control, and knockdown efficacy was assessed using Western blot analysis (top). FACS-based BH3 profiling was then performed to assess the degree of cytochrome c release following treatment with 1 µM BIM peptide for 30 min (bottom). BH3 profiling results were normalized to shLuc control for each cell line. P < 0.0001 for CCRF-CEM, P < 0.0001 for DND41, P < 0.0001 for PF382, P < 0.001 for MOLT4, P = 0.99 for RPMI8402, and P = 0.003 for Jurkat, as assessed using two-way ANOVA with a Sidak adjustment for multiple comparisons between shLuc and shEZH2 only for each cell line. (B and C) CCRF-CEM cells were transduced with shRNAs targeting EED, SUZ12, or Luciferase control, and knockdown efficacy was assessed using quantitative reverse transcription PCR (B, top) or Western blot analysis (C, top). BH3 profiling was then performed as in (A, bottom). Significance was assessed by one-way ANOVA with Tukey adjustment for multiple comparisons. P values for shLuc versus shEED no. 2 = 0.0012 and shLuc versus shEED no. 5 = 0.0004 in B; P values for shLuc versus shSUZ12 no. 2 < 0.0001; shLuc versus shSUZ12 no. 3 = 0.0009 in C. (D) CCRF-CEM cells were transduced with shRNAs targeting EZH2, EED, SUZ12, or Luciferase control, treated with vehicle (PBS) or each of the indicated chemotherapeutic agents, and apoptosis induction was assessed by caspase 3/7 activity assay. Results were normalized to vehicle-treated shLuc cells. Significance was assessed by two-way ANOVA with a Sidak adjustment for multiple comparisons between control or PRC2-targeting shRNA only for each drug. For shLuc versus shEZH2, P = 1.00 for PBS and < 0.0001 for all other drugs; for shLuc versus shEED, P = 0.99 for PBS and < 0.0001 for all other drugs; for shLuc versus shSUZ12, P = 0.98 for PBS, P = 0.54 for dexamethasone, and P < 0.0001 for all other drugs. (E) CCRF-CEM cells were transduced with the indicated shRNAs, treated with the indicated chemotherapeutic drugs, and cell death was assessed using annexin V and propidium iodide staining. Significance was assessed by two-way ANOVA with a Sidak adjustment for multiple comparison between shRNAs only for each drug. For all comparisons, P < 0.0001 except P = 0.0007 for shLuc versus shEED in asparaginase-treated conditions. (F) Schema of experimental design to rescue shEZH2-induced resistance to chemotherapy-induced apoptosis using doxycycline-inducible transgenes encoding WT EZH2, or a catalytically defective triple mutant of EZH2. The EZH2 shRNA used targets the 3′UTR of the endogenous gene, which is not present in the EZH2 transgenes used for rescue. (G) CCRF-CEM cells manipulated as shown in F were subjected to Western blot analysis for the indicated proteins. (H) CCRF-CEM cells experimentally manipulated as shown in F were treated with nelarabine for 48 h, and induction of apoptosis was assessed by caspase 3/7 activity assay. Significance was assessed by one-way ANOVA with Tukey adjustment for multiple comparisons. P = 0.01 for shEZH2 –dox versus shEZH2 +dox in cells transduced with doxycycline-inducible WT EZH2; P = 1.00 for shEZH2 −dox versus shEZH2 +dox in cells transduced with doxycycline-inducible mutant EZH2. All bar charts represent the mean ± SEM of at least n = 3 biological replicates from one representative experiment, and each experiment was repeated independently at least twice. *, P ≤ 0.05; **, P ≤ 0.01; ***, P ≤ 0.001; ****, P ≤ 0.0001; n.s., P > 0.05.
Figure 3.
Figure 3.
EZH2 depletion induces chemotherapy resistance in T-ALL. (A) CCRF-CEM cells were transduced with Cas9 and EZH2 targeting gRNA, single-cell cloned, and next-generation sequencing was used to identify a clone with EZH2 haploinsufficiency (EZH2 mutant clone E). Western blot analysis was performed to assess expression of the indicated proteins in basal conditions or following transduction with doxycycline-induced constructs encoding WT EZH2 or a catalytically defective triple mutant. One representative experiment is shown, which was repeated independently. (B) BH3 profiling was performed on the cells shown in A. Results shown are the mean ± SEM of n = 3 biological replicates. Significance was assessed by one-way ANOVA with Tukey adjustment for multiple comparisons. P = 0.017 for parental Cas9 versus EZH2 mutant clone; P = 0.004 for clone E transduced with EZH2 WT versus EZH2 catalytic mutant. Bar charts represent the mean of three biological replicates, and the experiment was repeated independently. (C) EZH2 mutant clone E cells or their parental Cas9 controls were treated with the indicated doses of vincristine for 48 h and then released from chemotherapy. Viable cell counts were obtained by trypan blue exclusion at the indicated time points. Significance assessed by Welch t test (P = 0.07 for untreated EZH2 mutant versus untreated parental Cas9; P = 0.006 for vincristine-treated EZH2 mutant versus vincristine-treated parental Cas9). Results shown are the mean ± SEM of n = 3 biological replicates. Representative data of at least two independent experiments shown. (D) EGFP-transduced EZH2 mutant clone E cells were mixed at 1:1 ratio with tdTomato-transduced parental Cas9 controls. The resultant pool of cells was treated with vehicle control or the indicated chemotherapeutics for 48 h and subsequently released from chemotherapy. Relative abundance of each clone was assessed by flow cytometry analysis 4 d after chemotherapy release. Results are normalized to the abundance of each clone in nonchemotherapy-treated controls. Significance assessed by Welch t test, with P < 0.0001 for vincristine, P = 0.0281 for etoposide, P = 0.0003 for cytarabine, P = 0.0008 for doxorubicin, and P = 0.0004 for methotrexate. Results shown are the mean ± SEM of n = 3 biological replicates, and the experiment was repeated independently. (E) Experimental design to assess relative fitness of CCRF-CEM cells transduced with gRNAs targeting the catalytic domain of EZH2, or the AAVS1 safe-harbor genomic locus, in control or chemotherapy-treated conditions. (F) CCRF-CEM cells manipulated as shown in E were treated with 30 nM vincristine or vehicle for 48 h, released from vincristine for 12 d, and gRNA representation was assessed by next-generation sequencing. Relative abundance of each gRNA was normalized to its abundance in vehicle-treated controls. Significance assessed by Welch t test; P = 0.0001. (G) Experimental design to assess in vivo chemosensitivity of EZH2 mutant clone E cells or their parental Cas9 controls in NRG-immunodeficient mice. (H) FACS analysis of splenic cells harvested from mice after treatment as indicated in G. Each bar is the mean of five independent mice. Significance was assessed by Welch t test; P = 0.0026. (I) Representative FACS plots from mice analyzed in H. Control mice without fluorescent leukemia are shown as the negative control for setting FACS gates. *, P ≤ 0.05; **, P ≤ 0.01; ***, P ≤ 0.001; ****, P ≤ 0.0001; n.s., P > 0.05.
Figure 4.
Figure 4.
Haploinsufficiency for the core PRC2 components Ezh2 or Eed is sufficient to induce mitochondrial apoptosis resistance in mouse thymocytes. (A) Schema of experimental design. (B) FACS gating and sorting strategy to isolate thymocytes at the indicated developmental stages. Negative sorting was also performed to exclude cells expressing B cell, NK cell, red blood cell, or granulocytic markers. (C and D) Mx1:Cre transgenic, Ezh2 fl/WT (n = 5) or WT/WT (n = 6) siblings were treated with pIpC, and thymocytes were harvested as indicated in A and stained with a panel of antibodies to determine T cell developmental stage (B). PCR was performed on genomic DNA to verify appropriate deletion of Ezh2 (C, top). Stained thymocytes were subjected to BH3 profiling analysis using 1 µM BIM peptide for 25 min, and cytochrome c release was assessed by stage of T cell development using FACS analysis (C, bottom). Results are shown for all stages of T cell development that consistently yielded >250 FACS events for analysis. Significance was assessed by two-way ANOVA with Sidak adjustment for multiple comparisons between WT/WT versus fl/WT only for each stage of T cell development. P = 0.0066 for DN3, 0.049 for DN4, 0.44 for immature single positive (ISP), 0.96 for double positive (DP), 1.0 for CD8 SP, and 0.94 for CD4 SP. (D) Mx1:Cre transgenic, Eed fl/WT (n = 12) or WT/WT (n = 9) siblings were treated with pIpC, and thymocytes were harvested as indicated in A. PCR was performed to verify Eed deletion (D, top), and staining for T cell developmental markers and BH3 profiling analysis were performed as in D (bottom). Results are shown for all stages of T cell development that consistently yielded >250 FACS events for analysis. Significance was assessed by two-way ANOVA with Sidak adjustment for multiple comparisons between WT/WT versus fl/WT only for each stage of T cell development. P = 0.37 for DN3, 0.0017 for DN4, 0.76 for ISP, 1.0 for DP, 0.96 for CD8 SP, and 1.0 for CD4 single positive (SP). *, P ≤ 0.05; **, P ≤ 0.01; n.s., P > 0.05.
Figure 5.
Figure 5.
TRAP1 overexpression is necessary for induction of mitochondrial apoptosis resistance downstream of PRC2 inactivation. (A) CCRF-CEM human T-ALL cells were transduced with the indicated shRNAs, and RNA-seq was performed. Heat map depicts the genes most highly up-regulated following PRC2 depletion, based on DESEQ2 analysis for differentially expressed genes. Blue arrow denotes mitochondrial localized proteins; orange arrows denote genes whose loci are marked by H3K27me3 on ChIP-seq analysis (as investigated further in Fig. 6). (B) Western blot analysis for the indicated proteins in CCRF-CEM cells transduced with the indicated shRNA. The experiment was repeated twice, and a representative blot is shown. (C) Mx1:Cre transgenic, Ezh2 fl/WT or WT/WT siblings were treated with pIpC 4 wk after birth, and thymocytes were harvested 12 wk after birth. PCR was performed to verify excision of Ezh2 (left). Mouse thymocytes of the indicated developmental stages were FACS sorted and subjected to qRT-PCR analysis for Gapdh and Trap1 (right). Data points represent the mean expression of individual mice, with two mice analyzed per genotype. Significance was assessed by two-way ANOVA including main effect terms (using an F test) for Ezh2 genotype and T cell developmental stage (P = 0.0001). No interaction term was included in the model, so pairwise comparisons were not assessed. (D) The indicated human T-ALL cells were transduced with doxycycline-inducible, neomycin-resistant constructs encoding GFP or TRAP1. Western blot analysis was performed to assess expression of the indicated proteins (top) 72 h after the start of doxycycline treatment. At that time point, cells were treated with the indicated chemotherapeutics for 48 h, and apoptosis induction was assessed using a caspase 3/7 activity assay. Significance was assessed by two-way ANOVA with a Sidak adjustment for multiple comparisons between GFP and TRAP1 only for each treatment. For CCRF-CEM cells, P = 0.25 for DMSO and P < 0.0001 for all drugs. For PF382, P = 0.0048 for DMSO and P < 0.0001 for all other drugs. For RPMI 8402, P = 0.0002 for DMSO and P < 0.0001 for all other drugs. Results shown are the mean ± SEM of n = 3 biological replicates of a representative experiment, all of which were repeated at least twice. (E) CCRF-CEM cells were transduced with a neomycin-resistant “shRNA 1” targeting EZH2 or empty vector control and a puromycin-resistant “shRNA 2” targeting either TRAP1 or Luciferase control. Following antibiotic selection, cells were treated with the indicated chemotherapeutics for 48 h, and apoptosis induction was assessed using a caspase 3/7 activity assay. Differences were assessed by two-way ANOVA analysis, with Tukey adjustment for multiple comparisons. In all three drug conditions, P < 0.0001 for the comparison of shVector-shLuc versus shEZH2-shLuc–transduced cells, and P < 0.0001 for shEZH2-shLuc versus shEZH2-shTRAP1–transduced cells. Results shown are the mean ± SEM of n = 3 biological replicates from a representative experiment, all of which were repeated at least twice. (F) CCRF-CEM cells were transduced with the indicated shRNAs, treated with gamitrinib at the indicated doses, and viability was assessed using Cell TiterGlo. Differences were assessed by two-way ANOVA analysis with Sidak adjustment for multiple comparisons between shLuc and shGFP only for each gamitrinib dose. P = 0.97 for DMSO, P = 0.023 at 1 µM, and P < 0.0001 at 5 µM. Results shown are the mean ± SEM of n = 3 biological replicates from a representative experiment, which was repeated independently. (G) CCRF-CEM cells were transduced with shEZH2 no. 1, treated with gamitrinib in combination with either dexamethasone or doxorubicin at a range of doses, and viability was assessed using Cell TiterGlo. Synergy was assessed using combination index analysis. Data are shown for dose combinations with fractional inhibition of 0.2–0.95. Note synergistic interactions (combination index < 0.7) at dose combinations approaching maximal efficacy, as assessed by fractional inhibition of cell viability. *, P ≤ 0.05; **, P ≤ 0.01; ***, P ≤ 0.001; ****, P ≤ 0.0001; n.s., P > 0.05.
Figure 6.
Figure 6.
PRC2 regulates TRAP1 overexpression via CRIP2. (A) Direct canonical transcriptional targets of PRC2, defined as genes whose loci are marked by H3K27me3 at baseline and whose transcription is activated following PRC2 depletion, were transduced individually into human CCRF-CEM T-ALL cells. BH3 profiling (1 µM BIM peptide for 25 min) and qRT-PCR analysis were used to assess induction of apoptosis resistance and TRAP1 mRNA expression, respectively, and each is shown normalized to levels in EGFP-transduced control cells. Note that overexpression of the direct PRC2 targets PHLDB1, MXRA7, and TSPAN9 was toxic to CCRF-CEM cells; thus, these targets were not investigated further. Results shown are the mean ± SEM of n = 3 biological replicates. (B) ChIP-seq for H3K27me3 at the CRIP2 locus in PRC2-proficient CCRF-CEM cells. (C) CCRF-CEM cells were transduced with the indicated shRNAs and subjected to qRT-PCR analysis for expression of the indicated genes. P values calculated by Welch t test (EZH2 mRNA, P = 0.0004; CRIP2 mRNA, P < 0.0001). Results shown are the mean ± SEM of n = 3 biological replicates from one representative experiment, which was repeated twice. (D) Mx1:Cre transgenic, Ezh2 WT/WT or fl/WT mice were treated with pIpC 4 wk after birth, and thymocytes were harvested 12 wk after birth. Thymocytes of the indicated developmental stages were FACS sorted and subjected to qRT-PCR analysis for Gapdh and Crip2 RNA expression. Results are shown from individual mice from n = 2 mice per group. Significance was assessed by two-way ANOVA including main effect terms (using an F test) for Ezh2 genotype and T cell developmental stage (P = 0.008). No interaction term was included in the model, so pairwise comparisons were not assessed. (E) CCRF-CEM cells were transduced with a neomycin-resistant “shRNA 1” targeting EZH2 or empty vector control and a puromycin-resistant “shRNA 2” targeting either CRIP2 or Luciferase control. Cells were then treated with the indicated chemotherapeutic drugs, and effects on apoptosis were assessed by caspase 3/7 activity. Differences were assessed by two-way ANOVA analysis, with Tukey adjustment for multiple comparisons. In vincristine- and cytarabine-treated cells, P < 0.0001 for shVector-shLuc versus shEZH2-shLuc and shEZH2-shLuc versus shEZH2-shCRIP2–transduced cells. In asparaginase-treated cells, P < 0.0036 for shVector-shLuc versus shEZH2-shLuc, and P < 0.0001 shEZH2-shLuc versus shEZH2-shCRIP2–transduced cells. Results shown are the mean ± SEM of n = 3 biological replicates from one representative experiment, which was repeated independently. (F) CCRF-CEM cells were transduced with CRIP2 or EGFP. qRT-PCR analysis was performed to assess expression of CRIP2 mRNA (top, P < 0.0001 by Welch t test) or TRAP1 mRNA (bottom right, P = 0.027 by Welch t test). Effects on mitochondrial apoptosis were assessed by BH3 profiling using 1 µM BIM peptide for 25 min (bottom, P < 0.0001 by Welch t test). Results shown are the mean ± SEM of n = 3 biological replicates from one representative experiment, which was repeated independently. (G) T-ALL cells from primary patients were expanded in immunodeficient mice, harvested, treated in short-term culture with vehicle or 1 µM GSK126 for 6 d, and qRT-PCR analysis was performed for the indicated genes. P values calculated by Welch t test. For CRIP2, P = 0.0001 for D115, P = 0.031 for D9, P = 0.0015 for FE849, P < 0.0001 for D12, and P = 0.0007 for D15. For TRAP1, P = 0.033 for D115, P = 0.16 for D9, P = 0.006 for FE849, P = 0.08 for D12, and P = 0.0001 for D15. Results shown are the mean ± SEM of n = 3 biological replicates from one representative experiment, which was repeated independently. (H) Correlation of CRIP2 and TRAP1 mRNA expression in RNA-seq data from primary T-ALL patient samples. Pearson correlation coefficient (r = 0.576) reported P value (P = 0.003) indicating a significant positive correlation between CRIP2 and TRAP1 RNA expression. (I) Comparison of event-free survival and overall survival among T-ALL cases on DFCI 05001 or COG AALL0434 clinical trials classified as TRAP1 high or low expressing based on whether RNA-seq TRAP1 expression was above or below the median. A one-sided log-rank test was performed due to the hypothesized direction of event-free survival (P = 0.028) and overall survival (P = 0.043) differences. Number of samples per group: TRAP1 low, n = 14; TRAP1 high, n = 10. (J) Proposed model to explain regulation of chemotherapy-induced apoptosis by PRC2. *, P ≤ 0.05; **, P ≤ 0.01; ***, P ≤ 0.001; ****, P ≤ 0.0001; n.s., P > 0.05.

References

    1. Abedalthagafi M.S., Merrill P.H., Bi W.L., Jones R.T., Listewnik M.L., Ramkissoon S.H., Thorner A.R., Dunn I.F., Beroukhim R., Alexander B.M., et al. 2014. Angiomatous meningiomas have a distinct genetic profile with multiple chromosomal polysomies including polysomy of chromosome 5. Oncotarget. 5:10596–10606. 10.18632/oncotarget.2517 - DOI - PMC - PubMed
    1. Baines C.P., Kaiser R.A., Purcell N.H., Blair N.S., Osinska H., Hambleton M.A., Brunskill E.W., Sayen M.R., Gottlieb R.A., Dorn G.W., et al. 2005. Loss of cyclophilin D reveals a critical role for mitochondrial permeability transition in cell death. Nature. 434:658–662. 10.1038/nature03434 - DOI - PubMed
    1. Bhola P.D., Mar B.G., Lindsley R.C., Ryan J.A., Hogdal L.J., Vo T.T., DeAngelo D.J., Galinsky I., Ebert B.L., and Letai A.. 2016. Functionally identifiable apoptosis-insensitive subpopulations determine chemoresistance in acute myeloid leukemia. J. Clin. Invest. 126:3827–3836. 10.1172/JCI82908 - DOI - PMC - PubMed
    1. Burns M.A., Liao Z.W., Yamagata N., Pouliot G.P., Stevenson K.E., Neuberg D.S., Thorner A.R., Ducar M., Silverman E.A., Hunger S.P., et al. 2018. Hedgehog pathway mutations drive oncogenic transformation in high-risk T-cell acute lymphoblastic leukemia. Leukemia. 32:2126–2137. 10.1038/s41375-018-0097-x - DOI - PMC - PubMed
    1. Cheung A.K., Ko J.M., Lung H.L., Chan K.W., Stanbridge E.J., Zabarovsky E., Tokino T., Kashima L., Suzuki T., Kwong D.L., et al. 2011. Cysteine-rich intestinal protein 2 (CRIP2) acts as a repressor of NF-kappaB-mediated proangiogenic cytokine transcription to suppress tumorigenesis and angiogenesis. Proc. Natl. Acad. Sci. USA. 108:8390–8395. 10.1073/pnas.1101747108 - DOI - PMC - PubMed

Publication types

MeSH terms

Associated data