. 2019 Jan 4;93(2):e01758-18.
doi: 10.1128/JVI.01758-18. Print 2019 Jan 15.

Deletion of both the Tyrosine-Based Endocytosis Signal and the Endoplasmic Reticulum Retrieval Signal in the Cytoplasmic Tail of Spike Protein Attenuates Porcine Epidemic Diarrhea Virus in Pigs

Affiliations

Deletion of both the Tyrosine-Based Endocytosis Signal and the Endoplasmic Reticulum Retrieval Signal in the Cytoplasmic Tail of Spike Protein Attenuates Porcine Epidemic Diarrhea Virus in Pigs

Yixuan Hou et al. J Virol. .

Abstract

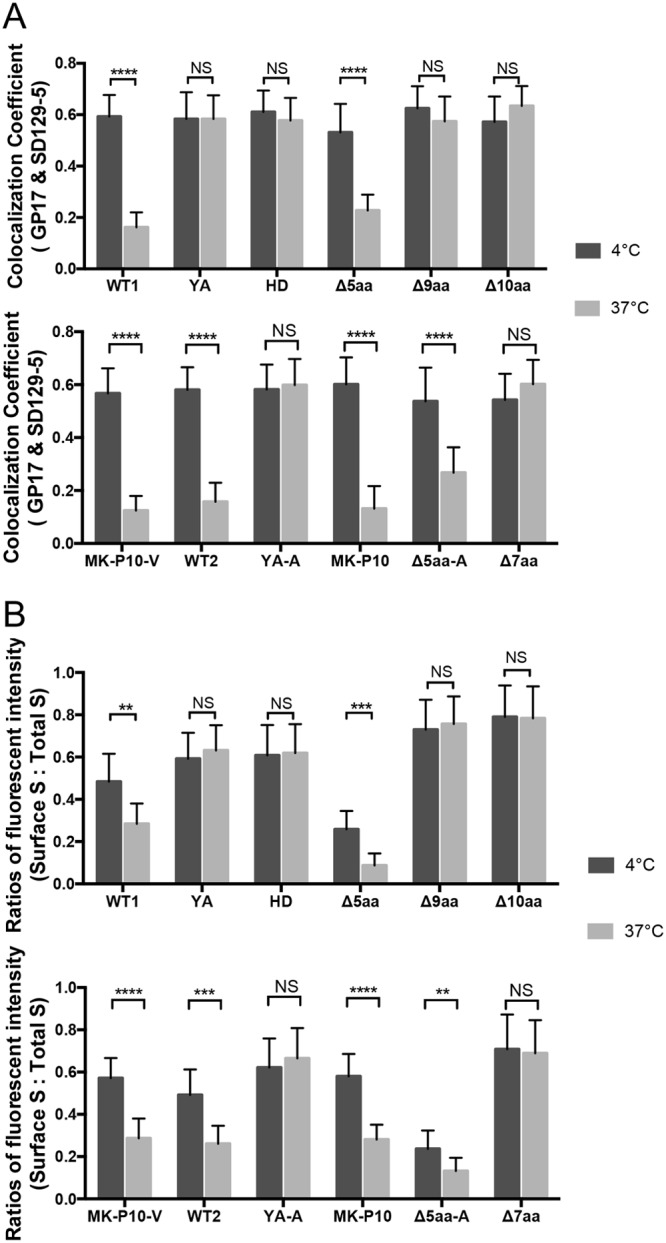
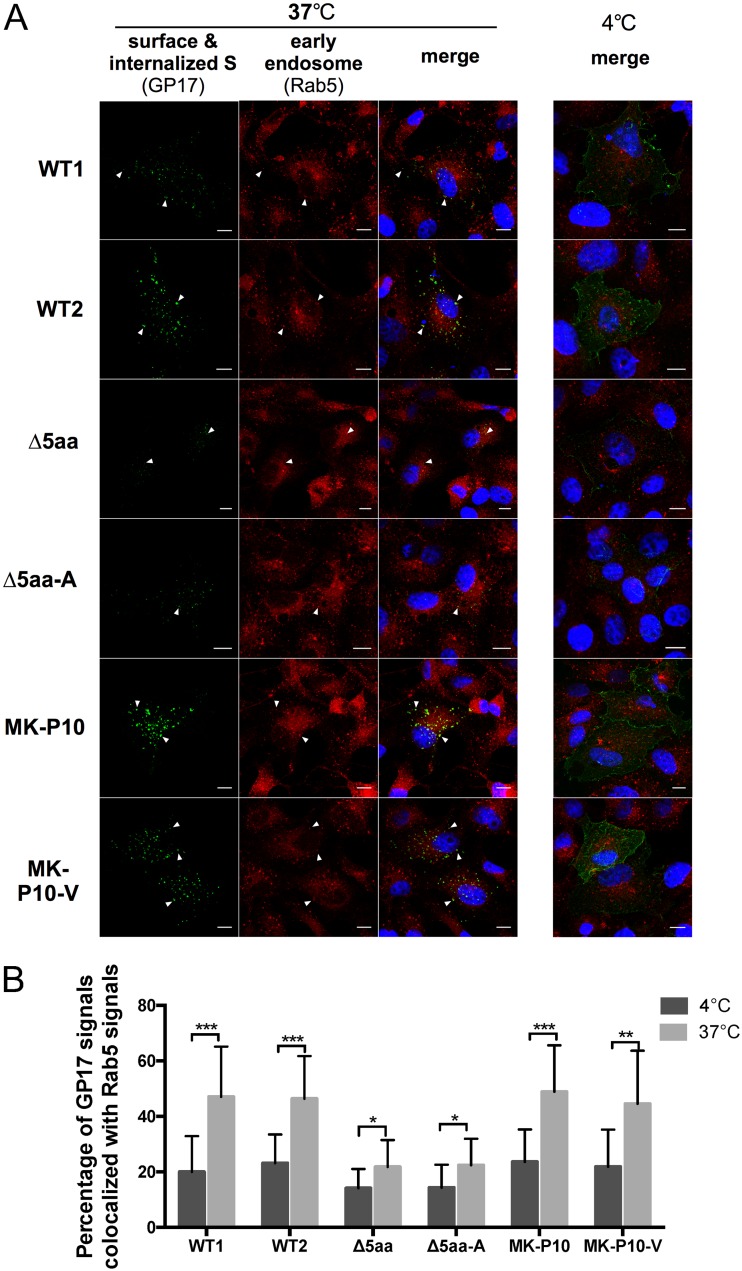
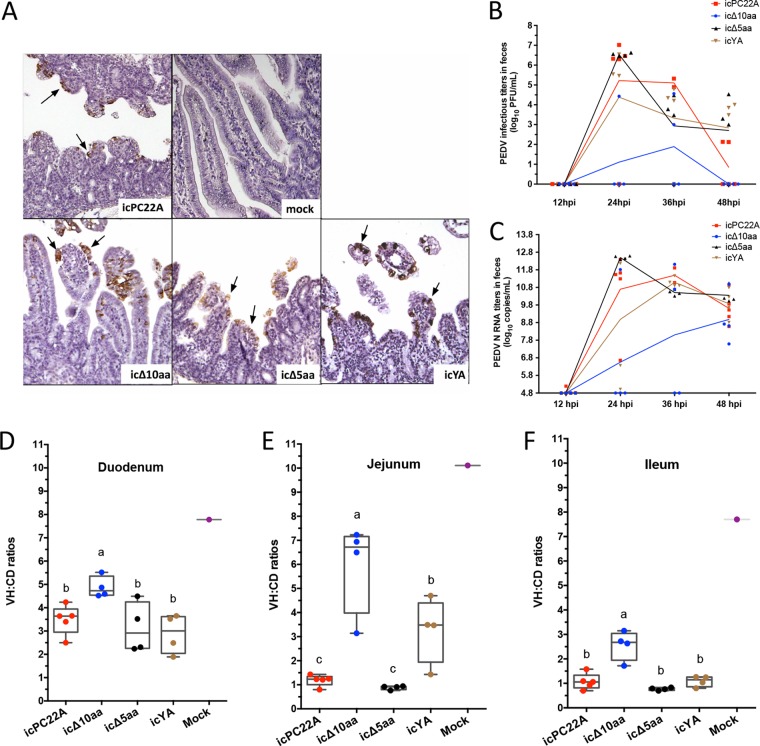
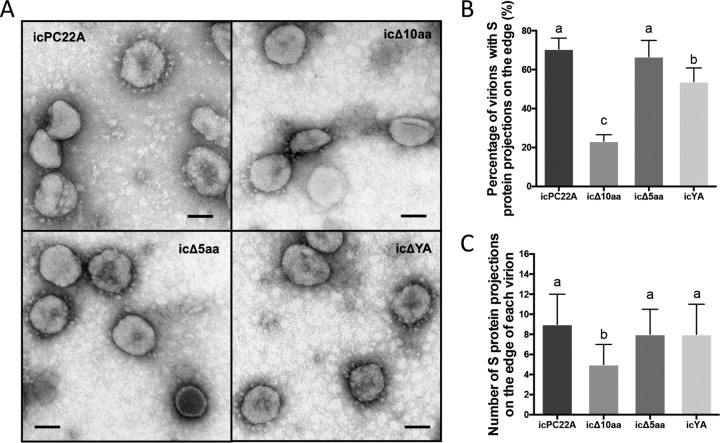
Porcine epidemic diarrhea virus (PEDV) causes high mortality in neonatal piglets. The PEDV spike (S) protein contains two intracellular sorting motifs, YxxΦ (tyrosine-based motif YEVF or YEAF) and KVHVQ at the cytoplasmic tail, yet their functions have not been fully elucidated. Some Vero cell-adapted and/or attenuated PEDV variants contain ablations in these two motifs. We hypothesized that these motifs contribute to viral pathogenicity. By transiently expressing PEDV S proteins with mutations in the motifs, we confirmed that the motif KVHVQ is involved in retention of the S proteins in the endoplasmic reticulum (ER)-Golgi intermediate compartment (ERGIC). In addition, we showed that the YxxΦ motif triggers endocytosis of S proteins. These two motifs synergistically regulate the level of S expressed on the cell surface. To investigate their role in viral pathogenicity, we generated three recombinant PEDVs by introducing deletions or a mutation in the two motifs of the infectious clone of PEDV PC22A strain (icPC22A): (i) icΔ10aa (ΔYxxΦEKVHVQ), (ii) icΔ5aa (ΔKVHVQ), and (iii) icYA (Y1378A, to an inactivated motif, AEVF). Infection of Vero cells with icΔ10aa resulted in larger syncytia and more virions, with reduced numbers of S protein projections on the surface compared with icPC22A. Furthermore, we orally inoculated five groups of 5-day-old gnotobiotic piglets with the three mutants, icPC22A, or a mock treatment. Mutant icΔ10aa caused less severe diarrhea rate and significantly milder intestinal lesions than icPC22A, icΔ5aa, and icYA. These data suggest that the deletion of both motifs can reduce the virulence of PEDV in piglets.IMPORTANCE Many coronaviruses (CoVs) possess conserved motifs YxxΦ and/or KxHxx/KKxx in the cytoplasmic tail of the S protein. The KxHxx/KKxx motif has been identified as the ER retrieval signal, but the function of the YxxΦ motif in the intracellular sorting of CoV S proteins remains controversial. In this study, we showed that the YxxΦ of PEDV S protein is an endocytosis signal. Furthermore, using reverse genetics technology, we evaluated its role in PEDV pathogenicity in neonatal piglets. Our results explain one attenuation mechanism of Vero cell-adapted PEDV variants lacking functional YxxΦ and KVHVQ motifs. Knowledge from this study may aid in the design of efficacious live attenuated vaccines against PEDV, as well as other CoVs bearing the same motif in their S protein.

Keywords: PEDV; YxxΦ; coronavirus; endocytosis; spike; virulence.


Figures

FIG 1
FIG 1
(A) Comparison of the C-terminal 24 amino acids of spike proteins among coronaviruses (CoVs). The YxxΦ motifs are marked in red, and the endoplasmic reticulum retrieval signals (ERRSs) are marked in blue. FIPV, feline infectious peritonitis virus; HCoV, human coronavirus; MERS-CoV, Middle East respiratory syndrome coronavirus; MHV, murine hepatitis virus; PDCoV, porcine deltacoronavirus. (B) Schematic of the plasmids expressing M protein or mCherry-tagged S proteins. CMV, cytomegalovirus promoter; Led Seq, 5′leader sequence of PEDV S sgRNA; mChy, mCherry gene; A25, 25-nucleotide poly(A) tail; HDV, hepatitis D virus ribozyme; BGH, bovine growth hormone terminator. (C) The C-terminal amino acid sequences of two wild-type (WT) S proteins and the 10 mutants. WT1 and WT2 contain the YEVF and YEAF motifs, respectively.
FIG 2
FIG 2
An intact KVHVQ motif is required for retaining PEDV S proteins in the ERGIC region. (A) Immunofluorescent (IF) staining of ERGIC in the individual pUC19-sgRNA-S-transfected cells. Vero cells were transfected with individual plasmid DNA and fixed with methanol at 12 h posttransfection (hpt). Arrows indicate S puncta in the WT1-, WT2-, MK-P10-, MK-P10-V-, Δ5aa-, and Δ5aa-A-transfected cells. Scale bar: 10 μm. (B) Quantification of colocalization of S proteins and ERGIC. Twenty to 25 individual cells in each sample were selected randomly. Pearson’s correlation coefficient (PCC) values of the S and ERGIC signals in each cell are shown in the box-whisker plot. The boxes indicate interquartile ranges in different groups, the lines in the boxes represent median values, and the whiskers show the range of a group of values excluding the outliers (dots). Groups with statistically significant differences (P < 0.05) are indicated by different letters; the alphabetical order reflects groups with median values from high to low.
FIG 3
FIG 3
Mutation of the YxxΦ and KVHVQ motifs of PEDV S protein altered the expression of S proteins on the cell surface and syncytium formation. (A) IF staining of S proteins expressed on cell surface, or total (surface and intracellular) S proteins (Total S). Vero cells were fixed by 4% formaldehyde at 12 h after transfection with plasmid DNA. Without permeabilization, surface S proteins were stained with guinea pig antiserum GP17 against PEDV S1 followed by Alexa Fluor 488 (AF488)-conjugated goat anti-guinea pig IgG. Total S proteins were observed under the mCherry channel. Scale bar: 30 μm. (B) The fluorescent intensities of the total S proteins (mCherry) were measured on 50 individual cells of each sample. NS, no statistically significant difference (P > 0.05). (C) Surface S/total S fluorescent intensity ratios (AF488/mCherry) were calculated based on 50 individual cells of each sample. (D) Syncytia induced by mCherry-tagged WT S proteins and their mutants. At 6 h after transfection with the plasmid DNA, Vero cells were cultured in medium containing trypsin (10 μg/ml) for an additional 6 h. Cells were fixed with methanol and total S proteins were detected by IF staining with the antiserum GP17 as described above. Nuclei were stained with DAPI. Scale bar: 50 μm. (E) Nuclei in each syncytium were counted based on 200 syncytia for each sample. Values in panels B, C, and E are shown in box-whisker plots. The boxes indicate interquartile ranges in different groups, the lines in the boxes represent median values, and the whiskers show the range of a group of values excluding the outliers, which are shown as dots. Groups with statistically significant differences (P < 0.05) are indicated with different letters; the alphabetical order reflects groups with median values from high to low.
FIG 4
FIG 4
IF staining of antibody-S protein uptake assay in Vero cells. At 24 h after transfection with the plasmid DNA, Vero cells were incubated with guinea pig anti-S1 antiserum GP17 at 4°C for 10 min. After washing with PBS three times, one set of cells was cultured at 37°C for 30 min to allow endocytosis. Another set of cells was kept at 4°C for 30 min as the control group. Cells were fixed with 4% formaldehyde without permeabilization. Surface S proteins were stained with mouse anti-S2 monoclonal antibody SD129-5 and goat anti-mouse AF647-conjugated secondary antibodies (red). Then the cells were permeabilized with Triton X-100 and stained with goat anti-guinea pig AF488-conjugated secondary antibodies (green). Nuclei were stained with DAPI (blue). Cells were randomly selected, and images were taken by using a Leica TCS SP6 confocal microscope. Scale bar: 10 μm.
FIG 5
FIG 5
Quantification of the colocalization of Gp17-bound S proteins and surface S proteins and the ratios of surface S/total S levels in the antibody-S protein uptake assay. (A) Colocalization coefficients between the GP17-bound S proteins and surface S proteins (SD129-5) are shown in Fig. 4. PCC values of the two signals in 20 to 25 individual cells cultured at 4°C or 37°C for 30 min were plotted. (B) Quantification of GP17 signals on the cell surface in the Gp17-S uptake assay. The assay was performed as described in the legend to Fig. 4. To stain the GP17 bound on the cell surface, cells were fixed with 4% formaldehyde without permeabilization. GP17 was probed using AF488-conjugated secondary antibodies (green). The fluorescent intensities of surface (AF488) to total S (mCherry) ratios were measured in 20 to 25 individual cells. Values are plotted in a bar chart, and shown as means ± SDs. Values of the same sample cultured at 4°C and 37°C were analyzed by Student’s t test. NS, P > 0.05; **, P < 0.01; ***, P < 0.001; ****, P < 0.0001.
FIG 6
FIG 6
Internalized S proteins colocalized with early endosomes. Antibody-S protein uptake assays were performed at 24 hpt for the two wild-type S proteins (WT1 and WT2) and the four mutants, Δ5aa, Δ5aa-A, MK-P10, and MK-P10-V, that formed puncta as shown in Fig. 4. Cells were incubated with guinea pig anti-S1 antiserum GP17 at 4°C for 10 min. After washing with PBS three times, one set of cells were cultured at 37°C for 30 min to allow endocytosis and another set of cells were incubated at 4°C for 30 min. After fixation with methanol, early endosome marker Rab5 proteins were stained with rabbit anti-Rab5 MAb (C8B1) followed by AF647-conjugated goat anti-rabbit antibody (red). GP17-bound S proteins were stained with goat anti-guinea pig AF488-conjugated secondary antibodies (green). (A) IF staining of internalized S protein puncta and early endosome marker Rab5. Arrows indicate the GP17-bound S protein puncta or/and early endosome marker Rab5 that colocalized together. Scale bar: 10 μm. (B) Percentage of GP17-S signals colocalized with Rab5 signals in Vero cells. The MCC values of the two signals in 20 to 25 cells in each sample were measured. Values are shown as means ± SDs. Values of the same sample cultured in 4°C or 37°C were analyzed by Student’s t test. *, P < 0.05; **, P < 0.01; ***, P < 0.001.
FIG 7
FIG 7
Virulence of the recombinant PEDV lacking both the YxxΦ and KVHVQ motifs was reduced in gnotobiotic piglets. (A) Immunohistochemistry staining of PEDV N proteins in the jejunum of piglets euthanized at 52 hpi. Arrows indicate PEDV antigens (brown). Magnification, ×300. (B and C) Fecal PEDV infectious titers (B) and viral RNA (N gene) titers (C) of individual recombinant PEDV-infected piglets. Rectal swab (RS) samples of individual piglets were collected every 12 h, except for three icPC22A-infected piglets that were not sampled at 36 hpi. (D to F) Mean VH/CD values of duodenum, jejunum, and ileum of individual piglets euthanized at 52 hpi after pigs had severe diarrhea and vomiting. Thirty intact villi in each intestinal section of individual piglets were measured. In the plots, the boxes indicate interquartile ranges, the lines in the boxes represent median values, and the whiskers show the range of data. Due to the small sample sizes, all the individual values are also shown in dots in the plot. Groups with statistically significant differences (P < 0.05) are indicated with different letters; the alphabetical order reflects groups with median values from high to low.
FIG 8
FIG 8
The lack of either the YxxΦ or KVHVQ motif in the CT of the S protein alters PEDV replication efficiency and syncytium formation in Vero cells. (A) One-step (MOI = 5) growth curves of the four recombinant PEDVs (icPC22A, icΔ10aa, icΔ5aa, and icYA) in Vero cells. Titers are shown as means ± SDs for each group. Statistically significantly different titers at 12 hpi (P < 0.05) are indicated by different letters. (B) Multistep (MOI = 0.001) growth curves of the four recombinant PEDVs in Vero cells. Statistically significantly different peak titers (P < 0.05) are indicated as different letters. (C) Plaques caused by the four recombinant viruses at 40 hpi in Vero cells. Cells were stained with neutral red. Arrows indicate the plaques. (D) Quantification of the diameter of plaques at different time points based on 30 plaques of each PEDV. Data are shown as mean ± SDs of each group. Statistical different titers of 40 h (P < 0.05) are indicated by different letters. (E) IF staining of surface S proteins in fixed but not permeabilized Vero cells infected with the four recombinant PEDVs at 8 hpi (MOI = 1). Scale bar: 25 μm. (F) Subcellular structures of the Vero cells infected with the recombinant PEDVs at 12 hpi. Mature virions and immature virions are indicated by filled arrows and empty arrows, respectively. Scale bar: 100 nm. (G) Quantification of mature virions in each Golgi vacuole in the Vero cells infected with the four recombinant PEDVs is shown in the box-whisker plots. The boxes indicate interquartile ranges, the lines in the boxes represent median values, and the whiskers show the range of a group of values excluding the outliers, which are shown as dots. Values in panels A, D, and G were analyzed by one-way ANOVA followed by Tukey’s comparison test. Groups with statistically significant differences (P < 0.05) are indicated by different letters, and the alphabetical order reflects groups with median values from high to low.
FIG 9
FIG 9
The virions of icΔ10aa PEDV with an S protein lacking the YxxΦ and KVHVQ motifs contained fewer S protein projections. (A) TEM images of purified virions of icPC22A, icΔ10aa, icΔ5aa, and icYA. Scale bar: 50 nm. (B) Percentages of virions with S protein projections on the surface in the TEM images of each recombinant PEDV. For each viral sample, 25 to 35 TEM images were evaluated; each image contained about 20 to 60 virions. (C) Quantification of S projections on the surface of individual virions. One hundred particles with S projections on the surface were randomly selected and counted from the TEM images of each recombinant PEDV. Values are shown as mean ± SDs and were analyzed by one-way ANOVA followed by Tukey’s comparison test. Groups with statistically significant differences (P < 0.05) are indicated with different letters; the alphabetical order reflects groups with median values from high to low.
FIG 10
FIG 10
IF staining of S and M proteins coexpressed in Vero cells. (A) IF staining of surface S and M proteins in the Vero cells expressing S and M simultaneously or only S proteins at 12 hpt. The total S proteins (mCherry, red), M proteins (green), and cell surface S proteins (cyan) were visualized. Scale bar: 10 μm. In the images of the WT1, Δ10aa, and YA group, S-expressing cells with or without M protein expression are included. For the Δ5aa-M group, filled arrows indicate surface S (cyan) colocalized with S (mCherry, red) and M (green) and empty arrows indicate surface S (cyan) colocalized with S (mCherry, red). (B) Colocalization coefficients (PCC) between S and M proteins in the Vero cells. Ten to 18 cells in each group were measured and analyzed by one-way ANOVA and Tukey’s test. (C) Two sets of Vero cells were transfected with the individual S plasmid alone or cotransfected with the S and M plasmids. Surface S/total S fluorescent intensity ratios (AF647:mCherry) were calculated based on 10 to 20 individual cells for the cells coexpressing S and M or transfected with S alone. Values in panel B are shown in a box-whisker plot and were analyzed by one-way ANOVA followed by Tukey’s comparison test. In panel C, values in the group coexpressing S and M and the S-only group in each plasmid DNA are shown as means ± SDs and were analyzed by Student’s t test. *, P < 0.05; **, P < 0.01; ***, P < 0.0001.

Similar articles

Cited by

References

    1. Wang D, Fang L, Xiao S. 2016. Porcine epidemic diarrhea in China. Virus Res 226:7–13. doi:10.1016/j.virusres.2016.05.026. - DOI - PMC - PubMed
    1. Paarlberg PL. 2014. Updated estimated economic welfare impacts of porcine epidemic diarrhea virus (PEDV). http://ageconsearch.umn.edu/bitstream/174517/2/14-4.Updated%20Estimated%....
    1. Schulz LL, Tonsor GT. 2015. Assessment of the economic impacts of porcine epidemic diarrhea virus in the United States. J Anim Sci 93:5111–5118. doi:10.2527/jas.2015-9136. - DOI - PMC - PubMed
    1. Stevenson GW, Hoang H, Schwartz KJ, Burrough ER, Sun D, Madson D, Cooper VL, Pillatzki A, Gauger P, Schmitt BJ, Koster LG, Killian ML, Yoon KJ. 2013. Emergence of porcine epidemic diarrhea virus in the United States: clinical signs, lesions, and viral genomic sequences. J Vet Diagn Invest 25:649–654. doi:10.1177/1040638713501675. - DOI - PubMed
    1. Wicht O, Li W, Willems L, Meuleman TJ, Wubbolts RW, van Kuppeveld FJM, Rottier PJM, Bosch BJ. 2014. Proteolytic activation of the porcine epidemic diarrhea coronavirus spike fusion protein by trypsin in cell culture. J Virol 88:7952–7961. doi:10.1128/JVI.00297-14. - DOI - PMC - PubMed

Publication types

Substances

LinkOut - more resources