. 2019 Jan 17;93(3):e01776-18.
doi: 10.1128/JVI.01776-18. Print 2019 Feb 1.

Cell-to-Cell Transmission Is the Main Mechanism Supporting Bovine Viral Diarrhea Virus Spread in Cell Culture

Affiliations

Cell-to-Cell Transmission Is the Main Mechanism Supporting Bovine Viral Diarrhea Virus Spread in Cell Culture

Fernando Merwaiss et al. J Virol. .

Abstract

After initiation of an infective cycle, spread of virus infection can occur in two fundamentally different ways: (i) viral particles can be released into the external environment and diffuse through the extracellular space until they interact with a new host cell, and (ii) virions can remain associated with infected cells, promoting the direct passage between infected and uninfected cells that is referred to as direct cell-to-cell transmission. Although evidence of cell-associated transmission has accumulated for many different viruses, the ability of members of the genus Pestivirus to use this mode of transmission has not been reported. In the present study, we used a novel recombinant virus expressing the envelope glycoprotein E2 fused to mCherry fluorescent protein to monitor the spreading of bovine viral diarrhea virus (BVDV) (the type member of the pestiviruses) infection. To demonstrate direct cell-to-cell transmission of BVDV, we developed a cell coculture system that allowed us to prove direct transmission from infected to uninfected cells in the presence of neutralizing antibodies. This mode of transmission requires cell-cell contacts and clathrin-mediated receptor-dependent endocytosis. Notably, it overcomes antibody blocking of the BVDV receptor CD46, indicating that cell-to-cell transmission of the virus involves the engagement of coreceptors on the target cell.IMPORTANCE BVDV causes one of the most economically important viral infections for the cattle industry. The virus is able to cross the placenta and infect the fetus, leading to the birth of persistently infected animals, which are reservoirs for the spread of BVDV. The occurrence of persistent infection has hampered the efficacy of vaccination because it requires eliciting levels of protection close to sterilizing immunity to prevent fetal infections. While vaccination prevents disease, BVDV can be detected if animals with neutralizing antibodies are challenged with the virus. Virus cell-to-cell transmission allows the virus to overcome barriers to free virus dissemination, such as antibodies or epithelial barriers. Here we show that BVDV exploits cell-cell contacts to propagate infection in a process that is resistant to antibody neutralization. Our results provide new insights into the mechanisms underlying the pathogenesis of BVDV infection and can aid in the design of effective control strategies.

Keywords: CD46; E2; bovine viral diarrhea virus; cell-to-cell transmission; endocytosis; pestiviruses; reporter genes; surface receptor; virus entry.


Figures

FIG 1
FIG 1
Design and construction of recombinant BVDV carrying a fusion of mCherry fluorescent protein to the viral envelope protein E2. (A) Schematic representation of BVDV/mCherry-E2 genome. The mCherry sequence was inserted between the protease cleavage site at the end of E1 and the beginning of E2. Coding sequences for nonstructural proteins are indicated in blue and those for structural proteins in orange. Host signal peptidase cleavage sites are indicated with arrows and viral protease cleavage sites with arrowheads. (Top) Insertion of the 90-amino-acid DNAJC14 subdomain (Jiv90) within NS2 into the cytopathic (cp) variant of BVDV/mCherry-E2 is indicated with a gray box. (Bottom) Sequence of amino acids around the mCherry insertion. (B) mCherry expression coincides with NS3 expression. Representative images of MDBK cells transfected with in vitro-transcribed RNA of BVDV/mCherry-E2 are shown. Cells were fixed at 3 days posttransfection and stained with a monoclonal antibody against NS3 and with DAPI. (C) Time course of infection of MDBK cells with cytopathic and noncytopathic BVDV/mCherry-E2. Images of fixed cells stained with DAPI were acquired at 24, 48, and 72 h postinfection. (D) mCherry colocalizes with E2. Confocal microscopy images of MDBK cells infected with BVDV/mCherry-E2 and stained with a monoclonal antibody against E2 are shown. Split-channel images of the boxed areas are presented in the bottom row. Colocalization analysis values are as follows: Pearson’s R, 0.68; Manders M1, 0.959; Manders M2, 0.984; and Costes P, 1.00.
FIG 2
FIG 2
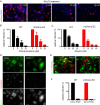
Soluble E2 and MAbs against CD46 block BVDV infection. (A) Expression of recombinant E2. A truncated version of E2 fused to a 6×His tag at the C terminus was produced in a soluble form by use of a baculovirus expression system and purified by affinity chromatography. Fractions eluted from an IMAC column with increasing concentrations of imidazole were resolved by SDS-PAGE, and elution of the recombinant protein was detected by Coomassie blue staining of the gel. (B) Western blotting using anti-6×His tag (left lane) and anti-BVDV (right lane) antibodies confirmed the identity of the protein. (C) Functionality of recombinant E2 tested in a cytopathic effect reduction assay. MDBK cells were preincubated with increasing amounts of the recombinant protein and then infected with cpBVDV at an MOI of 0.01 (BVDV; top rows) or left uninfected (no inf; bottom row). At 3 to 4 days postinfection, cells were fixed and stained with crystal violet to estimate the extent of the cytopathic effect. (D) Inhibition of BVDV infection by recombinant E2. Data collected from the cytopathic effect reduction assay were used to plot the log concentration versus the percentage of inhibition. Inhibitory concentrations were estimated from nonlinear regression fitting of the curve. (E) Plot of the log concentration versus the percentage of inhibition for cytopathic effect reduction assay of BVDV infection in MDBK cells preincubated with increasing amounts of a mix of MAbs BVD/CA 17 and 26 against CD46. (F) Representative images of cells infected with parental BVDV or BVDV/mCherry-E2 and fixed at 24 h. Cells infected with the parental virus were identified by immunostaining of E2 (green channel in left panel). Expression of mCherry allowed direct visualization of cells infected with BVDV/mCherry-E2 (red channel in right panel). (G) Soluble E2 and CD46 MAbs completely inhibited infection by parental BVDV and BVDV/mCherry-E2. The bar graph shows the quantification of the inhibition of BVDV entry into MDBK cells preincubated with recombinant E2 (rE2) or CD46 MAbs (αCD46). Cells were infected with parental BVDV or BVDV/mCherry-E2 and processed as described for panel F. Bars represent the percentages of infected cells relative to control cells for infection with parental BVDV (WT; black bars) or BVDV/mCherry-E2 (red bars).
FIG 3
FIG 3
Comparison of the entry routes of parental BVDV and BVDV/mCherry-E2. (A) Effect of entry inhibitors on BVDV infection. Representative images of cells treated with increasing concentrations of NH4Cl and infected with BVDV/mCherry E2 are shown. (B and C) Dose-dependent inhibition of BVDV entry by chlorpromazine and NH4Cl. Bar graphs show the quantification of the inhibition of entry of parental BVDV or BVDV/mCherry-E2 into MDBK cells treated with increasing concentrations of drugs. Bars represent the means and standard deviations of the percentages of infected cells relative to control cells for three independent experiments. At least 500 infected cells were counted for the control in each of the experiments. (D) Overexpression of dominant negative Eps15 in MDBK cells decreases clathrin-dependent uptake of transferrin. Representative images of the uptake of Texas Red-labeled transferrin (red channel) into MDBK cells overexpressing a control (DIIIΔ2) or dominant negative (EH29) construct of Eps15 (green channel) are shown. (E) Representative images of the entry of BVDV/mCherry-E2 (red channel) into MDBK cells overexpressing a control (DIIIΔ2) or dominant negative (EH29) construct of Eps15 (green channel). (F) Overexpression of dominant negative Eps15 blocks infection with BVDV. The bar graph shows the quantification of virus entry into cells overexpressing a control (DIIIΔ2) or dominant negative (EH29) construct of Eps15. The percentage of cells overexpressing control Eps15 and infected with parental BVDV (black bars) or BVDV/mCherry-E2 (red bars) was set to 100%. Bars for cells overexpressing dominant negative Eps15 represent the percentage of infection relative to that for control Eps15-overexpressing cells.
FIG 4
FIG 4
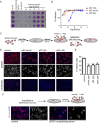
Spreading of BVDV is resistant to antibody neutralization of free viruses. (A) Titration of neutralizing antibodies by cytopathic effect reduction assay. An E2 immune serum was obtained from mice immunized with recombinant E2. A stock of cpBVDV was incubated with serial dilutions of the serum and then used to infect MDBK cells. At 3 to 4 days postinfection, cells were fixed and stained with crystal violet to estimate the extent of the cytopathic effect. (B) Data collected by cytopathic effect reduction assay were used to plot the log dilution versus the percentage of inhibition for serum against E2 (αE2 serum), the corresponding IgG fraction (αE2 IgG), and a MAb against E2 (αE2 MAb). Antibody titers were estimated from nonlinear regression fitting of the curve. (C) Schematic representation of the experimental setup to compare spreading of the virus in MDBK cells cultured in control medium or in the presence of neutralizing antibodies. (D) BVDV spread resists antibody neutralization of free virus. MDBK cells were infected with BVDV/mCherry-E2 (MOI = 0.1), and the infection was allowed to proceed for 48 h in control medium or in the presence of neutralizing antibodies. Representative images of virus spread (red channel) in cells cultured in control medium or medium containing neutralizing antibodies (top panels) and of the reinfection of fresh MDBK cells with the supernatants harvested at the end of the experiment (bottom panels) are shown. (E) Bar graph showing quantification of the absolute percentage of infected cells. Bars represent the means and standard deviations for three independent images. Data were analyzed by one-way ANOVA with Dunnett’s posttest (**, P < 0.01; ***, P < 0.001). (F) (Top) Schematic representation of the experimental setup to assess virus spreading in the presence of neutralizing serum in an infection started by transfection of in vitro-transcribed RNA into MDBK cells. (Bottom) Representative images of cells transfected with the RNA of BVDV/mCherry-E2 (red channel) and cultured in control medium or in medium containing neutralizing serum.
FIG 5
FIG 5
Antibody-resistant spreading of BVDV requires cell-cell contact. (A) Schematic representation of the transwell assay. Infected MDBK cells on a transwell membrane were cocultured with target MDBK cells in control medium or in the presence of neutralizing serum to test the dependence of spreading on cell-cell contact. (B) Representative images of the transwell assay for control spreading (left panels) and spreading in the presence of neutralizing serum (right panels). Producer cells were infected with BVDV/mCherry-E2 (red channel). Spreading from infected (producer) cells to noninfected (target) cells was assessed at 2 days postinfection.
FIG 6
FIG 6
Cell-to-cell transmission of BVDV is the main mechanism contributing to spreading. (A) Schematic representation of the experimental setup of the coculture system of producer cells persistently infected with ncpBVDV/mCherry-E2 (red) and noninfected target cells expressing GFP (green). Spreading from producer cells to target cells can be distinguished by the expression of both GFP and mCherry (yellow). (B) Identification of infected target cells by automated image analysis. The number of target cells (GFP; green channel) infected with BVDV/mCherry-E2 (mCherry; red channel) was identified on a cell monolayer (DAPI; blue channel) by using the analytical tools of ImageJ software. Appropriate thresholding and binary processing of the red, green, and blue channels identified objects corresponding to mCherry expression in cpBVDV/mCherry-E2-infected cells, GFP expression in target cells, and cell nuclei, respectively (segmentation). We next used logical operators and “analyze particles” tools to number target cells (GFP and DAPI masks) and infected target cells (mCherry and GFP and DAPI masks). (C) Superpositioning of the result mask (yellow) identifying infected target cells with the split-channel images of the boxed area in panel B. (D) Direct cell-to-cell spread of BVDV. Representative images of spreading of BVDV into target cells in cocultures of producer (mCherry; red channel) and target (GFP; green channel) cells in control medium or medium containing neutralizing antibodies are shown. (E) Quantification of spreading. Bars represent the means and standard deviations of the percentages of target cells infected with ncp (top) or cp (bottom) BVDV/mCherry-E2 (% spread). At least a thousand total target cells were counted for each condition. Data were analyzed by one-way ANOVA with Dunnett’s posttest (*, P < 0.05; **, P < 0.01; ***, P < 0.001).
FIG 7
FIG 7
Cell-to-cell transmission of BVDV requires both receptor recognition and clathrin-dependent endocytosis. (A) Representative images of virus spread (red channel) in cells cultured in control medium or medium containing soluble E2 (rE2) or CD46 MAbs (αCD46). (B) Bar graph showing quantification of the absolute percentage of infected cells. Bars represent the means and standard deviations for three independent images. Data were analyzed by one-way ANOVA with Dunnett’s post-test (***, P < 0.001). (C) Representative images of producer (red channel; ncpBVDV/mCherry-E2) and target (green channel; GFP) MDBK cells in control cocultures (left) or cocultures in the presence of soluble E2 (middle) or CD46 MAbs (right). (D) Quantification of spreading. Bars represent the means and standard deviations of the percentages of infected target cells. At least a thousand total target cells were counted for each condition. Data were analyzed by one-way ANOVA with Dunnett’s post-test (*, P < 0.05; ***, P < 0.001). (E) Quantification of spreading from producer cells infected with ncpBVDV/mCherry-E2 (red channel) to target CRIB cells expressing GFP (green channel). Bars represent the means and standard deviations of the percentages of infected target cells. At least a thousand total target cells were counted for each condition. Data were analyzed by the unpaired t test (***, P < 0.001). (F) Representative images of producer MDBK cells cocultured with target MDBK cells overexpressing a control (DIIIΔ2) or dominant negative (EH29) Eps15 construct in the presence of neutralizing serum. (G) Quantification of spreading. Bars represent the means and standard deviations of the percentages of infected target cells. At least a thousand total target cells were counted for each condition. Data were analyzed by the unpaired t test (***, P < 0.001).

Similar articles

Cited by

References

    1. Richter V, Lebl K, Baumgartner W, Obritzhauser W, Kasbohrer A, Pinior B. 2017. A systematic worldwide review of the direct monetary losses in cattle due to bovine viral diarrhoea virus infection. Vet J 220:80–87. doi:10.1016/j.tvjl.2017.01.005. - DOI - PubMed
    1. Simmonds P, Becher P, Bukh J, Gould EA, Meyers G, Monath T, Muerhoff S, Pletnev A, Rico-Hesse R, Smith DB, Stapleton JT, ICTV Report Consortium. 2017. ICTV virus taxonomy profile: Flaviviridae. J Gen Virol 98:2–3. doi:10.1099/jgv.0.000672. - DOI - PMC - PubMed
    1. Collett MS, Larson R, Belzer SK, Retzel E. 1988. Proteins encoded by bovine viral diarrhea virus: the genomic organization of a pestivirus. Virology 165:200–208. doi:10.1016/0042-6822(88)90673-3. - DOI - PubMed
    1. Tautz N, Tews BA, Meyers G. 2015. The molecular biology of pestiviruses. Adv Virus Res 93:47–160. doi:10.1016/bs.aivir.2015.03.002. - DOI - PubMed
    1. Callens N, Brügger B, Bonnafous P, Drobecq H, Gerl MJ, Krey T, Roman-Sosa G, Rümenapf T, Lambert O, Dubuisson J, Rouillé Y. 2016. Morphology and molecular composition of purified bovine viral diarrhea virus envelope. PLoS Pathog 12:e1005476. doi:10.1371/journal.ppat.1005476. - DOI - PMC - PubMed

Publication types

MeSH terms

LinkOut - more resources