. 2019 Jan 17;93(3):e01378-18.
doi: 10.1128/JVI.01378-18. Print 2019 Feb 1.

Murine Cytomegalovirus Glycoprotein O Promotes Epithelial Cell Infection In Vivo

Affiliations

Murine Cytomegalovirus Glycoprotein O Promotes Epithelial Cell Infection In Vivo

Joseph Yunis et al. J Virol. .

Abstract

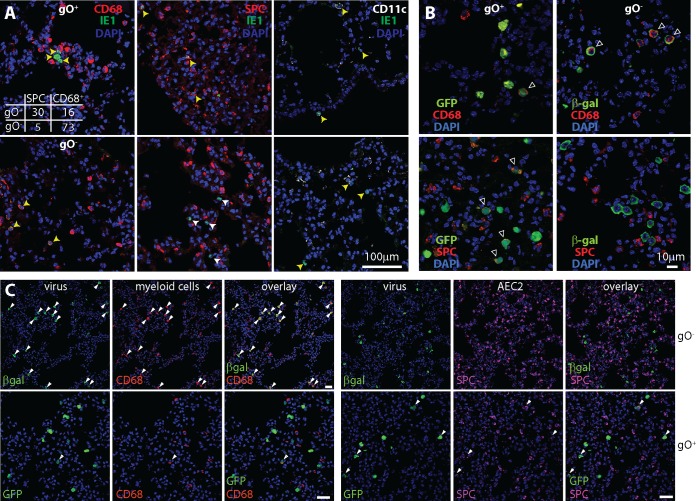
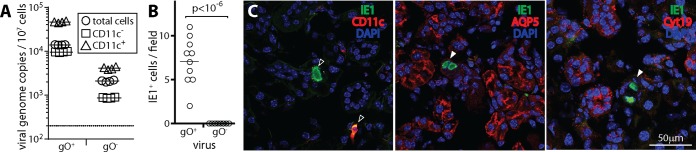
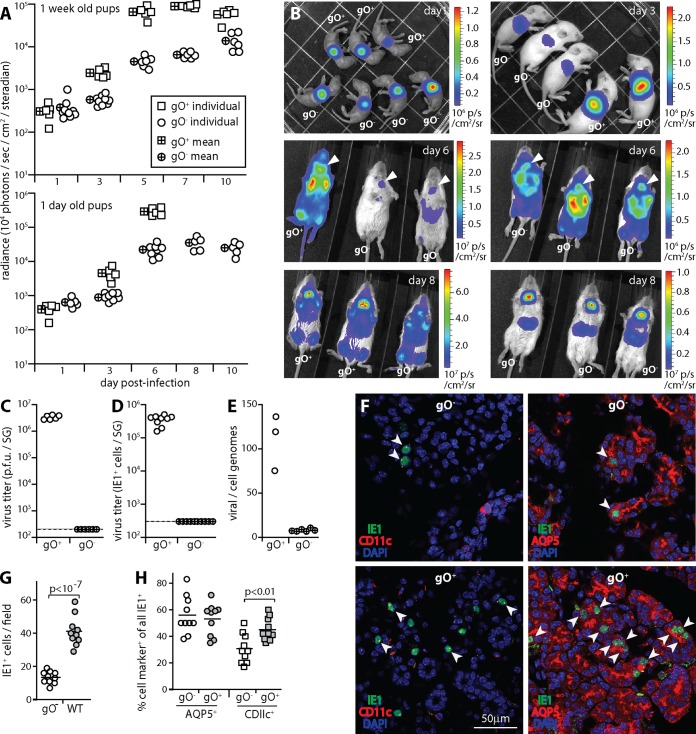
Cytomegaloviruses (CMVs) establish systemic infections across diverse cell types. Glycoproteins that alter tropism can potentially guide their spread. Glycoprotein O (gO) is a nonessential fusion complex component of both human CMV (HCMV) and murine CMV (MCMV). We tested its contribution to MCMV spread from the respiratory tract. In vitro, MCMV lacking gO poorly infected fibroblasts and epithelial cells. Cell binding was intact, but penetration was delayed. In contrast, myeloid infection was preserved, and in the lungs, where myeloid and type 2 alveolar epithelial cells are the main viral targets, MCMV lacking gO showed a marked preference for myeloid infection. Its poor epithelial cell infection was associated with poor primary virus production and reduced virulence. Systemic spread, which proceeds via infected CD11c+ myeloid cells, was initially intact but then diminished, because less epithelial infection led ultimately to less myeloid infection. Thus, the tight linkage between peripheral and systemic MCMV infections gave gO-dependent infection a central role in host colonization.IMPORTANCE Human cytomegalovirus is a leading cause of congenital disease. This reflects its capacity for systemic spread. A vaccine is needed, but the best viral targets are unclear. Attention has focused on the virion membrane fusion complex. It has 2 forms, so we need to know what each contributes to host colonization. One includes the virion glycoprotein O. We used murine cytomegalovirus, which has equivalent fusion complexes, to determine the importance of glycoprotein O after mucosal infection. We show that it drives local virus replication in epithelial cells. It was not required to infect myeloid cells, which establish systemic infection, but poor local replication reduced systemic spread as a secondary effect. Therefore, targeting glycoprotein O of human cytomegalovirus has the potential to reduce both local and systemic infections.

Keywords: cytomegalovirus; dissemination; glycoproteins; host colonization; pathogenesis; tropism.


Figures

FIG 1
FIG 1
Generation of gO-deficient MCMV. (A) Schematic map of M74 (genomic coordinates 104549 to 105865) showing the deleted region (coordinates 104564 to 105816) (dark shading) and the surrounding genes. M73 encodes gN. M75 encodes gH. The deleted region was replaced by an HCMV IE1-driven βgal expression cassette, as shown. A revertant virus was made by recombination back into the native M74 locus. (B) NIH 3T3 cells were infected (0.1 PFU/cell for 18 h) with wild-type (WT) or gO-deficient (gO) viruses and then fixed and stained for gO with mAb Cl.M74.01 (mouse IgG1) and for MCMV virion antigens with a polyclonal rabbit serum. Nuclei were stained with DAPI. Arrows show example infected cells. WT-infected cells show both MCMV antigens and gO (colocalization appears yellow); gO infected cells show only MCMV antigens (red). (C) NIH 3T3 cells were left uninfected (UI) or infected with WT, gO, or revertant (REV) viruses (0.1 PFU/cell for 18 h) and then fixed and stained for gO. Nuclei were stained with DAPI. Arrows show example gO+ cells. No strong staining was seen in the UI and gO samples. Some weak background staining probably reflects nonspecific mouse IgG binding by viral Fc receptors (46). (D) NIH 3T3 cells were infected or not (UI) with WT, gO, REV, M78-deficient (M78), or M131-deficient (M131) MCMV (0.1 PFU/cell). M78 and M131 MCMV provided specificity controls. After 48 h, the cells were lysed and analyzed by SDS-PAGE for expression of gB (mAb Cl.M55.02; mouse IgG2a), M131-129 (mAb Cl.MCK-2.04; mouse IgG1), gO (mAb Cl.M74.01; mouse IgG1), and M78 (rabbit pAb). This confirmed a lack of gO in gO MCMV. (E) Dilutions of WT and gO virions recovered from infected NIH 3T3 cell supernatants were lysed, resolved by SDS-PAGE, and then immunoblotted with a rabbit pAb to MCMV virion antigens. The number of PFU loaded per lane is shown for each virus. Arrows show bands present in WT but not gO samples. For the remaining bands, 105 PFU of WT MCMV was equivalent in protein content to 3 × 103 PFU gO MCMV, implying a 30-fold excess of particles per PFU for gO MCMV.
FIG 2
FIG 2
Replication of gO MCMV in vitro. (A) DNA was extracted from WT, gO, and REV virus stocks and compared for viral genome copies by QPCR. Viral copies were normalized by cellular copies of β-actin or by total DNA per reaction. Bars show means ± standard errors of the means (SEM) of data from triplicate samples. Across 3 independently produced stocks of each virus, there was no consistent difference in viral genome copies per cellular genome copy or per total amount of DNA. However, equivalent numbers of PFU yielded 10- to 100-fold more total DNA from gO than from WT virus stocks. (B) NIH 3T3, NMuMG, or RAW-264 cells were infected with equivalent PFU of WT, REV, or gO MCMV (0.01 or 1 PFU/cell for 2 h), washed with PBS, and cultured at 37°C. Triplicate samples at each time point were plaque assayed on MEFs. Each point shows the mean ± SEM. Time zero shows the redetermined titer of the input. For each cell type, the plaque yield of gO MCMV was significantly reduced. (C) WT and gO samples from the growth curves at 0.01 PFU/cell shown in panel B were assayed for viral genome loads by QPCR. Bars show means ± SEM of data from triplicate samples. Infected NMuMG cultures yielded significantly more gO genomes at 5 h but significantly more WT genomes thereafter (P < 10−4). Infected RAW-264 cell cultures showed no consistent differences between WT and gO genome loads. (D) Triplicate samples from growth curves at 0.01 PFU/cell on NIH 3T3 or RAW-264 cells were assayed for infectivity by incubation with 5 × 105 uninfected RAW-264 cells (18 h at 37°C) and then immunostaining for viral IE1 expression. gO+ MCMV (WT and REV) was compared with gO MCMV, including an independently derived mutant (gO IND). Each point shows the mean ± SEM of data from triplicate samples. Samples from NIH 3T3 cells showed significantly more gO+ than gO infection (P < 10−6). Those from RAW-264 cells showed no significant difference.
FIG 3
FIG 3
gO MCMV poorly penetrates nonmyeloid cells. (A) MEFs, NMuMG cells, and RAW-264 cells (RAW-264a and RAW-264b are both RAW-264 cells but were obtained from separate sources and thus were many passages separate) were exposed to WT or gO virions, with or without centrifugation (600 × g [spin 30 min]). Five hours later, the cells were fixed and stained for viral IE1 expression. Symbols show data for replicate infection wells, and bars show means. Without centrifugation, WT MCMV infected significantly more MEFs and NMuMG cells, and gO MCMV infected significantly more RAW-264 cells (P < 0.01). With centrifugation, only NMuMG cells showed more WT infection (P < 0.05), but the excess gO infection of RAW-264 cells was maintained (P < 0.01). (B) MEFs were adhered to 24-well plates and then incubated (37°C) with 200 PFU gO+ MCMV (WT and REV) or gO MCMV (2 independent mutants). At the times indicated, the cells were washed with PBS or pH 3 citrate buffer (acid) and then incubated for 4 days to allow plaque formation. The number of plaques per well is shown relative to control unwashed samples for each virus. Points show means ± SEM of data from triplicate wells. At each time point, acid washes had a significantly greater effect on gO titers than on gO+ titers. PBS washes showed no differential effect. Equivalent results were obtained in 2 repeat experiments. (C) In an experiment similar to the one in panel B, 500 PFU WT or gO MCMV was added to 5 × 105 RAW-264 cells, and the cells were washed in PBS or pH 3 citrate buffer (acid) at the times indicated. After overnight incubation, the cells were fixed and stained for viral IE1 expression. Each point shows the mean ± SEM for triplicate wells. In the experiment shown, the level of gO infection was somewhat lower than that of WT infection, as the input was reduced to give approximately equal infections, but gO infection showed no greater susceptibility to the acid wash.
FIG 4
FIG 4
gO MCMV replication in vivo. (A) BALB/c mice given WT, gO, or M131 MCMV i.n. (105 PFU) were plaque assayed for infectious virus 5 and 15 days later. gO MCMV yielded negligible infectivity from all sites. M131 MCMV was readily detected in lungs but yielded significantly less infectivity than the WT in blood at day 5 and in SG at day 15 (P < 0.01). Points show data for individual mice, and bars show means. (B) Genome loads in organs of the mice from panel A were measured by QPCR. gO genome loads were significantly lower than those of the WT at day 15 (P < 0.01) but not at day 5. (C) In a separate experiment, infectivity and viral genomes of BALB/c mice given WT or gO MCMV i.n. (105 PFU) were measured in lungs after 1 or 5 days and in SG after 5 or 15 days. Again, gO MCMV was undetectable by plaque assays. Lungs showed significantly more gO viral genomes than WT viral genomes at day 1 but not at day 5. SG showed significantly more WT viral genomes at day 15 but not at day 5. (D) BALB/c and C57BL/6 mice given WT, gO, or REV viruses i.n. (105 PFU) were assayed for infectivity and viral genomes 5 days later. gO MCMV yielded negligible infectivity. However, genome loads were similar for all viruses in lungs, MLN, and blood.
FIG 5
FIG 5
gO MCMV poorly infects lung epithelial cells. (A) BALB/c mice given gO+ MCMV (wild type) or gO MCMV i.n. (105 PFU) were analyzed 5 days later by staining lung sections for viral IE1 expression and the following cellular markers: CD68 (alveolar macrophages and some dendritic cells), SPC (AEC2), and CD11c (dendritic cells and some alveolar macrophages). gO+ MCMV infected CD68+, SPC+, and CD11c+ cells; gO MCMV infected CD68+ and CD11c+ cells but very few SPC+ cells. Representative images are shown. Yellow arrows show example IE1+ marker-positive cells. White arrows show example IE1+ marker-negative cells. The top left panel shows counts for IE1+ marker-positive cells across 3 representative sections for each of 3 mice per group. There was a significant bias of gO MCMV infection toward CD68+ cells (P < 10−6 by Fisher’s exact test). The number of CD11c+ cells infected was not significantly different between gO+ and gO MCMV. (B) BALB/c mice given gO+ or gO MCMV i.n. (105 PFU) were analyzed 1 day later by costaining lung sections for viral reporter genes (GFP for WT and βgal for gO MCMV) and cell markers as described above for panel A. Arrows show example dual-positive cells. (C) Lower-magnification images of mice infected as described above for panel B show the bias of gO+ MCMV toward and the strong bias of gO MCMV against AEC2 infection across more infected cells. More than 95% of the cells infected by gO MCMV were CD68+ (<5% SPC+), while >75% of the cells infected by gO+ MCMV were SPC+ (<25% CD68+), counting >200 cells for each virus (P < 10−6 by Fisher’s exact test). Arrows show examples of colocalization. Bars, 50 µm.
FIG 6
FIG 6
Poor SG infection by gO MCMV. (A) BALB/c mice were given gO+ MCMV (wild type) or gO MCMV i.n. (105 PFU). Five days later, blood leukocytes were separated by antibody capture into CD11c+ and CD11c fractions and then assayed for infection by QPCR of viral DNA. Total indicates unfractionated leukocytes. In this experiment, gO viral loads in the blood were lower than gO+ viral loads but were still readily detectable. Symbols show data for individual mice, bars show means, and the dotted line shows the limit of detection. For both gO+ and gO MCMV, CD11c+ cell enrichment significantly increased viral genome representation, while CD11c+ cell depletion significantly reduced it (P < 0.01). (B) SG sections at day 15 after i.n. infection show infected (IE1+) cells for gO+ but not gO MCMV. Counts were obtained from 3 sections for each of 3 mice per group. (C) Costaining for IE1 and cell type-specific markers shows that the infected cells in SG of gO+ MCMV-infected mice were predominantly CD11c+ (dendritic cells) (>90% CD11c+, counting >50 cells) rather than being positive for Aquaporin 5 (AQP5), a marker of SG acinar cells, or for cytokeratin-19 (Cyt19), a marker of SG duct cells, consistent with previously reported data (18). Open arrows show example marker-positive IE1+ cells, and filled arrows show example IE1+ marker-negative cells.
FIG 7
FIG 7
The spread of gO MCMV in pups is quantitatively impaired. (A) BALB/c pups were given luciferase-positive gO+ or gO MCMV i.n. (104 PFU). Infection was tracked by luciferin injection and live imaging of light emission for the whole mouse. In 6- to 8-day-old pups, gO+ signals were significantly higher than gO signals (P < 10−4) from infection day 3 onward. At infection day 1, there was no difference. Pups infected when they were 1 day old showed a similar pattern, but those infected with gO+ MCMV failed to thrive and thus were sacrificed at infection day 6. gO infection had no noticeable ill effects. (B) Example images of pups infected when they were 6 to 8 days old show that gO+ and gO luciferase signals had similar distributions, but from infection day 3 onward, gO+ signals were greater. Note the different sensitivity scales. Arrows at infection day 6 show SG signals. (C) SG taken 10 days after i.n. infection of 6- to 8-day-old pups with gO+ or gO MCMV were plaque assayed for infectious virus. Symbols show data for individual mice. The dashed line shows the limit of assay sensitivity. (D) SG taken 10 days after i.n. infection of 6- to 8-day-old pups were assayed for infection by overnight incubation of homogenate dilutions with 5 × 105 RAW-264 cells and then staining for viral IE1 expression and counting positive cells. Symbols show data for individual mice. The dashed line shows the limit of assay sensitivity. (E) SG taken 10 days after i.n. infection of 6- to 8-day-old pups were assayed for viral genomes by QPCR. Viral DNA copy numbers were normalized by the cellular DNA copy number for each sample. Symbols show data for individual mice. (F) SG sections from 6- to 8-day-old pups taken 10 days after i.n. infection with gO+ or gO MCMV were stained for viral IE1 antigen plus markers of dendritic cells (CD11c) or SG acinar cells (AQP5). Arrows show example dual-positive cells. (G) Total cell counts for randomly selected fields of view from 3 sections for each of 3 mice per group, as illustrated in panel F, show significantly more infected cells for gO+ than for gO MCMV. Symbols show data for individual sections, and bars show means. (H) The cell type of infection in SG, as illustrated in panel F, was determined by counting IE1+ CD11c+ and IE1+ AQP5+ cells across sections from 3 mice per group (>300 cells for gO+ MCMV and >100 cells for gO MCMV). Symbols show data for individual sections, with the number of marker-positive IE1+ cells expressed as a percentage of all IE1+ cells on the section. Bars show means. gO+ MCMV showed a higher proportion of CD11c+ infected cells than did gO MCMV and no difference in AQP5+ infected cells, so gO was not required for MCMV transfer to acinar cells.

Similar articles

Cited by

References

    1. Gillet L, May JS, Colaco S, Stevenson PG. 2007. Glycoprotein L disruption reveals two functional forms of the murine gammaherpesvirus 68 glycoprotein H. J Virol 81:280–291. doi:10.1128/JVI.01616-06. - DOI - PMC - PubMed
    1. Wang X, Kenyon WJ, Li Q, Müllberg J, Hutt-Fletcher LM. 1998. Epstein-Barr virus uses different complexes of glycoproteins gH and gL to infect B lymphocytes and epithelial cells. J Virol 72:5552–5558. - PMC - PubMed
    1. Hutt-Fletcher LM. 2016. The long and complicated relationship between Epstein-Barr virus and epithelial cells. J Virol 91:e01677-16. doi:10.1128/JVI.01677-16. - DOI - PMC - PubMed
    1. Gillet L, May JS, Stevenson PG. 2009. In vivo importance of heparan sulfate-binding glycoproteins for murid herpesvirus-4 infection. J Gen Virol 90:602–613. doi:10.1099/vir.0.005785-0. - DOI - PMC - PubMed
    1. Milho R, Frederico B, Efstathiou S, Stevenson PG. 2012. A heparan-dependent herpesvirus targets the olfactory neuroepithelium for host entry. PLoS Pathog 8:e1002986. doi:10.1371/journal.ppat.1002986. - DOI - PMC - PubMed

Publication types

Substances