. 2019 Jan 17;93(3):e01443-18.
doi: 10.1128/JVI.01443-18. Print 2019 Feb 1.

Induction and Suppression of NF-κB Signalling by a DNA Virus of Drosophila

Affiliations

Induction and Suppression of NF-κB Signalling by a DNA Virus of Drosophila

William H Palmer et al. J Virol. .

Abstract

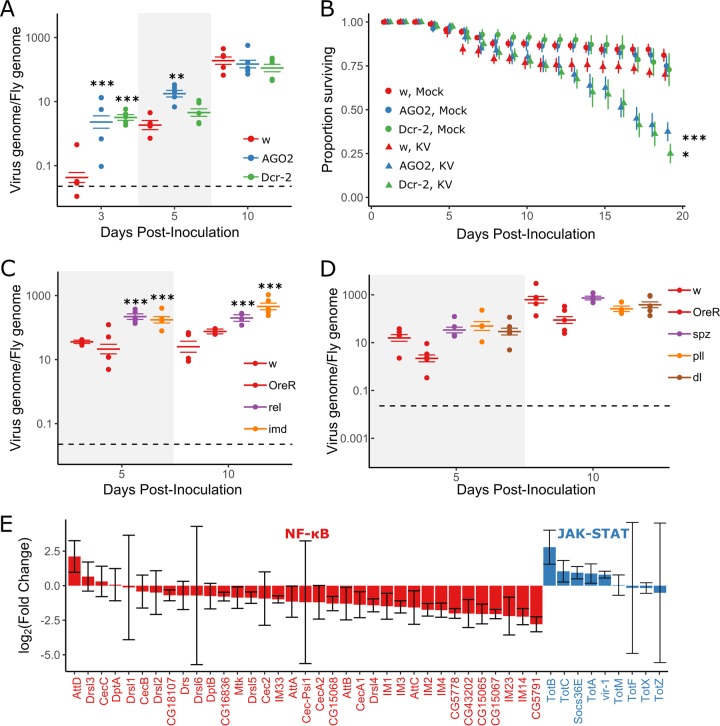
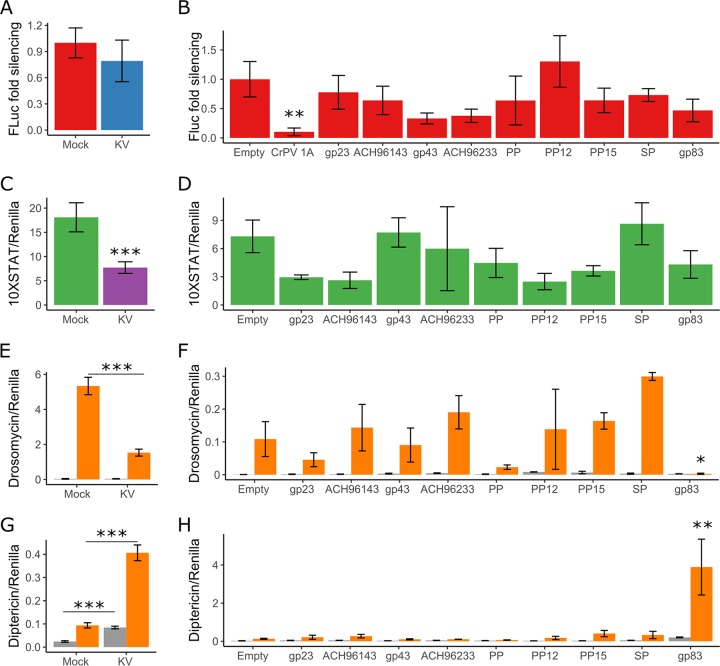
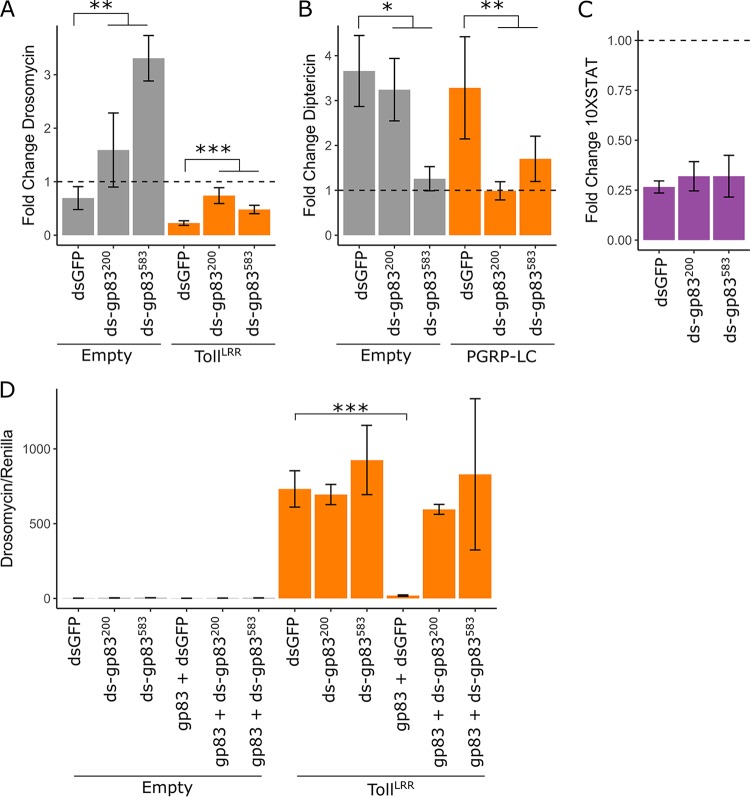
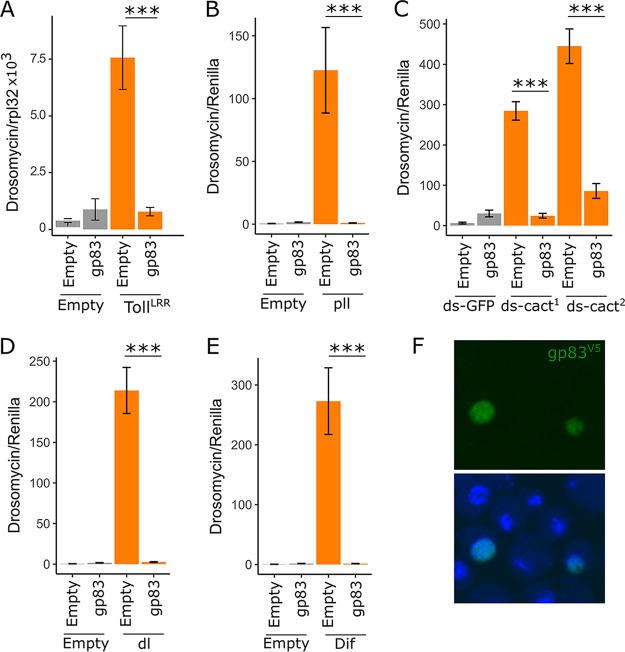
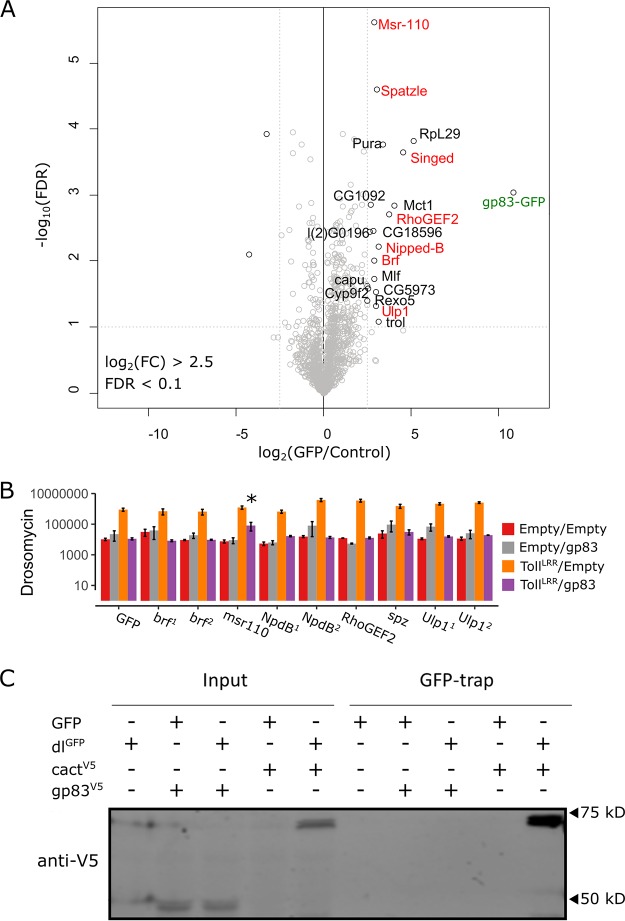
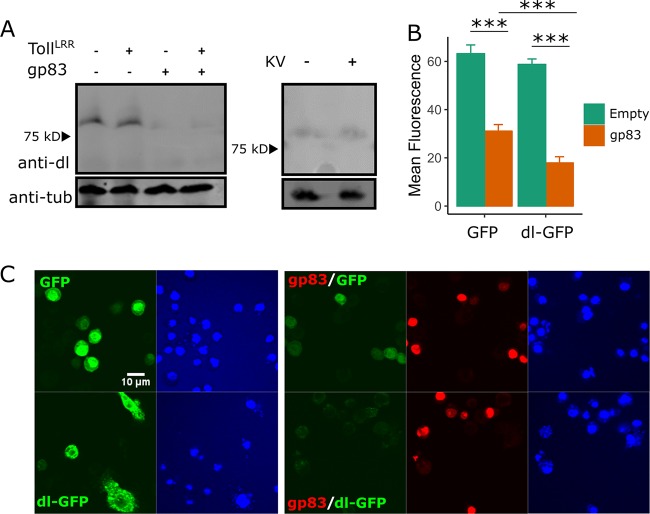
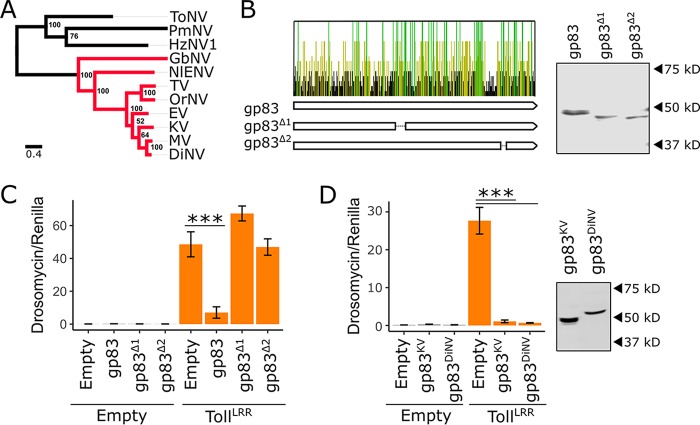
Interactions between the insect immune system and RNA viruses have been extensively studied in Drosophila, in which RNA interference, NF-κB, and JAK-STAT pathways underlie antiviral immunity. In response to RNA interference, insect viruses have convergently evolved suppressors of this pathway that act by diverse mechanisms to permit viral replication. However, interactions between the insect immune system and DNA viruses have received less attention, primarily because few Drosophila-infecting DNA virus isolates are available. In this study, we used a recently isolated DNA virus of Drosophila melanogaster, Kallithea virus (KV; family Nudiviridae), to probe known antiviral immune responses and virus evasion tactics in the context of DNA virus infection. We found that fly mutants for RNA interference and immune deficiency (Imd), but not Toll, pathways are more susceptible to Kallithea virus infection. We identified the Kallithea virus-encoded protein gp83 as a potent inhibitor of Toll signalling, suggesting that Toll mediates antiviral defense against Kallithea virus infection but that it is suppressed by the virus. We found that Kallithea virus gp83 inhibits Toll signalling through the regulation of NF-κB transcription factors. Furthermore, we found that gp83 of the closely related Drosophila innubila nudivirus (DiNV) suppresses D. melanogaster Toll signalling, suggesting an evolutionarily conserved function of Toll in defense against DNA viruses. Together, these results provide a broad description of known antiviral pathways in the context of DNA virus infection and identify the first Toll pathway inhibitor in a Drosophila virus, extending the known diversity of insect virus-encoded immune inhibitors.IMPORTANCE Coevolution of multicellular organisms and their natural viruses may lead to an intricate relationship in which host survival requires effective immunity and virus survival depends on evasion of such responses. Insect antiviral immunity and reciprocal virus immunosuppression tactics have been well studied in Drosophila melanogaster, primarily during RNA, but not DNA, virus infection. Therefore, we describe interactions between a recently isolated Drosophila DNA virus (Kallithea virus [KV]) and immune processes known to control RNA viruses, such as RNA interference (RNAi) and Imd pathways. We found that KV suppresses the Toll pathway and identified gp83 as a KV-encoded protein that underlies this suppression. This immunosuppressive ability is conserved in another nudivirus, suggesting that the Toll pathway has conserved antiviral activity against DNA nudiviruses, which have evolved suppressors in response. Together, these results indicate that DNA viruses induce and suppress NF-κB responses, and they advance the application of KV as a model to study insect immunity.

Keywords: Drosophila melanogaster; NF-κB; RNA interference; immune suppression; innate immunity.


Figures

FIG 1
FIG 1
RNAi and Imd pathways provide antiviral defense against Kallithea virus. Mutants for RNAi (A and B) and NF-κB (C and D) pathways were assayed for viral titer (A, C, and D) and mortality (B) following KV infection. Oregon R (OreR) and w1118 flies were used as wild-type controls. Viral titer was measured by qPCR, relative to Rpl32 DNA, where each data point represents a vial of 5 flies, and colored horizontal lines correspond to the mean titer and associated SE (A, C, and D). Horizontal dotted lines (A, C, and D) represent the amount of virus injected. (B) RNAi mutants (AGO2 and Dcr2) and w1118 controls were injected with chloroform-treated KV (mock) or KV, and survival was monitored each day. Each point is the mean number of surviving flies across 10 vials of 10 flies, with associated standard errors. (E) Log-transformed fold changes of presumed NF-κB-responsive genes (colored red; Cecropin, Diptericin, Attacin, Metchnikowin, Drosomycin and Drosomycin-like genes, Bomamins [i.e., IM1, CG18107, IM2, IM3, CG15065, CG15068, CG43202, CG16836, CG5778, IM23, CG15067, and CG5791)], and other IM genes) and JAK-STAT-responsive genes (colored blue; Socs36E, vir-1, and Turandot [Tot] family) following KV infection of OreR flies at 3 dpi, relative to uninfected controls (ERP023609; n = 5 libraries per treatment, with n = 10 flies per library [32]). Error bars show SEMs. *, P < 0.05; **, P < 0.01; ***, P < 0.001 (statistical tests were performed in MCMCglmm).
FIG 2
FIG 2
(A) KV replicates in cell culture. KV growth was assessed in various D. melanogaster cell lines by qPCR against the KV genome, relative to the fly gene Rpl32 (n = 3 for each time point). (B) KV release from S2 cells into the culture medium was assessed by DNA extraction of 50 μl of culture medium and qPCR against the KV genome, plotted relative to the amount of KV in the medium directly following infection (i.e., zero time point is equal to 1). (C) Cell density (number of cells per approximately 100 μm2 in KV versus mock-treated cells) at 10 dpi (n = 3). (D) Size of mock- or KV-infected cells at 10 dpi. Each dot represents a single cell, and the data distribution is presented as a violin plot. Error bars show SEMs.
FIG 3
FIG 3
Kallithea virus gp83 suppresses Toll and induces Imd signalling. The ability of KV (4 dpi) and 9 highly expressed KV genes to inhibit the RNAi (A and B), JAK-STAT (C and D), Toll (E and F), and Imd (G and H) pathways was assessed. For RNAi suppression assays (A and B), RNAi efficiency was assessed by transfecting S2 cells with plasmids expressing FLuc and, as a normalization control, Renilla luciferase (RLuc), along with dsRNA targeting either FLuc or GFP. Data are expressed as fold silencing in cells treated with GFP dsRNA relative to those treated with FLuc dsRNA, normalized to 1 in mock-infected cells. The CrPV suppressor of RNAi, protein 1A, was used as a positive control (data combined from 2 experiments). For JAK-STAT suppression assays (C and D), S2 cells were transfected with a plasmid encoding FLuc under the control of 10 STAT binding sites (10×STAT-FLuc). In contrast to the JAK-STAT pathway, the Toll and Imd pathways are not endogenously active in S2 cells (gray bars in E, F, G, and H) but can be activated by expression of TollLRR (orange bars in E and F) or PGRP-LC (orange bars in G and H). For Toll suppression assays (E and F), S2 cells were transfected with the Drs-FLuc reporter, encoding FLuc under the control of a Drosomycin promoter, with either pAc5.1-TollLRR or an empty control plasmid (gray bars). For Imd suppression assays (G and H), S2 cells were transfected with the Dpt-FLuc reporter, encoding FLuc under the control of a Diptericin promoter, with either pMT (empty) or pMT-PGRP-LC. All FLuc luciferase values were normalized to RLuc values, driven by a constitutively active Actin promoter from a cotransfected plasmid. PP, putative protein; SP, serine protease. Error bars show SEMs, calculated from 5 biological replicates for panels A, C, E, and G and at least 3 biological replicates for panels B, D, F, and H.
FIG 4
FIG 4
KV induction and suppression of NF-ΚB pathways are mediated by gp83. The ability of KV to inhibit Toll (A), induce Imd (B), and inhibit JAK-STAT (C) was assessed during gp83 knockdown, using two independent dsRNAs against gp83 (labeled ds-gp83200 and ds-gp83583). Drosomycin, diptericin, and 10×STAT activities were measured as Drs-FLuc, Dpt-FLuc, and 10×STAT-FLuc expression, relative to RLuc expression as described in the legend to Fig. 3. For each, data are presented as fold change in signalling following KV infection relative to mock infection (chloroform-treated KV) (4 dpi), where 1 (horizontal dotted line) represents no induction or suppression of the pathway by KV infection. (A) Fold change in Drs-FLuc expression following KV infection of S2 cells with (orange bars) or without (gray bars) activation of the pathway by TollLRR expression. (B) Fold change in Dpt-FLuc expression following KV infection of S2 cells with (orange bars) or without (gray bars) pathway activation by PGRP-LC expression. (C) Fold change in 10×STAT FLuc expression following KV infection of S2 cells. (D) Efficiency of gp83 knockdown was assessed by cotransfection of an expression plasmid encoding gp83 with two independent dsRNAs against gp83 and Drs-FLuc reporter plasmids. Error bars show SEMs (n = 5 biological replicates for panels A to C and n = 3 biological replicates for panel D).
FIG 5
FIG 5
gp83 inhibits Toll signalling downstream of Dif and dorsal. (A) The ability of gp83 to inhibit endogenous Drosomycin expression was assessed by transfection of S2 cells with pAc-gp83 or empty control plasmid, and the Toll pathway was activated by cotransfection of pAc-TollLRR or control plasmid. Drosomycin expression levels were measured relative to Rpl32 expression by qRT-PCR. (B to E) The Toll pathway was activated downstream of the Toll receptor by transfection of a plasmid encoding pll (B), knockdown of cactus with two independent, nonoverlapping dsRNAs (labeled ds-cact1 and ds-cact2) (C), and transfection of plasmids encoding the transcription factors dl and Dif (D and E). Activation of the pathway was assessed using the Drs-FLuc reporter, relative to RLuc expression (orange bars in panels B to E; gray bars represent controls in which empty plasmids [B, D, and E] or dsRNA targeting GFP [C] were transfected). Suppression of the Toll pathway at different stages by gp83 was assessed by cotransfection of pAc-gp83 or an empty control plasmid (B to E). (F) Representative confocal image of S2 cells expressing V5 epitope-tagged gp83 stained with a V5 antibody (top) and a merged image in which nuclei are stained with Hoechst (bottom). Error bars show SEMs (n = 5 biological replicates).
FIG 6
FIG 6
Identification of host interactors of gp83. (A) Identification of gp83 interacting proteins in S2 cell lysates by label-free quantitative (LFQ) mass spectrometry. Permutation-based FDR-corrected t tests were used to determine proteins that are statistically enriched in gp83-GFP immunoprecipitation (IP). The log2 LFQ intensity of gp83-GFP IP over control IP (cells that do not express gp83-GFP) is plotted against the −log10 FDR. The gp83-GFP bait (labeled in green) and interactors with an enrichment of fold change of >2.5; −log10 FDR values of >1 are indicated. (B) Drs-FLuc expression was measured following cotransfection of pAc-gp83, pAc-TollLRR, or empty control plasmids, along with dsRNA targeting brf, msr-110, Nipped-B, RhoGEF2, spätzle, and Ulp1 (labeled red in panel A), with dsRNA targeting GFP as a control. Genes are superscripted with “1” or “2” when two independent dsRNAs were used to knock down the gene. Although msr-110 knockdown appears to partially rescue gp83 immunosuppression, subsequent experiments did not reproduce this effect. Error bars represent SEMs (n = 3). Statistical tests were performed in MCMCglmm. (C) V5-tagged gp83 or V5-tagged cact (an IκB protein known to interact with dl) were expressed alongside GFP-tagged dl or GFP and GFP-associated complexes were immunoprecipitated with GFP-trap magnetic beads and analyzed by Western blotting using V5 antibodies. Note that cact appears to be stabilized when coexpressed with dl compared to when it is expressed alone.
FIG 7
FIG 7
Overexpression of gp83 may reduce dorsal levels. (A) Western blots show endogenous dl protein levels in S2 cells transfected with a plasmid encoding gp83 or empty control plasmid (left) and in S2 cells infected with KV (4 dpi) (right). The Toll pathway was activated by expression of pAc-TollLRR, as indicated. Western blot analysis using anti-tubulin antibody was used to verify equal loading. (B and C) The effect of gp83 was analyzed by confocal microscopy of S2 cells transfected with plasmid encoding gp83 or control plasmid and plasmids encoding either GFP or dl-GFP. ImageJ-based quantification of mean GFP fluorescence for individually outlined cells is shown (n ≥ 20 cells for each condition; error bars show SEMs). (C) A representative image from panel B, showing GFP (top) and dl-GFP (bottom) expression with or without gp83. Nuclei were visualized using Hoechst.
FIG 8
FIG 8
The immunosuppressive function of gp83 is evolutionarily conserved. (A) Maximum likelihood phylogeny inferred from a protein alignment of nudivirus-encoded DNA polymerase B using PhyML (83), with an LG substitution model and gamma-distributed rate parameter. Support for each node was assessed by bootstrapping, and the scale bar represents substitutions per site. Nudivirus species that encode gp83 homologs are colored in red. (B) Conservation of the gp83 amino acid sequence across 7 species of nudivirus (all red-labeled viruses in panel A, except the endogenized virus NlENV). Each bar represents an amino acid, and bars are colored yellow if the residue is conserved in ≥50% of the species, green if conserved in 100% of the species, and black if conserved in <50% of the species. Two V5-tagged gp83 constructs were created with deletions that span regions with an excess of conserved residues: gp83Δ1 and gp83Δ2. Western blotting and subsequent V5 antibody staining show that both deletion constructs accumulate to levels similar to those of full-length gp83 following transfection of S2 cells. (C) Full-length gp83, gp83Δ1, or gp83Δ2 was coexpressed with TollLRR, and Drs-FLuc expression was measured relative to pAct-FLuc expression. (D) V5-tagged gp83 from KV and DiNV were coexpressed with TollLRR to assess suppression of Drs-FLuc expression (relative to pAct-FLuc expression) in D. melanogaster S2 cells. Western blot analysis using V5 antibody was used to confirm gp83 expression. Error bars show SEMs (n = 5 biological replicates).

Similar articles

Cited by

References

    1. Merkling SH, van Rij RP. 2013. Beyond RNAi: antiviral defense strategies in Drosophila and mosquito. J Insect Physiol 59:159–170. doi:10.1016/j.jinsphys.2012.07.004. - DOI - PubMed
    1. Xu J, Cherry S. 2014. Viruses and antiviral immunity in Drosophila. Dev Comp Immunol 42:67–84. doi:10.1016/j.dci.2013.05.002. - DOI - PMC - PubMed
    1. Bronkhorst AW, van Rij RP. 2014. The long and short of antiviral defense: small RNA-based immunity in insects. Curr Opin Virol 7:19–28. doi:10.1016/j.coviro.2014.03.010. - DOI - PubMed
    1. Lamiable O, Imler JL. 2014. Induced antiviral innate immunity in Drosophila. Curr Opin Microbiol 20:62–68. doi:10.1016/j.mib.2014.05.006. - DOI - PMC - PubMed
    1. Palmer WH, Varghese FS, van Rij RP. 2018. Natural variation in resistance to virus infection in dipteran insects. Viruses 10:E118. doi:10.3390/v10030118. - DOI - PMC - PubMed

Publication types

MeSH terms

LinkOut - more resources