. 2019 Feb;18(2):277-293.
doi: 10.1074/mcp.RA118.001095. Epub 2018 Nov 7.

Assembly of the β4-Integrin Interactome Based on Proximal Biotinylation in the Presence and Absence of Heterodimerization

Affiliations

Assembly of the β4-Integrin Interactome Based on Proximal Biotinylation in the Presence and Absence of Heterodimerization

Satu-Marja Myllymäki et al. Mol Cell Proteomics. 2019 Feb.

Abstract

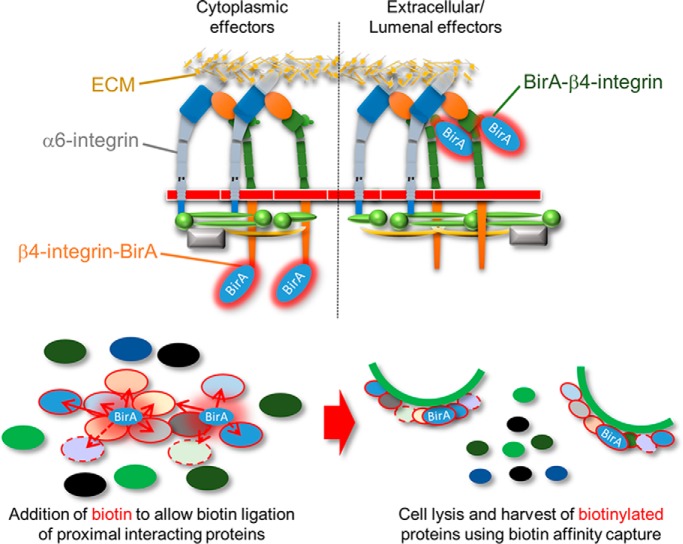
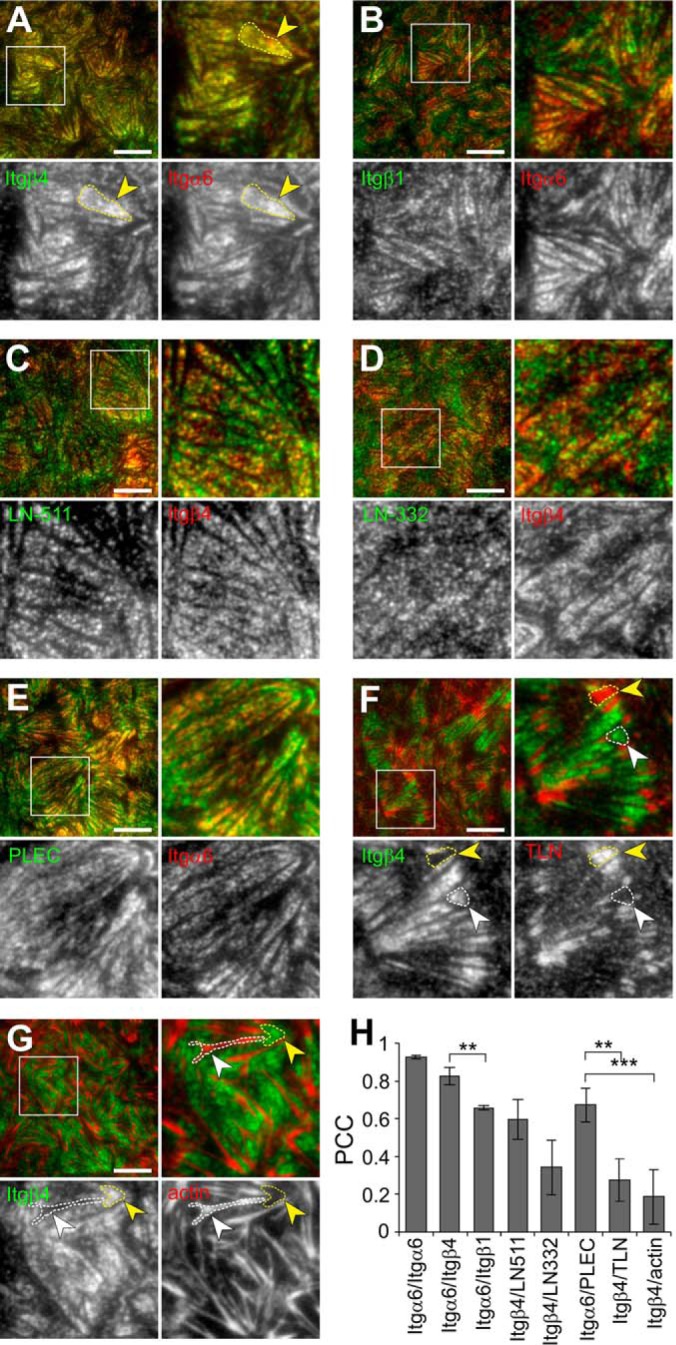
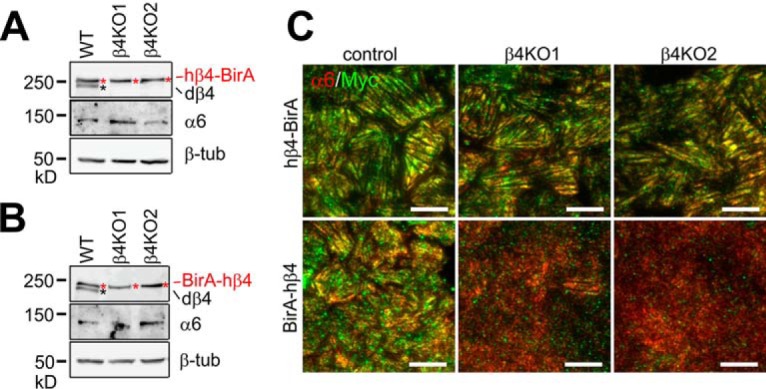
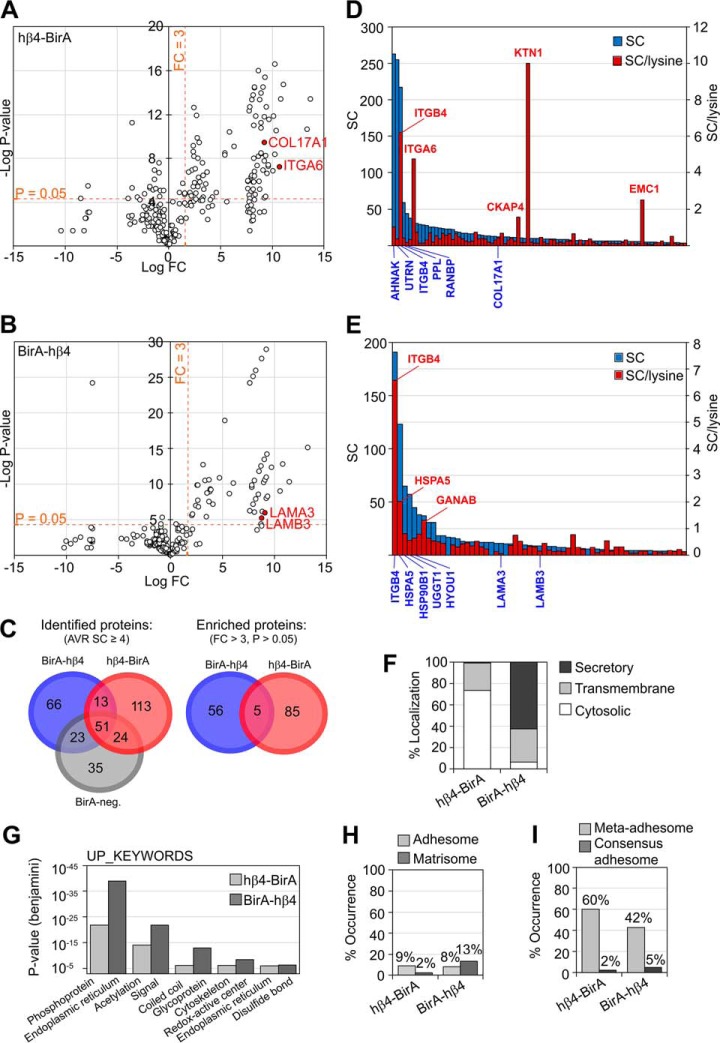
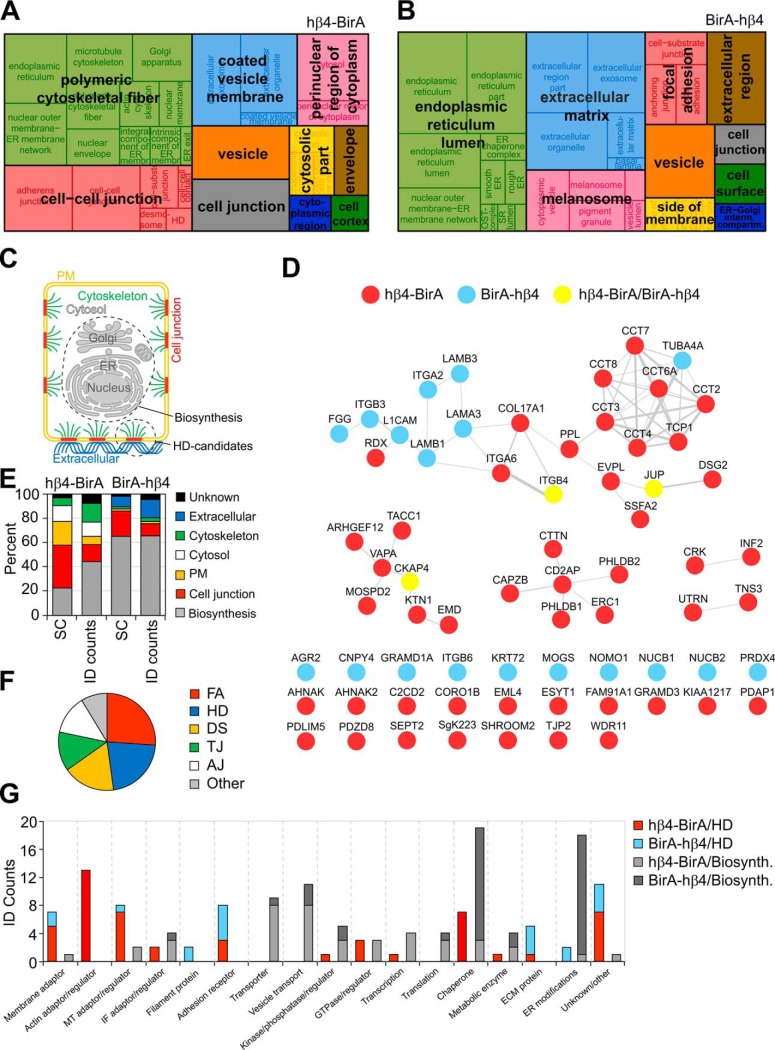
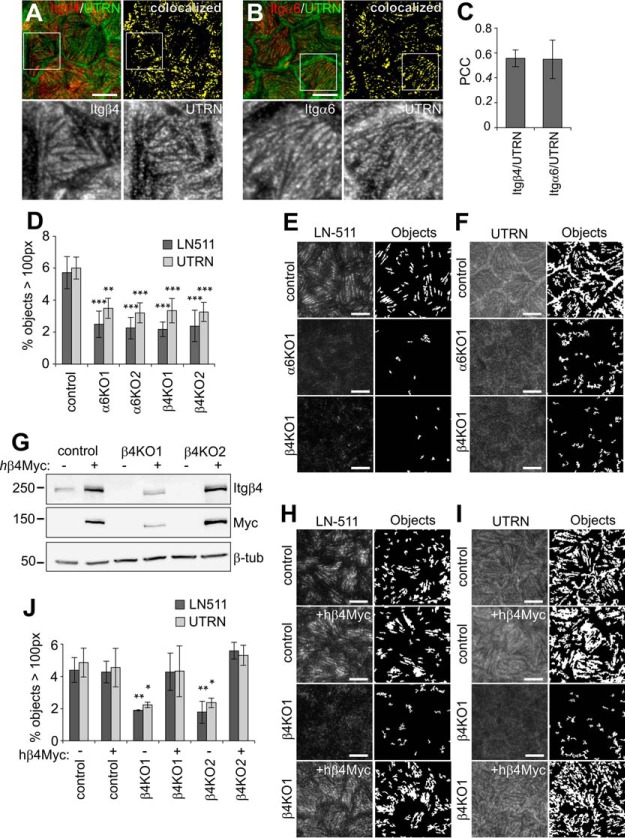
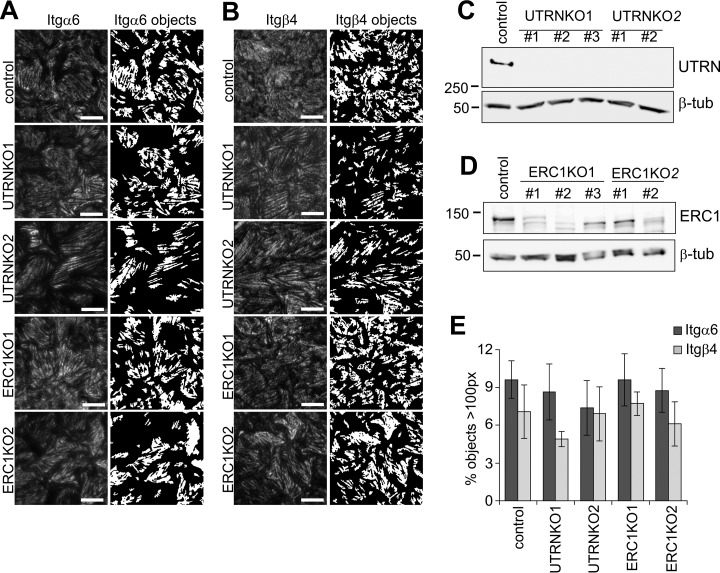
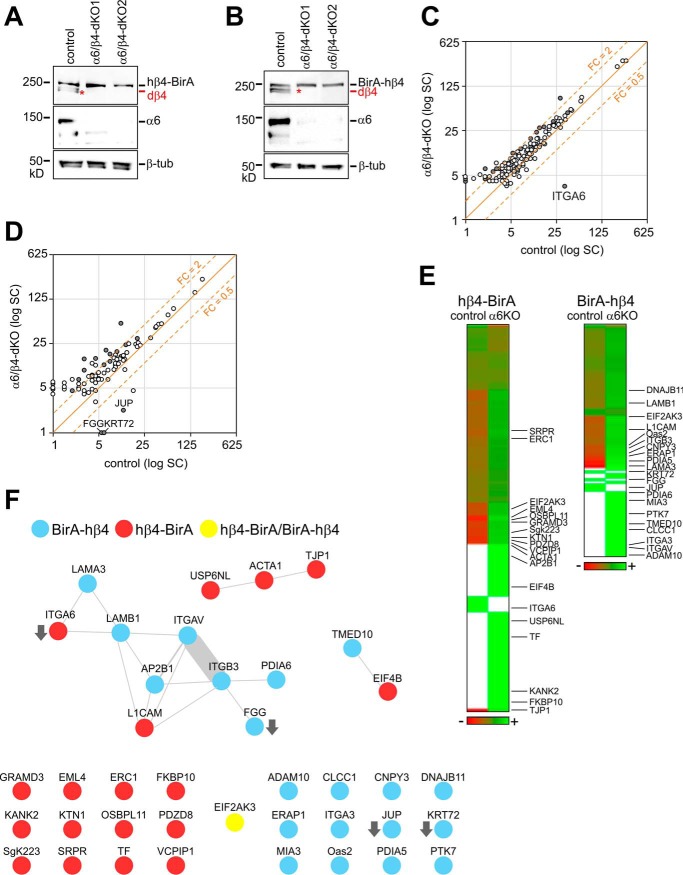
Integrin-mediated laminin adhesions mediate epithelial cell anchorage to basement membranes and are critical regulators of epithelial cell polarity. Integrins assemble large multiprotein complexes that link to the cytoskeleton and convey signals into the cells. Comprehensive proteomic analyses of actin network-linked focal adhesions (FA) have been performed, but the molecular composition of intermediate filament-linked hemidesmosomes (HD) remains incompletely characterized. Here we have used proximity-dependent biotin identification (BioID) technology to label and characterize the interactome of epithelia-specific β4-integrin that, as α6β4-heterodimer, forms the core of HDs. The analysis identified ∼150 proteins that were specifically labeled by BirA-tagged integrin-β4. In addition to known HDs proteins, the interactome revealed proteins that may indirectly link integrin-β4 to actin-connected protein complexes, such as FAs and dystrophin/dystroglycan complexes. The specificity of the screening approach was validated by confirming the HD localization of two candidate β4-interacting proteins, utrophin (UTRN) and ELKS/Rab6-interacting/CAST family member 1 (ERC1). Interestingly, although establishment of functional HDs depends on the formation of α6β4-heterodimers, the assembly of β4-interactome was not strictly dependent on α6-integrin expression. Our survey to the HD interactome sets a precedent for future studies and provides novel insight into the mechanisms of HD assembly and function of the β4-integrin.

Keywords: BioID; Cell Adhesion; Epithelium; Extracellular Matrix; Hemidesmosome; Integrin; Kidney Function or Biology; Mass Spectrometry; Protein Complex Analysis.


Conflict of interest statement

We declare that they have no conflicts of interest with the contents of this article

Figures

None
Graphical abstract
Fig. 1.
Fig. 1.
Integrin α6β4 colocalizes with plectin and laminin deposits at MDCK-HDs. A–G, TIRF microscopy of coimmunofluorescence stained integrin α6 (red) and β4 (green) (A), integrin α6 (red) and β1 (green) (B), integrin β4 (red) and laminin-511 (green) (C), integrin β4 (red) and laminin-332 (green) (D), integrin α6 (red) and plectin (green) (E), integrin β4 (green) and talin (red) (F), integrin β4 (green) and actin (red) (G). H, Quantification of colocalization between immunostained proteins in TIRF images by measuring Pearson's correlation coefficients (Mean ± S.D., n = 12–21 images from 3–4 experiments). Single comparisons were tested for significance with student′s two-tailed unpaired t test and multiple comparisons with one-way analysis of variance using Tukey′s post hoc test (**p < 0.01, ***p < 0.001). Scale bars = 10 μm.
Fig. 2.
Fig. 2.
Biotinylation of MDCK-HD associated proteins by integrin β4-BirA fusion constructs. A, Expression of Myc-tagged human integrin β4 subunit (hβ4; red asterisk) and Myc-β4 integrin-BirA fusion constructs (hβ4-BirA and BirA-hβ4) was analyzed by western immunoblotting. Myc-tagged BirA-hβ4 is seen as a full-length (blue arrowheads) and truncated (yellow arrowheads) forms. B, Surface expression of the above-mentioned ectopic hβ4-fusion constructs. Indicated MDCK cell lines were surface biotinylated, followed by immunoprecipitation of Myc-tagged integrin β4 constructs by using Myc-antibodies. Surface-expressed proteins were visualized using streptavidin-HRP. Endogenous integrin α6 coimmunoprecipitating with hβ4 and hβ4-BirA constructs is indicated in the blot. C, Coimmunofluorescence staining of Myc-tagged hβ4, hβ4-BirA and BirA-hβ4 (green) with endogenous integrin α6 (red) by TIRF microscopy. D, Colocalization between the different hβ4 constructs and endogenous integrin α6 measured by Pearson's correlation coefficient (Mean ± S.D., n = 16–20 images from three experiments). Statistical significance was determined with one-way analysis of variance using Tukey′s post hoc test (*p < 0.05). E, Biotinylated proteins were visualized in hβ4-, hβ4-BirA- and BirA-hβ4-expressing MDCK cells by SDS-PAGE followed by blotting with streptavidin-HRP (left panel). Equal loading was confirmed by ponceau staining (right panel) F, Coomassie staining of streptavidin-precipitated biotinylated proteins. G, Costaining of endogenous integrin α6 (green) and biotinylated proteins (red) in hβ4-BirA- and BirA-hβ4-expressing MDCK cells imaged with TIRF microscopy in the presence or absence of biotin. H, Colocalization was measured by Pearson's correlation coefficient (Mean ± S.D., n = 16–26 images from three experiments). Scale bars = 10 μm.
Fig. 3.
Fig. 3.
Deletion of endogenous integrin β4 impairs HD targeting of BirA-hβ4. A–B, Knockout of endogenous β4 integrin (dβ4, black asterisk) in MDCK cells expressing hβ4-BirA (red asterisks in A) and BirA-hβ4 (red asterisks in B) was confirmed by Western blotting using integrin β4-antibodies. Integrin α6 expression levels were also determined and β-tubulin blotting was used as a loading control. C, Colocalization of endogenous α6-integrin (red) with exogenous myc-tagged hβ4-BirA (green, upper panels) or BirA-hβ4 (green, lower panels) was analyzed by TIRF microscopy. Scale bars = 10 μm.
Fig. 4.
Fig. 4.
Interactomes of C- and N-terminally tagged integrin-β4 identified and quantified by LC-MS/MS. Volcano blots of hβ4-BirA (A) and BirA-hβ4 (B) labeled proteins whose SC is > 4 in the respective samples. C, Venn diagrams of all the proteins identified in hβ4-BirA, BirA-hβ4 and negative control samples (Identified proteins), and of proteins that were specifically enriched in hβ4-BirA (A) and BirA-hβ4 (B) samples (FC > 3, p value < 0.05 (two-tailed unpaired t test) indicated by dotted lines). D–E, Enriched proteins were ranked by total SC or by counts per the number of lysines available for biotinylation for both hβ4-BirA (D) or BirA-hβ4 (E). Only cytosolic or luminal sequences of the longest canine protein product (UniProt) were used for the counting of lysines in hβ4-BirA and BirA-hβ4 -enriched proteins, respectively. If membrane topology data was not available, domains were estimated based on alignment to the corresponding human sequence with known domain information. F, Distribution of hβ4-BirA and BirA-hβ4 biotinylated proteins between cytosolic compartment and secretory pathway based on UniProt entry information. G, Enrichment of non-redundant sequence features and protein domains between hβ4-BirA and BirA-hβ4 biotinylated proteins analyzed by DAVID. H, Occurrence of literature-curated adhesome (42) and matrisome components (63) and I, components identified from purified adhesions by mass spectrometry (6) within the interactomes of integrin β4.
Fig. 5.
Fig. 5.
Characterization of the HD candidate proteins in the β4-integrin interactome. A–B, hβ4-BirA (A) and BirA-hβ4 (B) enriched cell component GO terms were extracted from DAVID and non-redundant terms visualized with REVIGO treemap with the block size corresponding to the number of proteins. C, Identified proximal proteins were assigned into different subcellular compartments in order to resolve potential HD candidates (colored) from biosynthesis-related proteins (gray). D, HD candidates were represented as a protein-protein interaction network and arranged based on protein complexes where applicable. Weights of the node-connecting lines reflect the number of publications reporting the interaction. E, Representation of proteins in different subcellular compartments relative to total SC and ID counts. F, Occurrence of established junctional proteins within the integrin β4 proximal proteins based on UniProt keywords (FA - focal adhesion; HD - hemidesmosome; DS - desmosome; TJ - tight junction; AJ - adherens junction). G, Manual curation of proximal proteins into functional categories based on UniProt entry and literature search.
Fig. 6.
Fig. 6.
HD-formation and HD-targeting of utrophin depends on integrin α6β4. A–B, TIRF images showing coimmunostaining of integrins β4 (A) and α6 (B) (red) with utrophin (UTRN, green). Colocalized pixels are shown as bitmaps (yellow). C, Colocalization of α6 and β4 integrins with UTRN measured by Pearson's correlation coefficient (n = 12–15 images from three experiments). D, Quantification of segmented objects (>100 pixels; n = 16–32 images from 3–5 experiments were analyzed) from TIRF images of control, α6- and β4-KO cells stained for E, LN-511 and F, utrophin. G, Western immunoblot showing expression of Myc-tagged hβ4 in control and β4KO cells. H–I, TIRF-images and corresponding bitmaps of segmented laminin-511 (H) and UTRN (I) objects (>100 pixels) in control and β4KO cells with and without expression of hβ4. J, Quantification of segmentation data from H and I (n = 11–25 images from 3–5 experiments). Statistical significance tested with one-way analysis of variance using Tukey′s or Games-Howell′s (UTRN in J) post hoc test (**p < 0.01, ***p < 0.001). Scale bars = 10 μm.
Fig. 7.
Fig. 7.
Basal targeting of ERC1 is independent of integrin α6β4 expression. A–B, TIRF images showing coimmunostaining of integrins β4 (A) and α6 (B) (red) with ERC1 (green). Colocalized pixels are shown as bitmaps (yellow). C, Colocalization of α6 and β4 integrins with ERC1 measured by Pearson's correlation coefficient (n = 12–15 images from three experiments). D, TIRF images and corresponding bitmaps of segmented ERC1 objects (>100 pixels) in control, α6KO and β4KO cells. E, Quantification of ERC1 objects (n = 15–18 images from three experiments). F–G, TIRF images showing coimmunostaining of integrin β4 (F) and vinculin (VCL, G, (green) with ERC1 (red). Colocalized pixels are shown as bitmaps (yellow). H, Colocalization of β4 integrin and VCL with ERC1 measured by Pearson's correlation coefficient (n = 10 images from two experiments). Statistical significance was tested with one-way analysis of variance using Tukey′s or Games-Howell′s (ERC1 in E) post hoc test (not significant). Scale bars = 10 μm.
Fig. 8.
Fig. 8.
Utrophin and ERC1 are dispensable for HD targeting of integrin α6β4. A–B, TIRF images of integrin α6 (A) and β4 (B) in control, UTRNKO and ERC1KO MDCK cells. Bitmaps showing segmentations of objects that are bigger than 100 pixels (right panels). C, Western immunoblots showing knockout of Utrophin in MDCK cells. D, Knockout efficiency of ERC1 analyzed by western immunoblotting. E, Quantification of segmented objects in UTRN- and ERC1-KO MDCK cells (n = 20–34 images/four experiments for α6 and 8–9 images/two experiments for β4). Scale bars = 10 μm.
Fig. 9.
Fig. 9.
Efficient assembly of integrin β4 interactome in integrin α6 knockout MDCK cells. Knockout of α6 integrin subunits in MDCK β4-KO cells expressing hβ4-BirA (A) and BirA-hβ4 (B) was confirmed by Western blotting. Endogenous dog integrin-β4 (dβ4) is indicated by a red asterisk. C–D, Scatter blots showing average SC of hβ4-BirA (C) and BirA-hβ4 (D) enriched proteins in control and α6/β4-dKO cells with significantly changed genes (p < 0.05; unpaired two-tailed t test) labeled gray. E, Heatmap comparing protein abundances between control and α6KO samples based on normalized average SCs (green corresponds to lower and red to higher levels). Proteins included are those found specific in either or both samples (proteins not enriched are labeled in white) and significantly changed proteins are indicated by gene symbols. F, Interactions reported in PINA, iRefWeb, IntAct and BioGRID resources for proteins found significantly changed in KO versus control samples. Weights of the node-connecting lines reflect the number of publications reporting the interaction.

Similar articles

Cited by

References

    1. Hohenester E., and Yurchenco P. D. (2013) Laminins in basement membrane assembly. Cell. Adh. Migr. 7, 56–63 - PMC - PubMed
    1. Matlin K. S., Myllymäki S. M., and Manninen A. (2017) Laminins in epithelial cell polarization: old questions in search of new answers. Cold Spring Harb. Perspect. Biol. 9, a027920. - PMC - PubMed
    1. O'Brien L. E., Jou T. S., Pollack A. L., Zhang Q., Hansen S. H., Yurchenco P., and Mostov K. E. (2001) Rac1 orientates epithelial apical polarity through effects on basolateral laminin assembly. Nat. Cell Biol. 3, 831–838 - PubMed
    1. Humphries J. D., Byron A., and Humphries M. J. (2006) Integrin ligands at a glance. J. Cell Sci. 119, 3901–3903 - PMC - PubMed
    1. Geiger T., and Zaidel-Bar R. (2012) Opening the floodgates: proteomics and the integrin adhesome. Curr. Opin. Cell Biol. 24, 562–568 - PubMed

Publication types