. 2018 Nov 20;115(47):12017-12022.
doi: 10.1073/pnas.1809088115. Epub 2018 Nov 7.

The geographic mosaic of coevolution in mutualistic networks

Affiliations

The geographic mosaic of coevolution in mutualistic networks

Lucas P Medeiros et al. Proc Natl Acad Sci U S A. .

Abstract

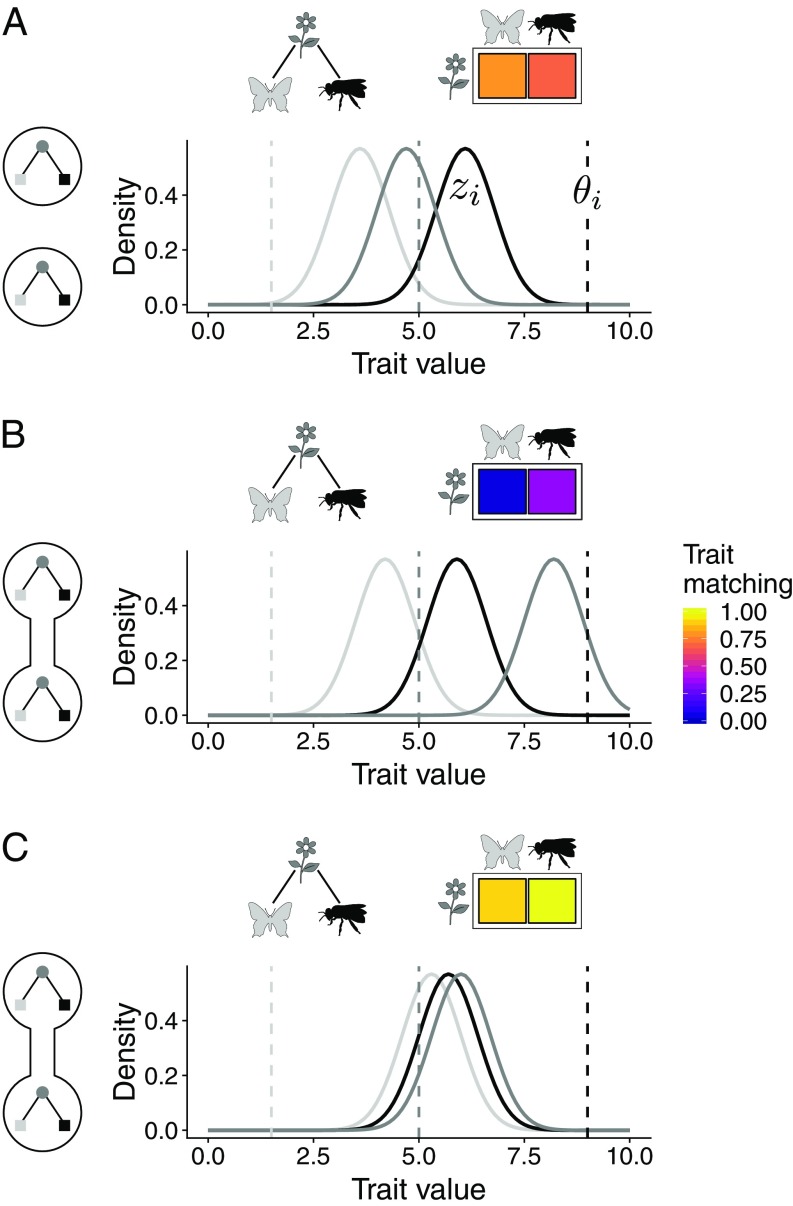
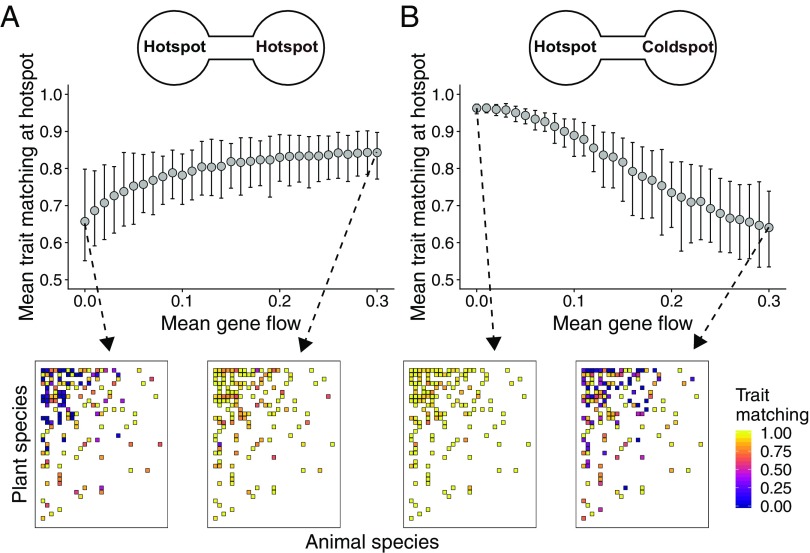
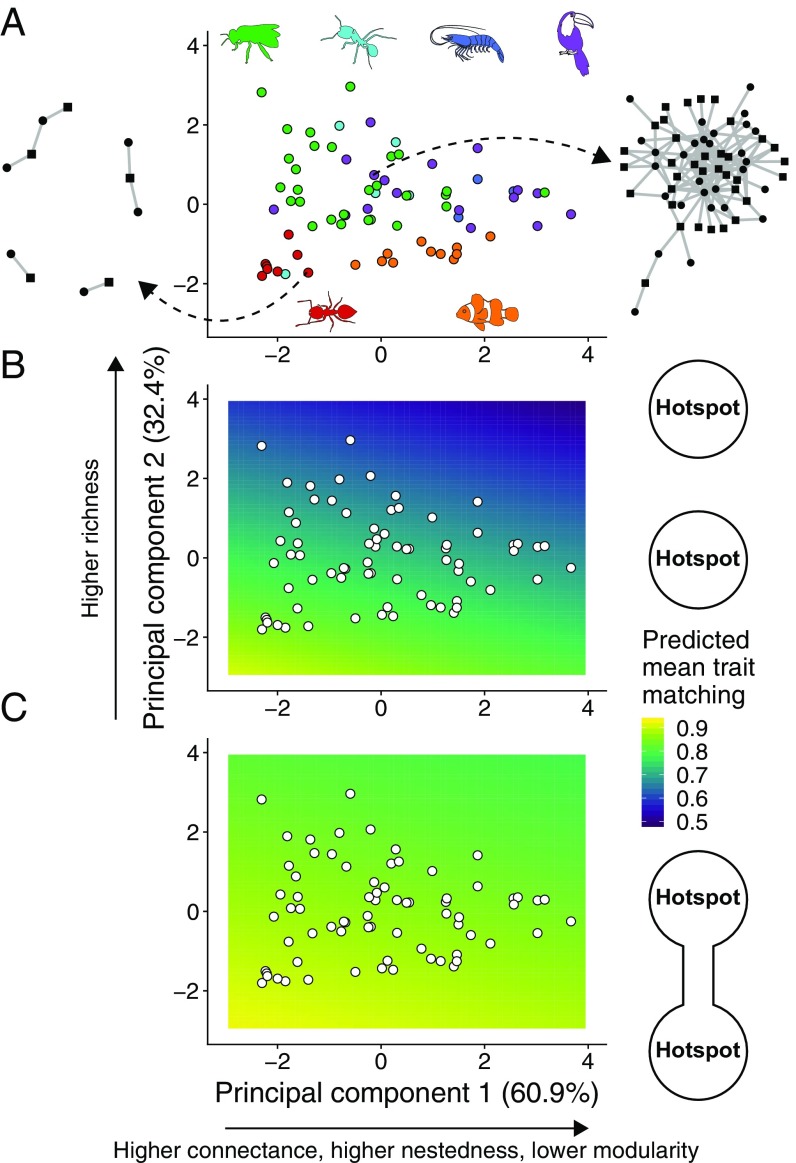
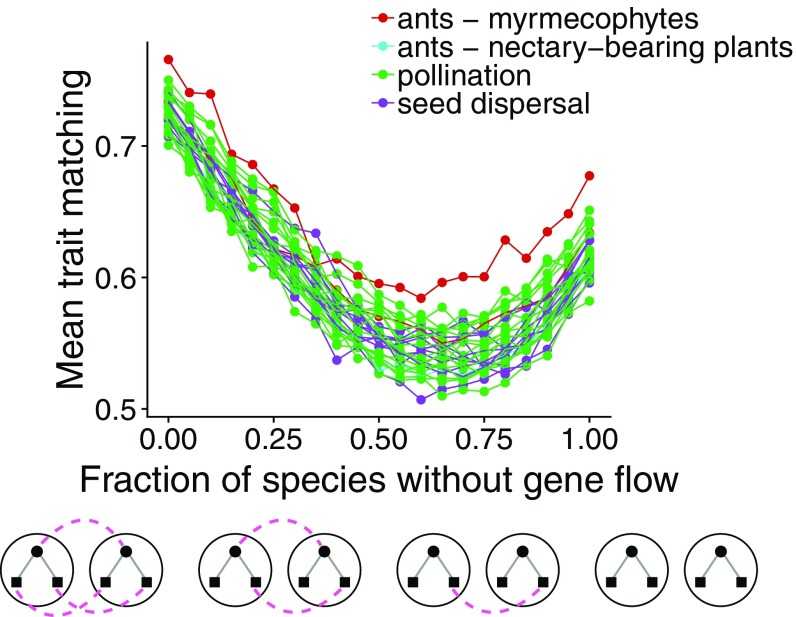
Ecological interactions shape adaptations through coevolution not only between pairs of species but also through entire multispecies assemblages. Local coevolution can then be further altered through spatial processes that have been formally partitioned in the geographic mosaic theory of coevolution. A major current challenge is to understand the spatial patterns of coadaptation that emerge across ecosystems through the interplay between gene flow and selection in networks of interacting species. Here, we combine a coevolutionary model, network theory, and empirical information on species interactions to investigate how gene flow and geographical variation in selection affect trait patterns in mutualistic networks. We show that gene flow has the surprising effect of favoring trait matching, especially among generalist species in species-rich networks typical of pollination and seed dispersal interactions. Using an analytical approximation of our model, we demonstrate that gene flow promotes trait matching by making the adaptive landscapes of different species more similar to each other. We use this result to show that the progressive loss of gene flow associated with habitat fragmentation may undermine coadaptation in mutualisms. Our results therefore provide predictions of how spatial processes shape the evolution of species-rich interactions and how the widespread fragmentation of natural landscapes may modify the coevolutionary process.

Keywords: coadaptation; ecological networks; gene flow; mutualism; trait matching.


Conflict of interest statement

The authors declare no conflict of interest.

Figures

Fig. 1.
Fig. 1.
Potential effects of gene flow on trait evolution in mutualistic networks. In this example, there are two sites in which the same two pollinator species interact with the same plant species. Each curve represents a trait distribution with mean zi of one population in one of the sites (light gray and black: pollinator species; dark gray: plant species). Dashed lines indicate the trait values favored by the local environment (θi). (A) In the absence of gene flow across sites, trait matching (colors in the interaction matrix) evolves because mutualistic interactions modify local adaptive landscapes. (B and C) Gene flow across sites with distinct selection regimes may shift species traits, further altering adaptive landscapes and trait patterns in two possible ways. (B) First, gene flow may induce trait mismatching. (C) Second, gene flow may strengthen the coadaptation pattern previously observed for the isolated assemblage.
Fig. 2.
Fig. 2.
Effects of gene flow on the evolution of trait matching in mutualistic networks. (A and B) Each point is the mean trait matching at equilibrium at the hotspot (τ¯A*) for 100 simulations parameterized with a seed dispersal network (network 64 in SI Appendix, Table S1), and bars show the 95% confidence interval. (A) When mutualistic selection is high at both sites (m¯A=m¯B=0.7), gene flow favors trait matching at each hotspot. (B) When mutualistic selection is high at only one site (m¯A=0.9, m¯B=0.1), gene flow reduces trait matching at the hotspot. Changes in mean trait matching (A and B) are a consequence of changes in the matching among generalist species, as shown in the interaction matrices (colors depict equilibrium pairwise trait matching for one simulation with the indicated value of gene flow). Sample distributions and values for simulation parameters: φi,A,φi,BN[μ=0.5,σ2=104], θi,AU[0,10], θi,BU[10,20], mi,AN[m¯A,104], mi,BN[m¯B,104], giN[g¯,106], and α=0.2.
Fig. 3.
Fig. 3.
Network structure, gene flow, and the emergence of trait matching in mutualistic networks. (A) PC1 and PC2 of a PCA using four network structure metrics measured for our 72 empirical networks. PC1 accounted for 60.9% of all variation and was strongly correlated with connectance (0.56), nestedness (0.58), and modularity (−0.56). PC2 accounted for 32.4% of all variation and was strongly correlated with species richness (0.81). Network structure was highly variable, as illustrated by an ants–myrmecophytes (Left, network 14 in SI Appendix, Table S1) and a seed dispersal (Right, network 64 in SI Appendix, Table S1) network. Types of mutualism: green, pollination; cyan, ants–nectary-bearing plants; dark blue, marine cleaning; purple, seed dispersal; red, ants–myrmecophytes; orange, anemones–anemonefishes. (B and C) Predicted mean trait matching at the hotspot (τ¯A*) for a linear model with PC1 and PC2 as explanatory variables and trait matching from simulations as the response variable (white points are the networks in A). (B) Species-poor, modular networks favored the emergence of trait matching in isolated hotspots (m¯=0.7, g¯=0, n = 100 simulations per network). (C) The effect of network structure is reduced when the two hotspots are connected by gene flow, and species-rich, nested networks may also favor high trait matching (m¯A=m¯B=0.7, g¯=0.3, n = 100 simulations per network). Simulation parameters as in Fig. 2.
Fig. 4.
Fig. 4.
Disruption of gene flow and its consequences for trait matching in mutualistic networks. Trait matching decreases as gene flow is progressively lost in mutualistic networks but increases slightly with an extreme loss of gene flow. Initially, all species in the network have a high value of gene flow (gi=0.3i), and species randomly lose gene flow until all species lack gene flow (gi=0i). Each point is the mean equilibrium trait matching at site A (τ¯A*) calculated with our analytical equilibrium expression using 10 different environmental optimum (θ) samples in each of 10 distinct simulations. Lines connect points from the same network, and different colors indicate different types of mutualism. Sample distributions and values for simulation parameters: φi,A=φi,B=1, θi,AU[0,10], θi,BU[10,20], mi,A=mi,B=0.5, and α=0.2.

References

    1. Thompson JN. The Geographic Mosaic of Coevolution. Univ of Chicago Press; Chicago: 2005.
    1. Hanifin CT, Brodie ED, Brodie ED. Phenotypic mismatches reveal escape from arms-race coevolution. PLoS Biol. 2008;6:0471–0482. - PMC - PubMed
    1. Pauw A, Stofberg J, Waterman RJ. Flies and flowers in Darwin’s race. Evolution. 2009;63:268–279. - PubMed
    1. McCann KS. Food Webs. Princeton Univ Press; Princeton: 2011.
    1. Bascompte J, Jordano P. Mutualistic Networks. Princeton Univ Press; Princeton: 2014.

Publication types