. 2018 Nov 20;115(47):E11015-E11024.
doi: 10.1073/pnas.1813053115. Epub 2018 Nov 7.

A flexible organic reflectance oximeter array

Affiliations

A flexible organic reflectance oximeter array

Yasser Khan et al. Proc Natl Acad Sci U S A. .

Abstract

Transmission-mode pulse oximetry, the optical method for determining oxygen saturation in blood, is limited to only tissues that can be transilluminated, such as the earlobes and the fingers. The existing sensor configuration provides only single-point measurements, lacking 2D oxygenation mapping capability. Here, we demonstrate a flexible and printed sensor array composed of organic light-emitting diodes and organic photodiodes, which senses reflected light from tissue to determine the oxygen saturation. We use the reflectance oximeter array beyond the conventional sensing locations. The sensor is implemented to measure oxygen saturation on the forehead with 1.1% mean error and to create 2D oxygenation maps of adult forearms under pressure-cuff-induced ischemia. In addition, we present mathematical models to determine oxygenation in the presence and absence of a pulsatile arterial blood signal. The mechanical flexibility, 2D oxygenation mapping capability, and the ability to place the sensor in various locations make the reflectance oximeter array promising for medical sensing applications such as monitoring of real-time chronic medical conditions as well as postsurgery recovery management of tissues, organs, and wounds.

Keywords: bioelectronics; flexible electronics; organic electronics; oximetry; wearable sensors.


Conflict of interest statement

Conflict of interest statement: A provisional patent application has been filed based on the technology described in this work.

Figures

Fig. 1.
Fig. 1.
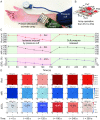
Overview and operation of the printed reflectance oximeter array (ROA). (A) Schematic of an application scenario of the ROA: 2D oxygenation mapping of a skin graft on the forearm. After surgery, the ROA is placed on the skin graft to map oxygenation of the reconstructed skin. (B) ROA sensor configuration. Red and NIR OLED arrays composed of 2×2 pixels each are placed side by side, where the pixels are arranged in a checkerboard pattern. The OPD array composed of 8 pixels is placed on top of the OLED arrays. The OLEDs are used as light emitters: I0(λ) is the incident light intensity. OPDs are used to collect the diffused reflected light, I(λ). The OLEDs and OPDs are spaced at d cm (emitter–detector spacing). μa(λ) is the absorption coefficient of the sensed tissue, which depends on the specific absorption coefficients and concentration of HbO2 and Hb, and DPF is the differential pathlength factor. (C) Photo of the ROA on top of a person’s forearm. (D) The molar extinction coefficients of HbO2 and Hb and the ratio of the molar extinction coefficients of Hb and HbO2. Three regions are shown: (i) green (εHb/εHbO2<2), (ii) red (εHb/εHbO2>6), and (iii) NIR (εHb/εHbO2<3). Either of the combinations of “red and green” or “red and NIR” can be used for oximetry.
Fig. 2.
Fig. 2.
Fabrication flow of the OLED and OPD arrays for the ROA. (A–D) The OLED and OPD array fabrication steps are shown side by side. For the OLED array, only one color consisting of 4 pixels is shown for simplicity—the same fabrication steps are used for red and NIR OLEDs. For the OPD array, the complete array consists of 8 pixels. (A) PEDOT:PSS is blade coated using surface energy patterning (SEP) on ITO-patterned PEN for the OLEDs and on a planarized PEN for the OPDs. (B) Active layers are blade coated—brick color indicates OLED active material and pink color indicates OPD active material. (C) Silver traces are screen printed on both OLEDs and OPDs. The OLEDs require an additional dielectric layer (blue) to prevent shorting of the anode to the cathode. (D) Aluminum cathode is evaporated, which defines the active area of the pixel. D, Insets show a zoomed-in view of the individual pixels. (E and F) The deposition techniques: Blade coating and screen printing are schematically shown and the color bars of the fabrication steps in A–C, Left indicate the deposition technique used for that respective layer: sky blue for blade coating and red for screen printing. (G and H) Device structure of the OLED and the OPD, respectively.
Fig. 3.
Fig. 3.
Photographs and performance parameters of the OPD and OLED arrays. (A) OPD array composed of 8 pixels with 2 pixels in each row. The rows are marked using different shades of brown markers, which represent the legends of performance data presented in C and D. (B) Red and NIR OLED arrays: 2 × 2 red OLED array in rows 1 and 3 and 2 × 2 NIR OLED array in rows 2 and 4. The rows are marked using red and gray markers, which represent the legends of performance data presented in F and G. (C) Current density vs. voltage bias (JV) plot for the OPD array. Here each trace represents mean of the data in that row, while the shaded region shows the range of the data. (D) EQE of the OPD pixels in the array as denoted by row position in accordance with the colors in A. (E) The frequency response of an OPD pixel. The 3-dB cutoff is at over 5 kHz. (F) JV characteristics of the red and NIR OLED arrays as denoted by row position in accordance with the colors in B. (G) EQE as a function of current density of OLED arrays. (H) Emission spectra of the red and NIR OLED arrays.
Fig. 4.
Fig. 4.
System design for reflectance oximetry and single-pixel reflection-mode pulse oximetry (SpO2r) results. (A) Reflectance oximeter system design. Each pixel of the ROA (one red and one NIR OLED and two OPDs) is connected to an AFE using analog switches, for both single-pixel and array operation. The AFE drives the OLEDs and reads out the OPD signal. The AFE is controlled using an Arduino Due microcontroller. The data are then collected using a universal serial bus (USB) interface and processed using custom software. (B) Setup for changing oxygen saturation of human volunteers. An altitude simulator varies the oxygen content of the air the volunteer breathes in via a facemask. The SpO2 is recorded using a commercial probe on the finger and the reflectance oximeter on the forehead. (C and D) Results from the commercial transmission-mode finger probe oximeter (SpO2t) and the reflectance oximeter (SpO2r), where the oxygen concentration is changed from 21% to 15%. Shown are the oxygen concentration of the air (C and D, Top, blue trace) and calculated oxygen saturation using SpO2t and SpO2r (C and D, Bottom, purple trace). (E and F) Zoomed-in data for the SpO2t in C and SpO2r in D during 240s<t<245s show the red channel, NIR channel, PPG peaks, heart rate, Ros, and SpO2.
Fig. 5.
Fig. 5.
In vivo 2D oxygen saturation monitoring with the ROA. (A) The ROA is placed on a volunteer’s forearm to monitor the change in oxygen saturation (ΔSO2). Blood supply to the forearm is controlled by a pressure cuff. The 4×4 devices of the ROA provide 3×3 oximeter pixels. (B) Oximeter pixel switching during the array operation. Each pixel is composed of one red and one NIR OLED and two OPDs. A raster scan from pixel 1 (Px1) to pixel 9 (Px9) is used to collect data from the tissue. (C) ΔSO2 for pressure-cuff–induced ischemia for a recording of 300 s. Red, NIR, and ΔSO2 data are shown as red, black, and purple dotted lines (dotted lines represent the means of the nine oximeter pixels, and error bars represent the SD of the data). Using the pressure cuff, blood supply to the forearm is occluded and restored. In the first 30 s, a baseline reading with no ischemia is taken. The pressure cuff is then inflated to 50 mmHg over the systolic pressure at 30s<t<150s and released at t=150 s. ΔSO2 varies from 0% under normal conditions to −9.3% (t=150s) under ischemia and to +8.4% (t=180s) immediately after releasing the pressure cuff. (D) Two-dimensional contour maps of red, NIR, and ΔSO2 under normal conditions (t=0s), under ischemia (t=60,120s), and after releasing the pressure cuff (t=180,240,300s).

References

    1. Webster JG. Design of Pulse Oximeters. Taylor & Francis; New York: 1997.
    1. Nakajimi S, Hirai H, Takase H, Kuze A, Aoyagi S. New pulsed-type earpiece oximeter. Respiration Circ. 1975;23:709–713. - PubMed
    1. Someya T, Bao Z, Malliaras GG. The rise of plastic bioelectronics. Nature. 2016;540:379–385. - PubMed
    1. Choi S, Lee H, Ghaffari R, Hyeon T, Kim DH. Recent advances in flexible and stretchable bio-electronic devices integrated with nanomaterials. Adv Mater. 2016;28:4203–4218. - PubMed
    1. Trung TQ, Lee NE. Flexible and stretchable physical sensor integrated platforms for wearable human-activity monitoring and personal healthcare. Adv Mater. 2016;28:4338–4372. - PubMed

Publication types