. 2018 Nov 7;3(6):e00534-18.
doi: 10.1128/mSphere.00534-18.

The Buoyancy of Cryptococcus neoformans Is Affected by Capsule Size

Affiliations

The Buoyancy of Cryptococcus neoformans Is Affected by Capsule Size

Raghav Vij et al. mSphere. .

Abstract

Cryptococcus neoformans is an environmental pathogenic fungus with a worldwide geographical distribution that is responsible for hundreds of thousands of human cryptococcosis cases each year. During infection, the yeast undergoes a morphological transformation involving capsular enlargement that increases microbial volume. To understand the factors that play a role in environmental dispersal of C. neoformans and C. gattii, we evaluated the cell density of Cryptococcus using Percoll isopycnic gradients. We found differences in the cell densities of strains belonging to C. neoformans and C. gattii species complexes. The buoyancy of C. neoformans strains varied depending on growth medium. In minimal medium, the cryptococcal capsule made a major contribution to the cell density such that cells with larger capsules had lower density than those with smaller capsules. Removing the capsule, by chemical or mechanical methods, increased the C. neoformans cell density and reduced buoyancy. Melanization of the C. neoformans cell wall, which also contributes to virulence, produced a small but consistent increase in cell density. Encapsulated C. neoformans sedimented much more slowly in seawater as its density approached the density of water. Our results suggest a new function for the capsule whereby it can function as a flotation device to facilitate transport and dispersion in aqueous fluids.IMPORTANCE The buoyancy of a microbial cell is an important physical characteristic that may affect its transportability in fluids and interactions with tissues during infection. The polysaccharide capsule surrounding C. neoformans is required for infection and dissemination in the host. Our results indicate that the capsule has a significant effect on reducing cryptococcal cell density, altering its sedimentation in seawater. Modulation of microbial cell density via encapsulation may facilitate dispersal for other important encapsulated pathogens.

Keywords: Cryptococcus neoformans; buoyancy; capsular polysaccharide; yeast density.


Figures

FIG 1
FIG 1
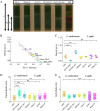
The cell density of C. neoformans and C. gattii serotypes. (A) Image representative of 3 to 4 independent repetitions of Percoll density gradients, comparing the cell densities of C. neoformans (serotypes A, D, and AD) and C. gattii (serotypes B and C) to that of density bead markers (DBM). (B) Representative data from 4 independent experiments, depicting the line interpolation of the density factor (minimum [min] and maximum [max]) calculated by pixel area per the following formulae: (fa1/f and fa2/f). The df (min, max) values of the density marker beads are used to estimate the cell density of the cells run in parallel gradients. (C) Histogram depicting the differences in cell densities of different serotypes of C. neoformans (serotypes A, AD, and D) and C. gattii (serotypes B and C and variants VGI and VGIIa). The experiment was performed 3 to 4 times, as indicated by the symbols on the bar graph. Error bars represent the SD about the mean. (D) Representative data of capsule (i) and cell body (ii) radii of different serotypes and strains (n = 3). Error bars represent the SD about the mean. One-way analysis of variance (ANOVA) was used for the comparisons of the cell densities and capsule and cell body radii of different strains and serotypes of C. neoformans and C. gattii to the respective measurements of strain H99 of C. neoformans. All comparisons were made to strain H99 of C. neoformans. The following symbols were used to annotate the statistical significance of the results: ns, P > 0.05; *, P ≤ 0.05; **, P ≤ 0.01; ***, P ≤ 0.001; ****, P ≤ 0.0001.
FIG 2
FIG 2
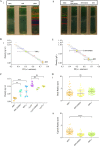
Induction of capsule synthesis decreases C. neoformans cell density. (A) Image representative of three independent repetitions of Percoll density gradients, showing the density of C. neoformans H99 juxtaposed with acapsular mutant cap59, both grown in Sab or MM. (B) Representative data from three independent experiments, depicting a line interpolation of the density factor with the cell densities of the bead standards to calculate the cell densities of the gradients run in parallel. (C) Histogram depicting a decrease in cell density of H99 cells grown in MM compared to Sab, due to capsule induction. cap59 mutant cells are significantly denser than normal H99 cells grown in MM. Each data point on the histogram represents an independent replicate (n = 3); error bars represent SD about the mean. (D) Representative data depict (i) the capsule radii and (ii) the cell body radii of C. neoformans H99 and cap59 grown under different medium conditions (MM or Sab) (n = 3). Strain cap59 cells grown in MM and Sab do not have a capsule; therefore, the capsule radii were not quantified. Error bars represent SD about the mean. One-way ANOVA was used for the comparisons of cell density, capsule density, and cell body radii of C. neoformans cap59 and H99 grown under different conditions. The following symbols were used to annotate the statistical significance of the results: ns, P > 0.05; *, P ≤ 0.05; **, P ≤ 0.01; ***, P ≤ 0.001; ****, P ≤ 0.0001.
FIG 3
FIG 3
Removal of C. neoformans polysaccharide capsule increases cell density. (A) (i) Image representative of five independent repetitions of Percoll density gradients, comparing the cell densities of irradiated (γ) and nonirradiated C. neoformans (H99) grown in MM for 10 days with a standard of colored uniform density beads. (ii) Image representative of four independent Percoll density gradients of encapsulated C. neoformans H99 strains grown in MM for 10 days before and after DMSO extraction. (B) Representative data from independent experiments, depicting a line interpolation of the density factor (df) with the cell densities of the bead standards, to calculate the cell densities of C. neoformans before and after extraction of the capsule, run in parallel. (C) A histogram depicting cell density of C. neoformans before and after capsule extraction by γ rays and DMSO. The experiments were performed 3 to 4 times independently as indicated by the symbols on the bar graph; error bars represent SD about the mean. One-way ANOVA was used to determine differences between the densities of strains H99 and cap59 grown in MM for 10 days with strains treated with DMSO and gamma radiation for capsule removal, respectively. (D) Representative data depict (i) the capsule radii and (ii) the cell body radii of C. neoformans before and after gamma irradiation capsule shedding and DMSO extraction (n = 3). Error bars represent SD about the mean. One-way ANOVA was used for the comparisons of cell densities and capsule densities and cell body radii of C. neoformans strain H99 to those of C. neoformans strain H99 after capsule removal by DMSO and gamma irradiation. The following symbols were used to annotate the statistical significance of the results: ns, P > 0.05; *, P ≤ 0.05; **, P ≤ 0.01; ***, P ≤ 0.001; ****, P ≤ 0.0001.
FIG 4
FIG 4
The densities of C. neoformans and C. gattii correlate with the capsule radii. (A) Density (in grams per cubic centimeter) significantly correlates with the capsule size (in micrometers). Data points are labeled such that, e.g., “H99 MM 10 days” represents C. neoformans strain H99 grown in MM for 10 days. (B) No linear relationship was found in comparisons of the cell body size data (radii) to the density data. The density values were collated from all the experiments performed under a specific condition (n = 3 to 5). The cell size data were taken from a single experiment corresponding to each condition whose results were found to be representative of the replicates.
FIG 5
FIG 5
Encapsulated C. neoformans settles more slowly in seawater. (A) An image representative of cuvettes (3 ml) containing PBS (left) and seawater (right) imaged at different time points shows that H99 grown in MM settles faster in PBS. The relative displacement of cell sedimentation was calculated as (f − u)/f, where f is the area of the tube and u is the area from the bottom of the tube to the upper menisci of layers of settling cells. At 5 min, the relative displacement of cell sedimentation in seawater was 0, since all the cells were floating. In contrast, by 5 min, a large population of yeast cells suspended in PBS had already sedimented. At 3 h, the relative displacement value for sedimentation in PBS was 1, as all the cells had completely settled. (B) Plot of the normalized displacement of the upper menisci of cells settling in seawater and PBS. A line is drawn through the mean value of relative displacement at a given time intervals and the error bars represent standard deviation about the mean (n = 3 independent experiments). At certain time intervals, the error bar is smaller than the symbol and was not been plotted.
FIG 6
FIG 6
Effect of melanization on C. neoformans cell density. (A) Image representative of four independent repetitions of Percoll density gradients, comparing the densities of H99 in MM and of H99 in MM with l-DOPA (mel) and a 1:1 mixture of the cells. The white cells (H99) banded slightly above the melanized black cells (mel), as can be seen by the visualization of the gradient that contained the mixture. (B) Representative data from four independent experiments, depicting a line interpolation of the density factor with the cell densities of the bead standards, to calculate the cell densities of the gradients run in parallel. (C) (i) A histogram depicting density of melanized and nonmelanized C. neoformans to compare the densities of melanized and nonmelanized cultures started from the same Sab preculture. The experiment was performed using replicates (n = 4), as indicated by the symbols on the bar graph. A paired t test found the pairing results to be significant (**) and found consistent and significant differences (*) between nonmelanized and melanized cells. (ii) A histogram depicting the density of melanized and nonmelanized cells after removal of capsule by gamma radiation. The experiment was performed in pairs, such that the paired cultures were inoculated from the same Sab preculture and were treated with gamma radiation (1,500 Gy) together. A paired t test found the pairing results to be significant (*) and found consistent and significant differences (*) between nonmelanized and melanized cells treated with gamma radiation. (D) Representative data depict (i) the cell body radii and (ii) the capsule radii of melanized and nonmelanized C. neoformans cells (n = 2). Error bars represent SD about the mean. t test was used for the comparisons of capsule and cell body radii of melanized and nonmelanized cells of strain H99 of C. neoformans. The following symbols were used to annotate the statistical significance of the results: ns, P > 0.05; *, P ≤ 0.05; **, P ≤ 0.01; ***, P ≤ 0.001; ****, P ≤ 0.0001.

Similar articles

Cited by

References

    1. Perfect JR. 2000. Cryptococcosis, p 79–93. In Atlas of infectious diseases. Current Medicine Group, London, United Kingdom.
    1. Ellis DH, Pfeiffer TJ. 1990. Natural habitat of Cryptococcus neoformans var. gattii. J Clin Microbiol 28:1642–1644. - PMC - PubMed
    1. Emmons CW. 1960. Prevalence of Cryptococcus neoformans in pigeon habitats. Public Health Rep 75:362–364. doi:10.2307/4590800. - DOI - PMC - PubMed
    1. Bartlett KH, Kidd SE, Kronstad JW. 2008. The emergence of Cryptococcus gattii in British Columbia and the Pacific Northwest. Curr Infect Dis Rep 10:58–65. doi:10.1007/s11908-008-0011-1. - DOI - PubMed
    1. MacDougall L, Kidd SE, Galanis E, Mak S, Leslie MJ, Cieslak PR, Kronstad JW, Morshed MG, Bartlett KH. 2007. Spread of Cryptococcus gattii in British Columbia, Canada, and detection in the Pacific Northwest, USA. Emerg Infect Dis 13:42–50. doi:10.3201/eid1301.060827. - DOI - PMC - PubMed

Publication types

MeSH terms

LinkOut - more resources