. 2018 Nov 7;15(11):2479.
doi: 10.3390/ijerph15112479.

Cigarette Smoking Modulation of Saliva Microbial Composition and Cytokine Levels

Affiliations

Cigarette Smoking Modulation of Saliva Microbial Composition and Cytokine Levels

Mary Rodríguez-Rabassa et al. Int J Environ Res Public Health. .

Abstract

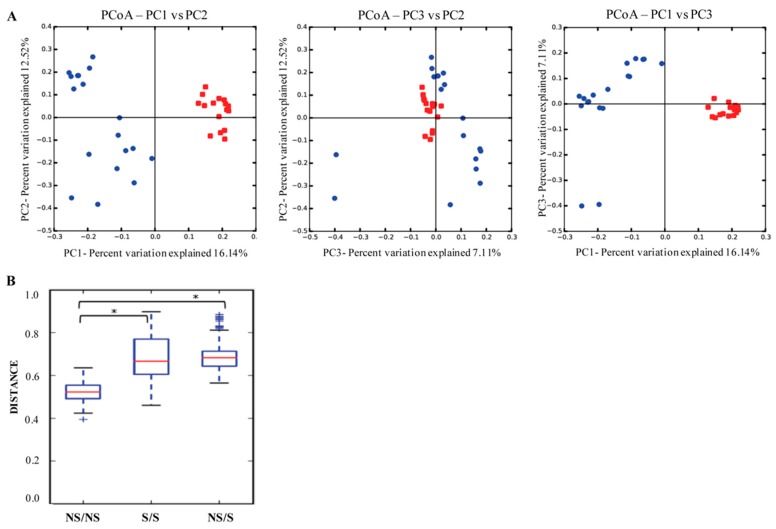
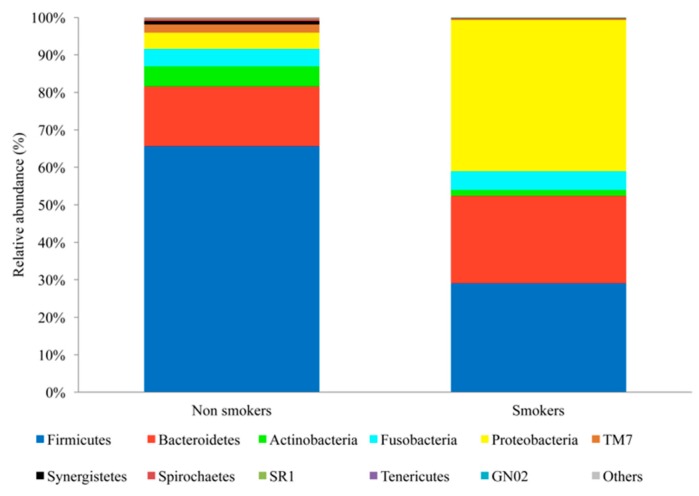
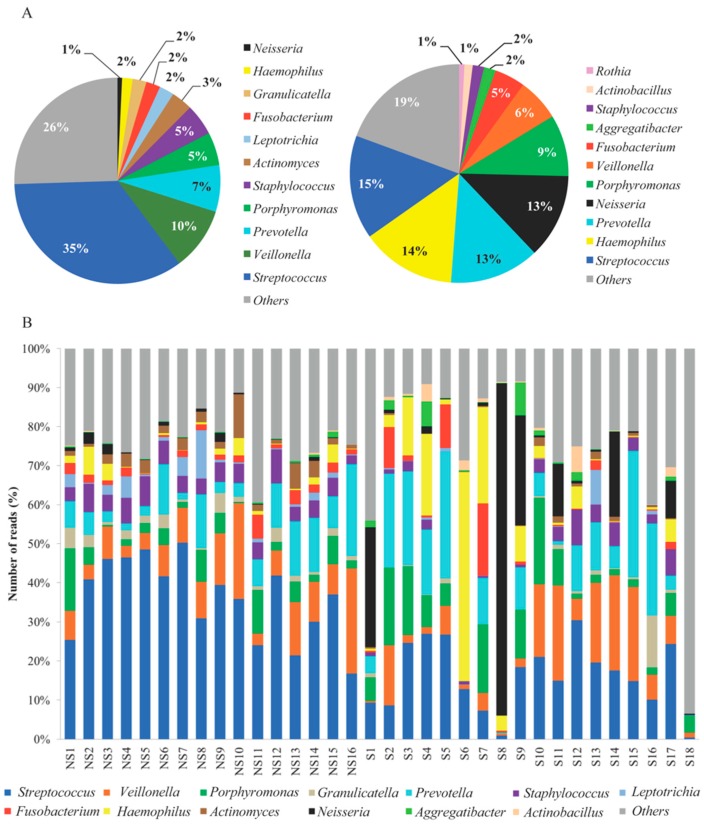
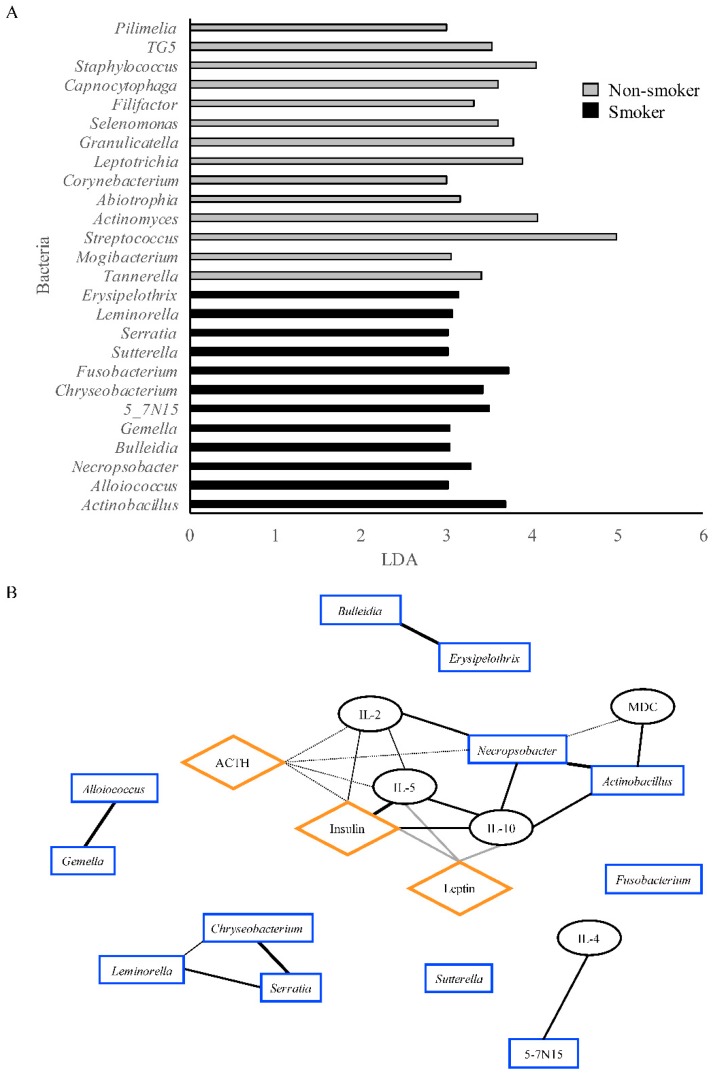
Tobacco use has been implicated as an immunomodulator in the oral cavity and contributes to the development of oral cancer. In the present study, we investigated the effects of cigarette smoking on bacterial diversity and host responses compared to healthy nonsmoking controls. Saliva samples were collected from eighteen smokers and sixteen nonsmoking individuals by passive drool. The 16S rRNA gene was used to characterize the salivary microbiome by using the Illumina MiSeq platform. Cytokine and chemokine expression analyses were performed to evaluate the host response. Significant differences in cytokine and chemokine expression levels of MDC, IL-10, IL-5, IL-2, IL-4, IL-7, adrenocorticotropic hormone (ACTH), insulin, and leptin were observed between smokers and nonsmokers. Taxonomic analyses revealed differences between the two groups, and some bacterial genera associated with the smokers group had correlations with hormones and cytokines identified as statistically different between smokers and nonsmokers. These factors have been associated with inflammation and carcinogenesis in the oral cavity. The data obtained may aid in the identification of the interactions between the salivary microbiome, host inflammatory responses, and metabolism in smokers.

Keywords: cytokines; microbiome; saliva; smoking; tobacco.


Conflict of interest statement

The authors declare no conflict of interest.

Figures

Figure 1
Figure 1
Clustering of samples from nonsmokers and smokers. (A) for beta diversity, principal coordinate analysis plots (PCoA) based on unweighted UniFrac distance were used to visualize the variation present in all samples by smoking status. Emperor web browser was used to perform the analysis. Significant cluster was observed in the saliva microbial community among smokers (blue dots) and nonsmokers (red dots). (B) unweighted UniFrac plot representing the intraindividual variability within nonsmokers (NS) and smokers (S). The asterisks (*) indicate a significant difference (nonparametric p-value with Bonferroni correction), where p = 0.01.
Figure 2
Figure 2
Taxonomic composition of nonsmokers and smokers at the phylum level. FASTA files were used to determine the taxonomy composition of each sample with a 97% similarity threshold using the Greengenes reference dataset.
Figure 3
Figure 3
Composition of the major genera observed in nonsmoker (NS; n = 16) and smoker (S; n = 18) saliva samples. (A) comparison of the taxonomic analyses at the genus level by group. (B) composition of the major genera by study participant. The bacterial abundance was established by the analysis of the 16S rRNA gene using a Quantitative Insights into Microbial Ecology (QIIME) pipeline.
Figure 4
Figure 4
Bacteria associations and correlation network integrating hormones, cytokines, and bacteria variables enriched in the smoker group. (A) LEfSe-associated bacteria with nonsmoker and smoker groups, with a p-value < 0.05 and linear discriminant analysis (LDA) >3.0. (B) correlation network of bacteria associated by LEfSE in the smoker group, and statistically significant hormones and cytokines. Only significant correlations are shown as determined by qgraph. Gray lines represent negative correlations, whereas black lines represent positive correlations. The line thickness determines the strength of the correlation.

References

    1. Ortiz A.P., Diaz-Toro E.C., Calo W.A., Correa-Fernandez V., Cases A., Santos-Ortiz M.C., Mazas C., Mejia L., Wetter D.W. Characteristics of smokers accessing the Puerto Rico quitline. Puerto Rico Health Sci. J. 2008;27:213–219. - PMC - PubMed
    1. Centers for Disease Control and Prevention State Tobacco Activities Tracking and Evaluation (State) System. [(accessed on 9 September 2018)]; Available online: https://www.cdc.gov/statesystem/cigaretteuseadult.html.
    1. Puerto Rico Department of Health Puerto Rico Chronic Disease Action Plan 2014–2020. [(accessed on 7 February 2018)]; Available online: http://www.iccp-portal.org/sites/default/files/plans/Puerto Rico Chronic....
    1. Stampfli M.R., Anderson G.P. How cigarette smoke skews immune responses to promote infection, lung disease and cancer. Nat. Rev. Immunol. 2009;9:377–384. doi: 10.1038/nri2530. - DOI - PubMed
    1. Warren G.W., Alberg A.J., Kraft A.S., Cummings K.M. The 2014 surgeon general’s report: “The health consequences of smoking—50 years of progress”: A paradigm shift in cancer care. Cancer. 2014;120:1914–1916. doi: 10.1002/cncr.28695. - DOI - PMC - PubMed

Publication types

LinkOut - more resources