. 2018 Nov 7;9(1):4667.
doi: 10.1038/s41467-018-07132-x.

PRKAA1/AMPKα1-driven glycolysis in endothelial cells exposed to disturbed flow protects against atherosclerosis

Affiliations

PRKAA1/AMPKα1-driven glycolysis in endothelial cells exposed to disturbed flow protects against atherosclerosis

Qiuhua Yang et al. Nat Commun. .

Abstract

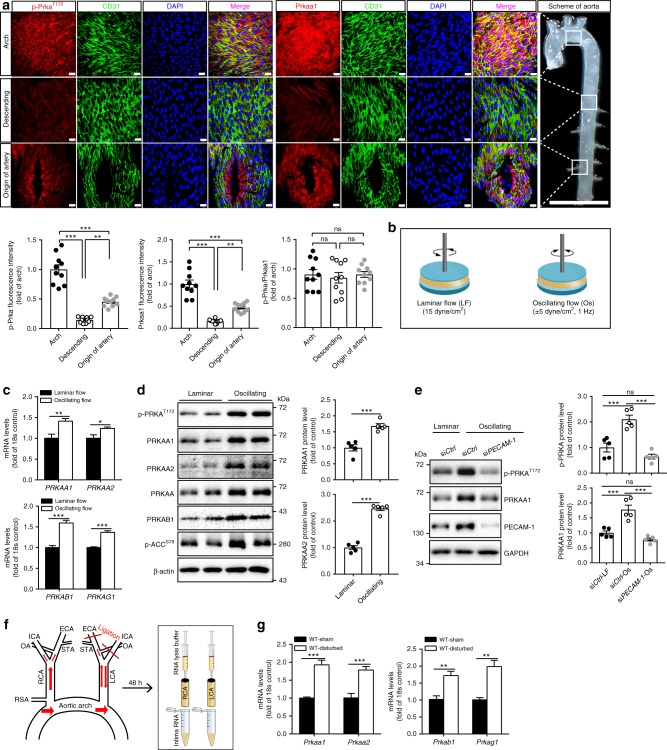
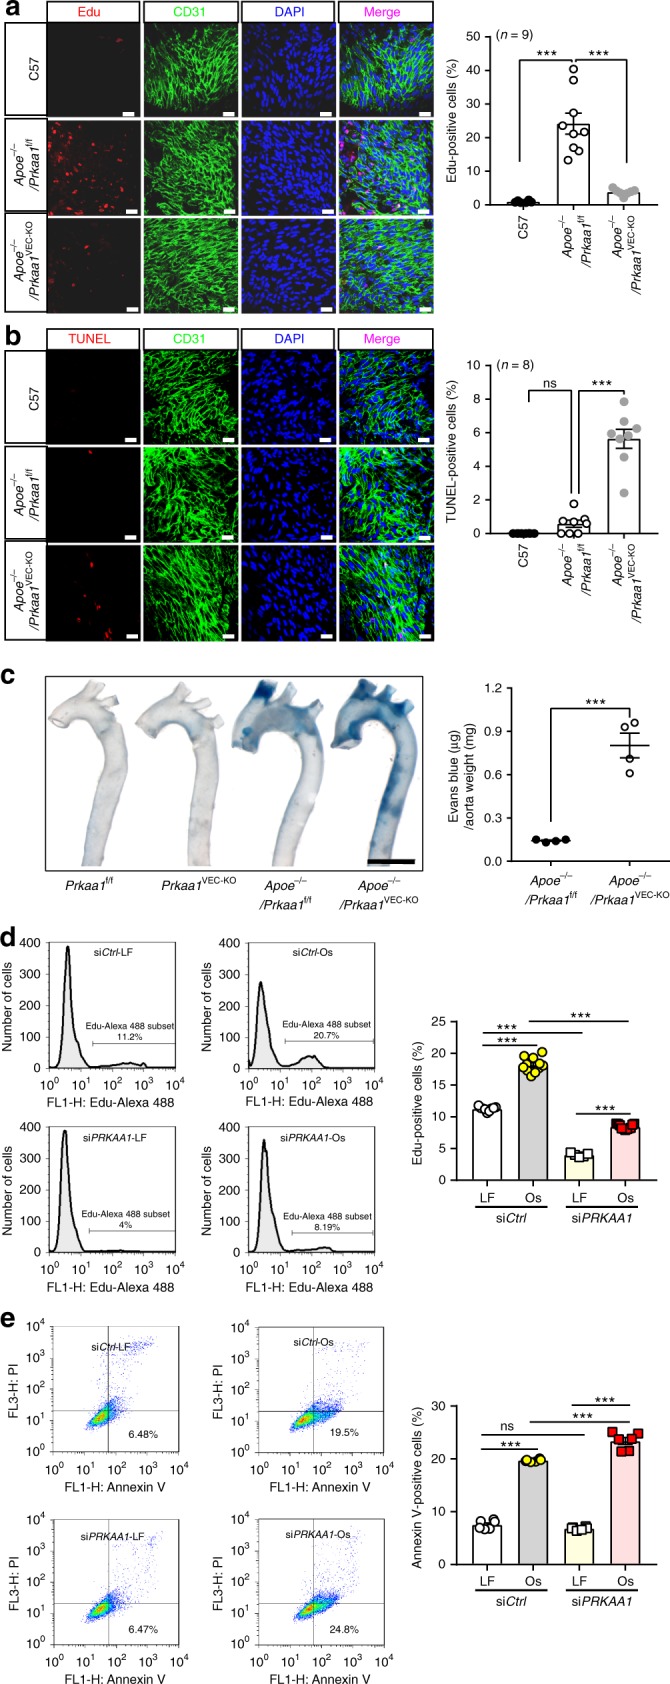
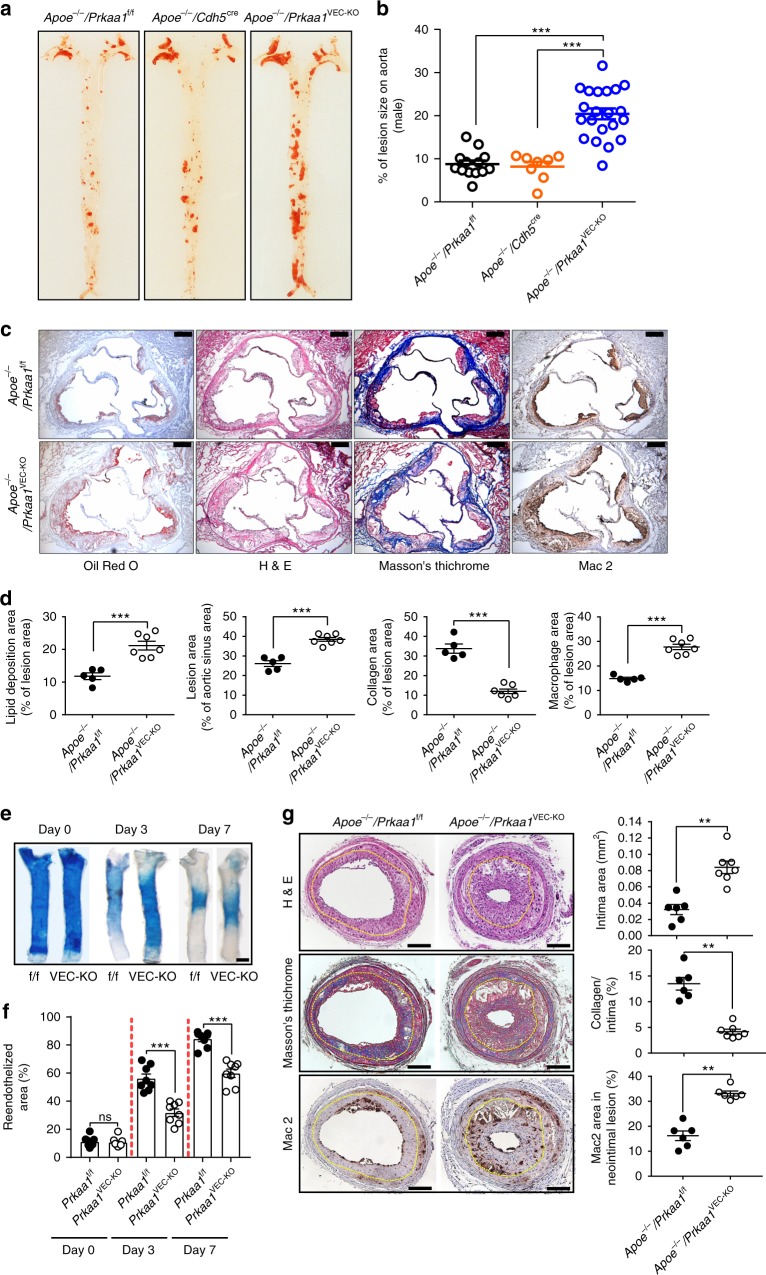
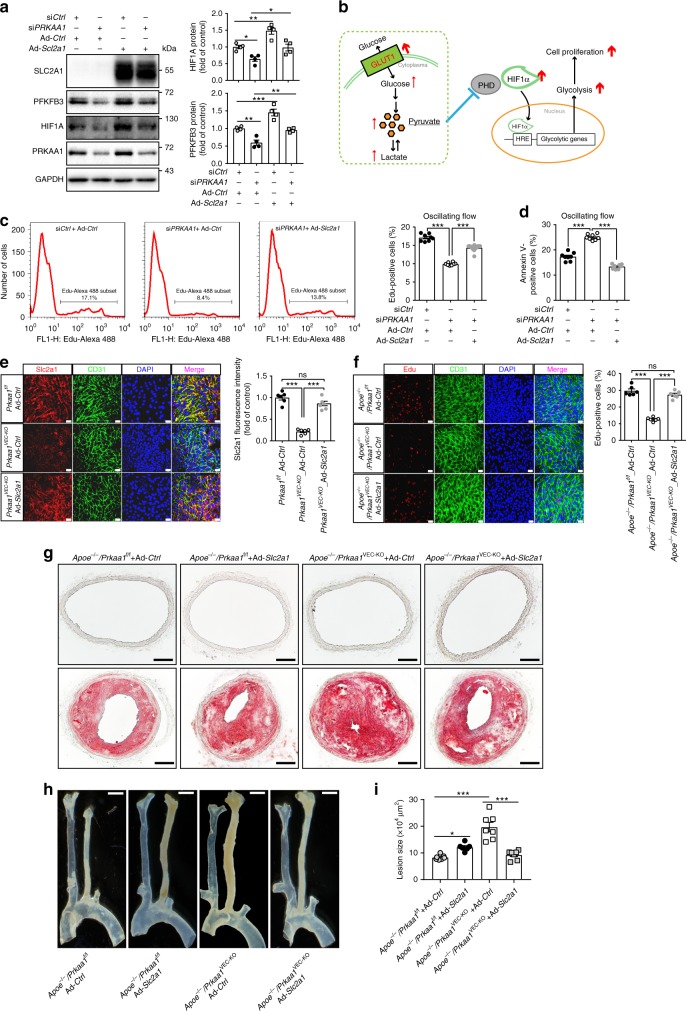
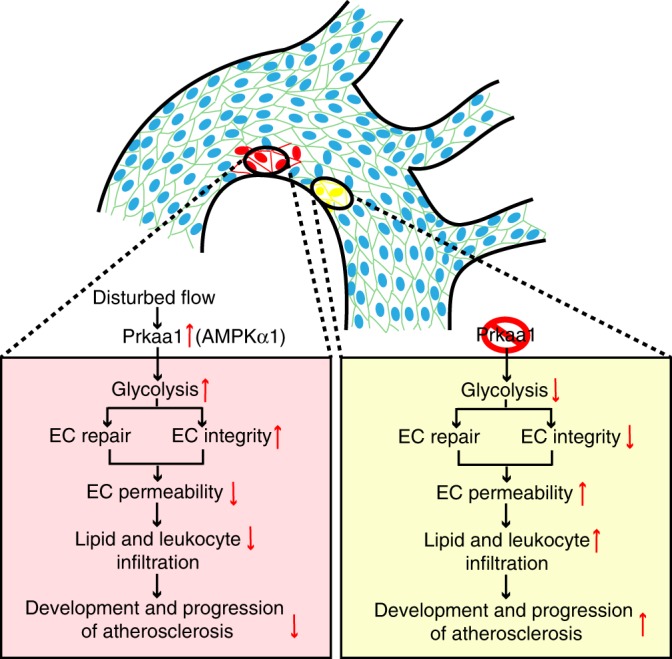
Increased aerobic glycolysis in endothelial cells of atheroprone areas of blood vessels has been hypothesized to drive increased inflammation and lesion burden but direct links remain to be established. Here we show that endothelial cells exposed to disturbed flow in vivo and in vitro exhibit increased levels of protein kinase AMP-activated (PRKA)/AMP-activated protein kinases (AMPKs). Selective deletion of endothelial Prkaa1, coding for protein kinase AMP-activated catalytic subunit alpha1, reduces glycolysis, compromises endothelial cell proliferation, and accelerates the formation of atherosclerotic lesions in hyperlipidemic mice. Rescue of the impaired glycolysis in Prkaa1-deficient endothelial cells through Slc2a1 overexpression enhances endothelial cell viability and integrity of the endothelial cell barrier, and reverses susceptibility to atherosclerosis. In human endothelial cells, PRKAA1 is upregulated by disturbed flow, and silencing PRKAA1 reduces glycolysis and endothelial viability. Collectively, these results suggest that increased glycolysis in the endothelium of atheroprone arteries is a protective mechanism.


Conflict of interest statement

The authors declare no competing interests.

Figures

Fig. 1
Fig. 1
Increased expression of Prkaa1/AMPK in ECs exposed to disturbed flow. a Representative images of en face immunofluorescence staining and quantification data of pPrkaa1 (Thr172) and Prkaa1 (red) levels in the arterial endothelium of C57BL/6j mice. The endothelium was visualized by CD31 staining (Alexa Fluor-488, green), and nuclei were counterstained with DAPI (blue). Images were captured with confocal fluorescence microscopy. Scale bar: 20 µm; n = 10 mice per group. Boxes in image on the right indicate origin of regions shown in the respective rows of images (scale bar: 5 mm). b Schematic illustration of laminar flow (shear stress: 15 dyne/cm2) and oscillating flow (shear stress: ± 5 dyne/cm2, frequency: 1 Hz) systems in vitro. c Real-time PCR analysis of mRNA levels of PRKAA1, PRKAA2, PRKAB1, and PRKAG1 in HUVECs under laminar flow and oscillating flow for 24 h. n = 4. d Western-blot analysis and quantification data of protein levels of pPRKA (Thr172), PRKAA1, PRKAA2, total PRKAA, PRKAB1, and pACC (Ser 79) in HUVECs under laminar flow and oscillating flow for 24 h. β-Actin was used as a loading control. n = 5. e Western-blot analysis and quantification data of the protein levels of pPRKA and PRKAA1 in HUVECs transfected with siCtrl and siPECAM-1 under laminar flow and oscillating flow for 24 h. n = 5. f Mouse partial carotid ligation model and intimal RNA extraction steps from carotid arteries following flushing arteries with QIAzol lysis reagent. g Real-time PCR analysis of mRNA levels of Prkaa1, Prkaa2, Prkab1, and Prkag1 in ECs obtained from sham-operated right common carotid arteries and partially ligated left common carotid arteries in C57BL/6j mice. n = 9 mice per group. All data were expressed as mean ± SEM. Statistical significance was determined by unpaired Student’s t-test (for c, d, g) and one-way ANOVA followed by Bonferroni test (for a, e). *p < 0.05 was considered significant, **p < 0.01, ***p < 0.001
Fig. 2
Fig. 2
PRKAA1/AMPKα1 stimulates the metabolic alteration of ECs in vitro. a Western-blot analysis and quantification data of protein levels of Slc2a1 and Pfkfb3 in MAECs isolated from Prkaa1f/f and Prkaa1VEC-KO mice under 25% EGM-2 and VEGF 20 ng/ml 12 h treatment. n = 4. b Western-blot analysis and quantification data of protein levels of SLC2A1 and PFKFB3 in HUVECs transfected with siCtrl and siPRKAA1 under 25% EGM-2 and VEGF 20 ng/ml 12 h treatment. n = 5. c, d Representative images of immunofluorescence staining for cellular Slc2a1 and Pfkfb3 in MAECs isolated from Prkaa1f/f and Prkaa1VEC-KO mice under 25% EGM-2 and VEGF 20 ng/ml 12 h treatment. Scale bar: 10 µm; n = 4. e ECAR profile showing glycolytic function and quantification of glycolytic function parameters in MAECs isolated from Prkaa1f/f and Prkaa1VEC-KO mice under 25% EGM-2 and VEGF 20 ng/ml 12 h treatment. Vertical lines indicate the time of addition of glucose (10 mM), oligomycin (1 μM), and 2-DG (50 mM). n = 12–16 for each treatment group, replicated four times. f Intracellular lactate levels in MAECs isolated from Prkaa1f/f and Prkaa1VEC-KO mice under 25% EGM-2 and VEGF 20 ng/ml 12 h treatment. n = 6. g Representative images and quantification data of the flow cytometry analysis of 2-NBDG (100 µM, 30 min) staining in HUVECs transfected with siCtrl and siPRKAA1 for 48 h. n = 5. h Measurement of intracellular G-6-P, pyruvate and lactate levels in HUVECs transfected with siCtrl and siPRKAA1 for 48 h. n = 5. All data were expressed as mean ± SEM. Statistical significance was determined by unpaired Student’s t-test (for f, g, h) and one-way ANOVA followed by Bonferroni test (for a, b, e). *p < 0.05 was considered significant, **p < 0.01, ***p < 0.001
Fig. 3
Fig. 3
PRKAA1 is required for disturbed flow-induced metabolic alteration of ECs. ac Representative images and quantification data of en face immunofluorescence staining for Slc2a1 and Pfkfb3 (red) on arterial endothelium of Prkaa1f/f and Prkaa1VEC-KO mice. The endothelium was visualized by CD31 staining (Alexa Fluor-488, green). Nuclei were counterstained with DAPI (blue). Images were captured with confocal fluorescent microscopy. Scale bar: 20 µm; n = 7. d Real-time PCR analysis of mRNA levels of glycolytic genes (Hif1a, Slc2a1, Pfkfb3, Hk1, and Ldha) of ECs from sham-operated right carotid arteries in Prkaa1f/f mice and partially ligated left carotid arteries in Prkaa1f/f and Prkaa1VEC-KO mice. n = 9 mice per group. e Real-time PCR analysis of mRNA levels of HIF1A, SLC2A1, PFKFB3, and HK1 in HUVECs transfected with siCtrl and siPRKAA1 under laminar flow and oscillating flow for 24 h. n = 4. f Western-blot analysis and quantification data of protein levels of HIF1A, SLC2A1, and PFKFB3 in HUVECs transfected with siCtrl and siPRKAA1 under laminar flow and oscillating flow for 24 h. n = 4. g Western-blot analysis and quantification data of protein level of Cezanne in HUVECs transfected with siCtrl and siPRKAA1 under laminar flow and oscillating flow for 24 h. n = 4. h Western-blot analysis and quantification data of protein levels of p-PRKA, PRKAA1, PRKAA, SLC2A1, and PFKFB3 in HUVECs transfected with siCtrl and siHIF1A under laminar flow and oscillating flow for 24 h. n = 4. i Western-blot analysis and quantification data of protein levels of SLC2A1 and PFKFB3 in HUVECs transfected with siCtrl-Ad-Ctrl, siPRKAA1-Ad-Ctrl, and siPRKAA1-Ad-HIF1A under oscillating flow for 24 h. n = 5. All data were expressed as mean ± SEM. Statistical significance was determined by one-way ANOVA followed by Bonferroni test. *p < 0.05 was considered significant, **p < 0.01, ***p < 0.001
Fig. 4
Fig. 4
Endothelial turnover is compromised in the atheroprone areas of arteries in Prkaa1VEC-KO mice. a Representative images and quantification data of en face immunofluorescence staining for Edu (red) on arch arteries in C57, Apoe−/−/Prkaa1f/f, and Apoe−/−/Prkaa1VEC-KO mice 5 days after Edu (5 µg/g) intraperitoneal injection. The endothelium was visualized by CD31 staining (Alexa Fluor-488, green). Nuclei were counterstained with DAPI (blue). Scale bar: 20 µm; n = 9 mice. b Representative images and quantification data of en face immunofluorescence staining for TUNEL (red) on arch arteries in C57, Apoe−/−/Prkaa1f/f, and Apoe−/−/Prkaa1VEC-KO mice. The endothelium was visualized by CD31 staining (Alexa Fluor-488, green). Nuclei were counterstained with DAPI (blue). Scale bar: 20 µm; n = 8. c (Left) Representative images of Evans blue staining of the whole aorta in Prkaa1f/f, Prkaa1VEC-KO, Apoe−/−/Prkaa1f/f, and Apoe−/−/Prkaa1VEC-KO mice. Scale bar: 2 mm; n = 4. (Right) Quantification data of vascular permeability. Sample ODs of Evans blue were extrapolated to a linearized standard and normalized to weight of the aorta. n = 4. d Representative images and quantification data of flow cytometry analysis of Edu staining in HUVECs transfected with siCtrl and siPRKAA1 under laminar flow and oscillating flow for 24 h. n = 9. e Representative images and quantification data of flow cytometry analysis of Annexin V staining in HUVECs transfected with siCtrl and siPRKAA1 under laminar flow and oscillating flow for 24 h. n = 6. All data were expressed as mean ± SEM. Statistical significance was determined by unpaired Student’s t-test (for c) and one-way ANOVA followed by Bonferroni test (for a, b, d, e). *p < 0.05 was considered significant, **p < 0.01, ***p < 0.001
Fig. 5
Fig. 5
Loss of endothelial Prkaa1 increases lesion burden in Apoe−/− mice and accelerates neointima formation. a, b (left) Representative images of Oil Red O stained-aortas (en face) from Apoe−/−/Prkaa1f/f (male n = 13), Apoe−/− Cdh5cre (male n = 8), Apoe−/−/Prkaa1VEC-KO (male n = 21) mice after 16 weeks of Western diet. (Right) Lesion area quantification data. c, d Representative images and quantification data of cross-sections of aortic sinus of Apoe−/−/Prkaa1f/f (n = 5), Apoe−/−/Prkaa1VEC-KO (n = 7) mice with 16 weeks of Western diet. Sections were stained with Oil Red O (lesion), hematoxylin and eosin (plaque), Masson’s trichrome (collagen), and Mac-2 (a macrophage marker). Scale bar: 200 µm. e Representative images of Evans blue staining of injured carotid arteries harvested at the indicated time points in Prkaa1f/f and Prkaa1VEC-KO mice. Scale bar: 500 µm. f Quantification data of percentage of reendothelialization over time in the injured carotid artery from Prkaa1f/f and Prkaa1VEC-KO mice. n = 8, for each time point. g (Left) Representative images of paraffin cross-sections of wire-injured carotid artery from Apoe−/−/Prkaa1f/f (n = 6), Apoe−/−/Prkaa1VEC-KO (n = 7) mice with 4 weeks of Western diet stained with hematoxylin and eosin, Masson’s trichrome, and Mac-2. Scale bar: 100 µm. (Right) Quantification data of lesion size, collagen content, and Mac-2-positive staining. All data were expressed as mean ± SEM. Statistical significance was determined by unpaired Student’s t-test (for d, f, g) and one-way ANOVA followed by Bonferroni test (for b). *p < 0.05 was considered significant, **p < 0.01, ***p < 0.001
Fig. 6
Fig. 6
Overexpression of endothelial Slc2a1 suppresses aggravated atherosclerosis in Apoe−/−/Prkaa1VEC-KO mice. a Western-blot analysis and quantification data of protein levels of HIF1A and PFKFB3 in HUVECs transfected with siCtrl-Ad-Ctrl, siPRKAA1-Ad-Ctrl, siCtrl-Ad-Slc2a1, and siPRKAA1-Ad-Slc2a1 for 48 h. n = 4. b Simplified schematic of rescue mechanism under overexpressing of Slc2a1. c Representative images and quantification data of flow cytometry analysis of Edu staining in HUVECs transfected with siCtrl-Ad-Ctrl, siPRKAA1-Ad-Ctrl, and siPRKAA1-Ad-Slc2a1 under oscillating flow for 24 h. n = 8. d Quantification data of flow cytometry analysis of Annexin V staining in HUVECs transfected with siCtrl-Ad-Ctrl, siPRKAA1-Ad-Ctrl, and siPRKAA1-Ad-Slc2a1 under oscillating flow for 24 h. n = 8. e Representative images and quantification data of immunofluorescence staining for Slsc2a1 (red) on partially ligated carotid arteries after 48 h transduction of control adenovirus (Ad-Ctrl) and Slc2a1-overexpressing adenovirus (Ad-Slc2a1) in Prkaa1f/f and Prkaa1VEC-KO mice. The endothelium was visualized by CD31 staining (Alexa Fluor-488, green). Nuclei were counterstained with DAPI (blue). Scale bar: 20 µm; n = 6. f Representative images and quantification data of Edu staining on partially ligated carotid arteries 5 days after transduction of control Ad-Ctrl and Ad-Slc2a1 in Apoe−/−/Prkaa1f/f, Apoe−/−/Prkaa1VEC-KO mice. The endothelium was visualized by CD31 staining (Alexa Fluor-488, green). Nuclei were counterstained with DAPI (blue). Scale bar: 20 µm; n = 6. g, i Representative cross-sections and quantification data of partially lighted carotid arteries of transduction of Ad-Ctrl and Ad-Slc2a1 in Apoe−/−/Prkaa1f/f, Apoe−/−/Prkaa1VEC-KO mice stained with Oil Red O. Scale bar: 100 µm; n = 7. h Representative photomicrographs of lesion on whole carotid arteries after transduction of Ad-Ctrl and Ad-Slc2a1 in Apoe−/−/Prkaa1f/f, Apoe−/−/Prkaa1VEC-KO mice. Scale bar: 1 mm; n = 7. All data were expressed as mean ± SEM. Statistical significance was determined by one-way ANOVA followed by Bonferroni test. *p < 0.05 was considered significant, **p < 0.01, ***p < 0.001
Fig. 7
Fig. 7
Schematic diagram illustrating the mechanisms underlying the effect of AMPKα1-mediated glycolysis on endothelial proliferation. Disturbed flow in atheroprone regions of blood vessels stimulates increased expression and activity of PRKAA1/AMPKα1 in ECs. Enhanced PRKAA1/AMPKα1 signaling promotes increased expression of HIF1A that, in turn, drives transcription of the glycolytic enzymes and consequently increased EC glycolysis. PRKAA1/AMPKα1-mediated glycolysis is vital to support increased proliferation of ECs and thus helps to preserve EC barrier integrity in vulnerable atheroprone regions and to protect from the infiltration of lipids and leukocytes into the vessel wall and the subsequent development and progression of atherosclerosis. The above protective mechanisms are compromised when the AMPKα1 pathway is blocked

References

    1. Ross R, Glomset JA. Atherosclerosis and the arterial smooth muscle cell: proliferation of smooth muscle is a key event in the genesis of the lesions of atherosclerosis. Science (New York, NY) 1973;180:1332–1339. doi: 10.1126/science.180.4093.1332. - DOI - PubMed
    1. Ross R. Atherosclerosis—an inflammatory disease. N. Engl. J. Med. 1999;340:115–126. doi: 10.1056/NEJM199901143400207. - DOI - PubMed
    1. Glass CK, Witztum JL. Atherosclerosis. The road ahead. Cell. 2001;104:503–516. doi: 10.1016/S0092-8674(01)00238-0. - DOI - PubMed
    1. Libby P. Inflammation in atherosclerosis. Nature. 2002;420:868–874. doi: 10.1038/nature01323. - DOI - PubMed
    1. Chiu JJ, Chien S. Effects of disturbed flow on vascular endothelium: pathophysiological basis and clinical perspectives. Physiol. Rev. 2011;91:327–387. doi: 10.1152/physrev.00047.2009. - DOI - PMC - PubMed

Publication types