Clinical Trial
. 2018 Nov 7;9(1):4664.
doi: 10.1038/s41467-018-07131-y.

Whole body PD-1 and PD-L1 positron emission tomography in patients with non-small-cell lung cancer

Affiliations
Clinical Trial

Whole body PD-1 and PD-L1 positron emission tomography in patients with non-small-cell lung cancer

A N Niemeijer et al. Nat Commun. .

Abstract

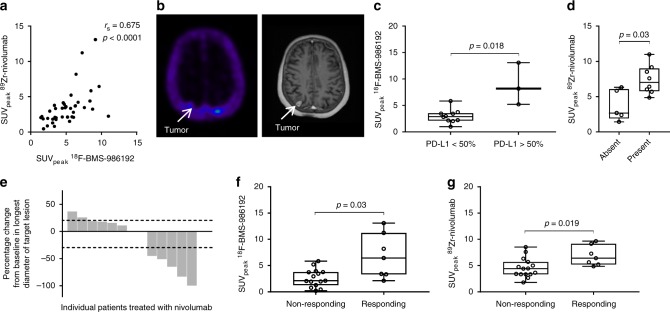
PD-L1 immunohistochemistry correlates only moderately with patient survival and response to PD-(L)1 treatment. Heterogeneity of tumor PD-L1 expression might limit the predictive value of small biopsies. Here we show that tumor PD-L1 and PD-1 expression can be quantified non-invasively using PET-CT in patients with non-small-cell lung cancer. Whole body PD-(L)1 PET-CT reveals significant tumor tracer uptake heterogeneity both between patients, as well as within patients between different tumor lesions.


Conflict of interest statement

We received a research grant for the implementation of this study from Bristol-Myers Squibb (BMS). D.Leung, R.S., S.D., W.H., P.M., D.Lipovsek, D.J.D, S.J.B., and L.M. are employees and stock holders of BMS. The remaining authors declare no competing interests.

Figures

Fig. 1
Fig. 1
Study design, immunohistochemical staining of patient 2, and PET-images of patient 2 and 3. a Study design. b Immunohistochemical staining of PD-L1 in patient 2. Biopsy of the tumor in the left lower lobe. PD-L1 expression is expressed in 95% of the tumor cells. Scale bar, 100 µm. c Immunohistochemical staining of PD-1 in patient 2. PD-1 expression in aggregates was scored as IC1. Scale bar, 100 µm. d 18F-FDG PET (225 MBq) (18F-FDG PET scan images of both patients were used from archival PET-scans) demonstrates high glucose metabolism of tumors in both lungs and mediastinal lymph nodes. 18F-BMS-986192 PET (145.7 MBq, imaging time point 1 h post-injection (p.i.)) and 89Zr-labeled Nivolumab PET (37.09 MBq, 162 h p.i.) demonstrate heterogeneous tracer uptake within and between tumors. e Patient 3 with tumor PD-L1 expression < 1%: 18F-FDG PET (268 MBq) (18F-FDG PET scan images of both patients were used from archival PET-scans) demonstrates high glucose metabolism in the left-sided tumor. 18F-BMS-986192 PET (214.62 MBq, 1 h p.i.) demonstrates low tumor tracer uptake. 89Zr-labeled Nivolumab PET (37.27 MBq, 160 h p.i.) demonstrates heterogeneous tracer uptake in the tumor
Fig. 2
Fig. 2
Tracer uptake and correlation with immunohistochemical staining and response. a Correlation between SUVpeak for 89Zr-nivolumab and 18F-BMS-986192. Rs = 0.68, p < 0.0001 as determined by the Spearman rank correlation. b Low uptake of the 18F-BMS-986192 in an untreated brain metastasis in patient 4, due to PD-L1 expression heterogeneity or low CNS penetration of the tracer. c 18F-BMS-986192 SUVpeak is higher in patients with ≥50% tumor PD-L1 expression. p-value is 0.018, as determined by the Mann–Whitney U-test. d Lesions with no PD-1 expression in aggregates have a lower 89Zr-nivolumab SUVpeak. p-value is 0.03, as determined by the Mann–Whitney U-test. e Waterfall plot of the best objective response according to RECIST 1.1. f SUVpeak of the 18F-BMS-986192 tracer is higher in responding lesions as compared to non-responding lesions (comparison of lesions with diameter of 20 mm or more). p-value is 0.02, as determined by the Mann–Whitney U-test. g SUVpeak of the 89Zr-nivolumab tracer is numerically higher in responding lesions (comparison of lesions with diameter of 20 mm or more). p-value is 0.019, as determined by the Mann–Whitney U-test. For all the boxplots, the lower edge of the box represents the first quartile and the upper edge represents the third quartile. The horizontal line inside the box indicates the median. Whiskers identify the minimum and the maximum value

References

    1. Vokes EE, et al. Nivolumab versus docetaxel in previously treated advanced non-small cell lung cancer (CheckMate 017 and CheckMate 057): 3-year update and outcomes in patients with liver metastases. Ann. Oncol. 2018;29:959–965. doi: 10.1093/annonc/mdy041. - DOI - PubMed
    1. Borghaei H, et al. Nivolumab versus docetaxel in advanced nonsquamous non-small-cell lung cancer. N. Engl. J. Med. 2015;373:1627–1639. doi: 10.1056/NEJMoa1507643. - DOI - PMC - PubMed
    1. Herbst RS, et al. Pembrolizumab versus docetaxel for previously treated, PD-L1-positive, advanced non-small-cell lung cancer (KEYNOTE-010): a randomised controlled trial. Lancet. 2016;387:1540–1550. doi: 10.1016/S0140-6736(15)01281-7. - DOI - PubMed
    1. Rittmeyer A, et al. Atezolizumab versus docetaxel in patients with previously treated non-small-cell lung cancer (OAK): a phase 3, open-label, multicentre randomised controlled trial. Lancet. 2017;389:255–265. doi: 10.1016/S0140-6736(16)32517-X. - DOI - PMC - PubMed
    1. Shukuya T, Carbone DP. Predictive markers for the efficacy of anti-PD-1/PD-L1 antibodies in lung cancer. J. Thorac. Oncol. 2016;11:976–988. doi: 10.1016/j.jtho.2016.02.015. - DOI - PMC - PubMed

Publication types

MeSH terms