. 2018 Nov 7;8(1):16501.
doi: 10.1038/s41598-018-34792-y.

Loss of Sirt2 increases and prolongs a caerulein-induced pancreatitis permissive phenotype and induces spontaneous oncogenic Kras mutations in mice

Affiliations

Loss of Sirt2 increases and prolongs a caerulein-induced pancreatitis permissive phenotype and induces spontaneous oncogenic Kras mutations in mice

Songhua Quan et al. Sci Rep. .

Abstract

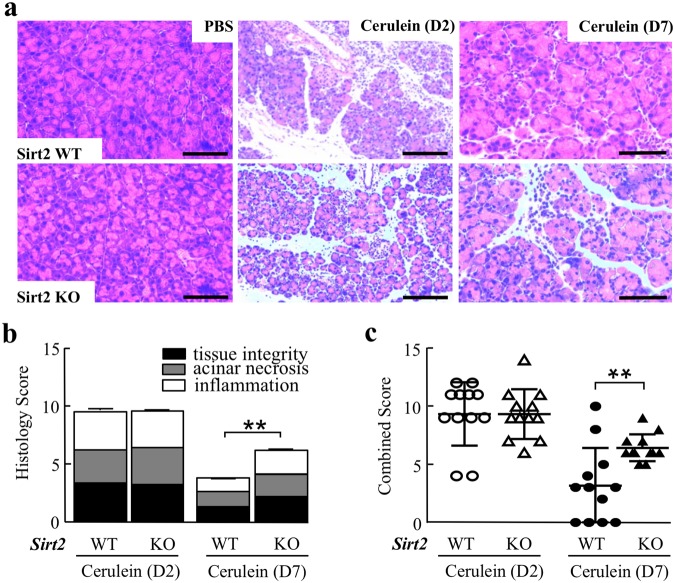
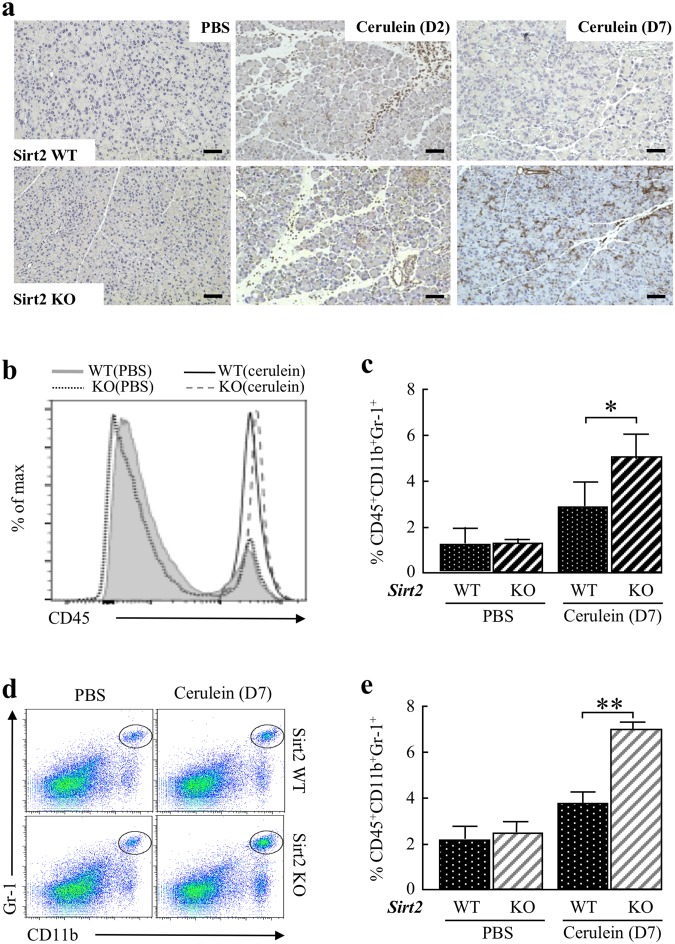
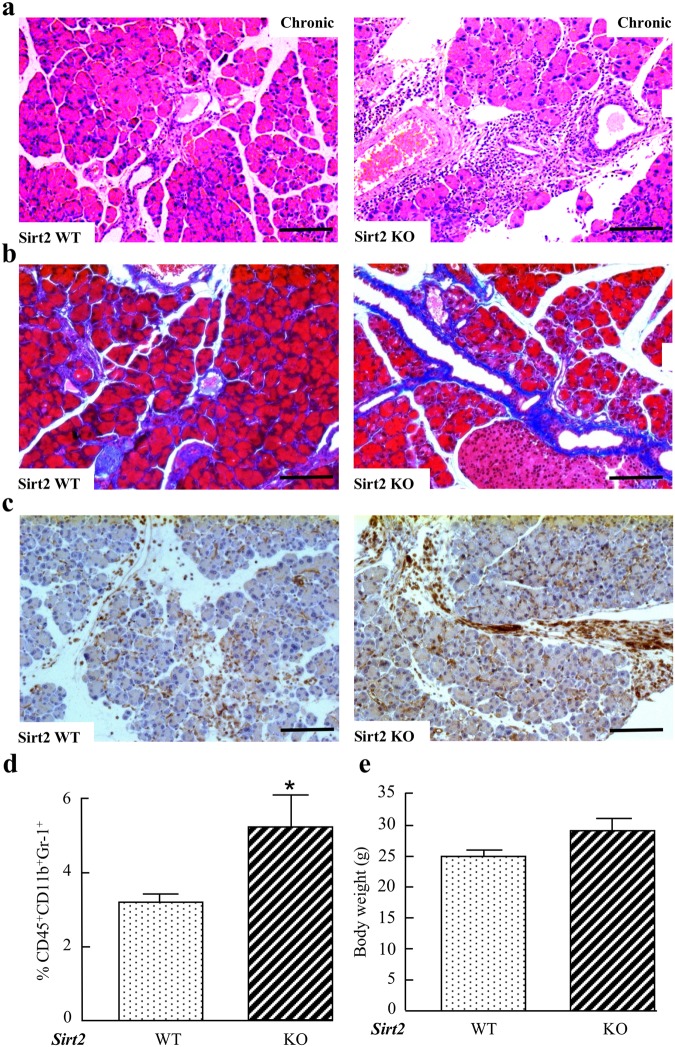
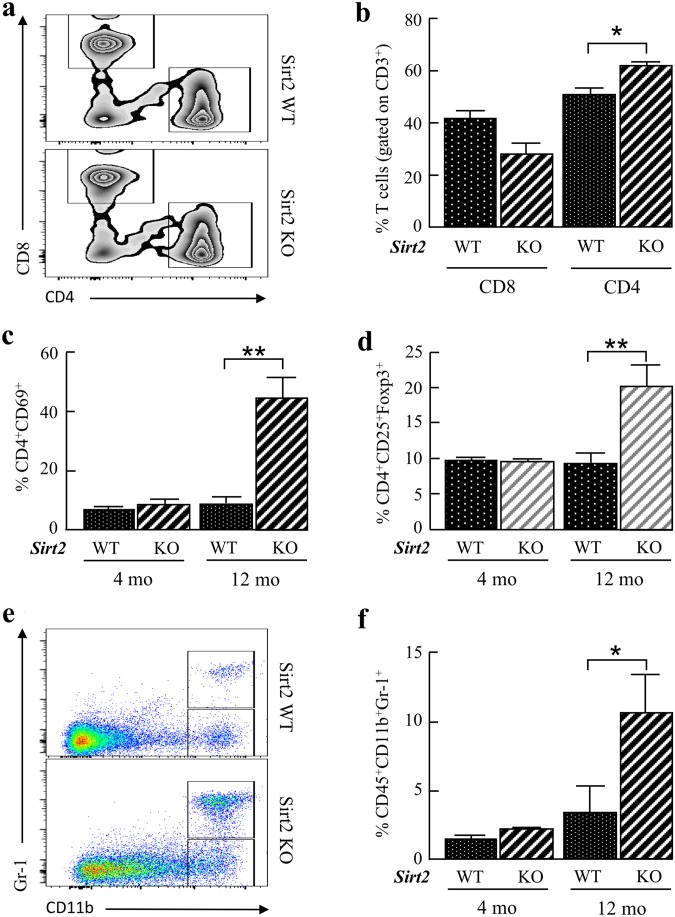
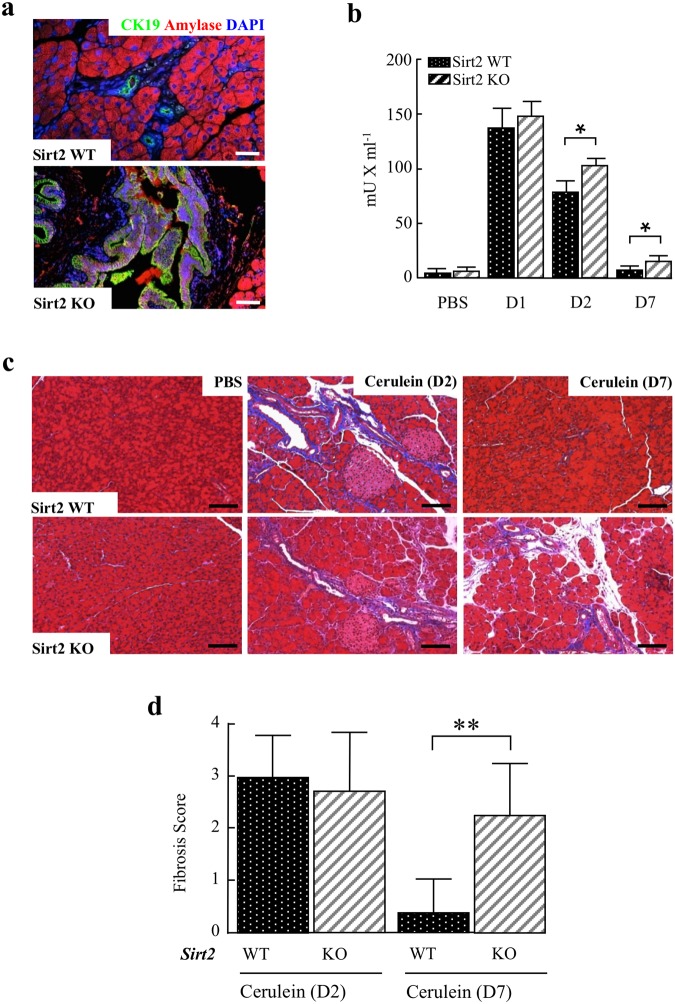
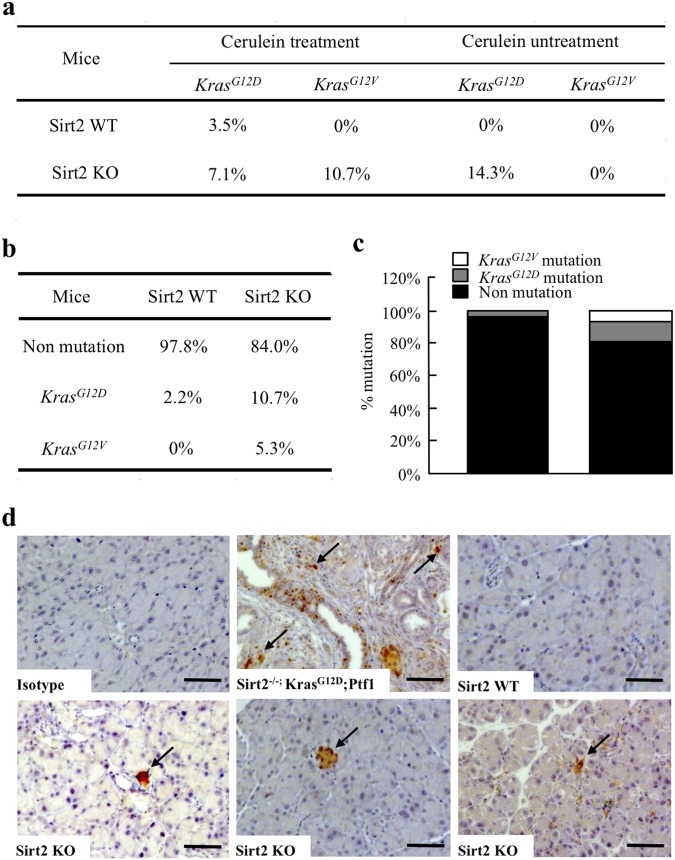
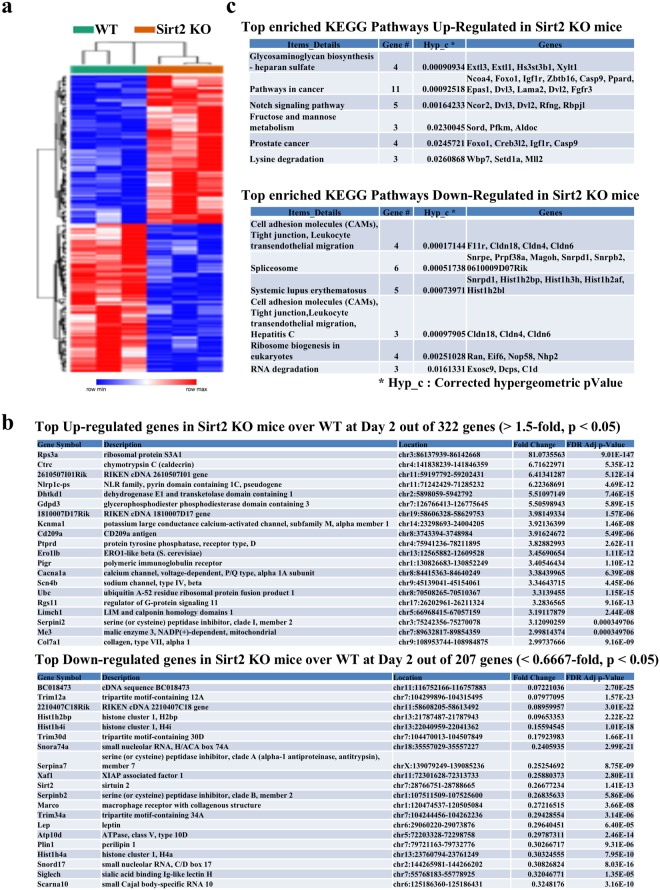
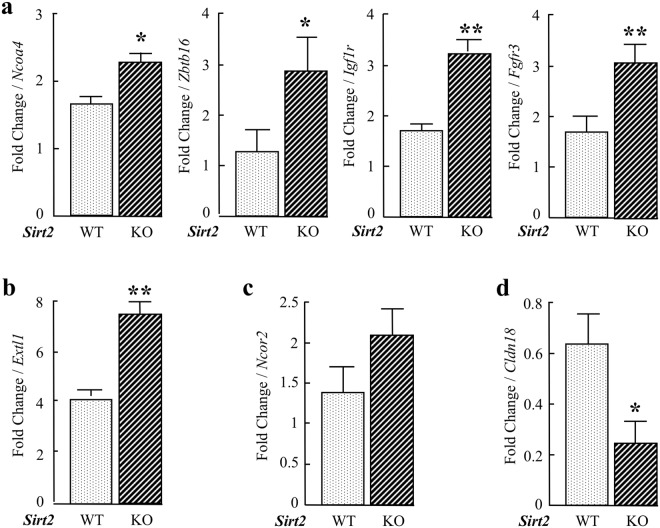
Mice lacking Sirt2 spontaneously develop tumors in multiple organs, as well as when expressed in combination with oncogenic KrasG12D, leading to pancreatic tumors. Here, we report that after caerulein-induced pancreatitis, Sirt2-deficient mice exhibited an increased inflammatory phenotype and delayed pancreatic tissue recovery. Seven days post injury, the pancreas of Sirt2-/- mice display active inflammation, whereas wild-type mice had mostly recovered. In addition, the pancreas from the Sirt2-/- mice exhibited extensive tissue fibrosis, which was still present at six weeks after exposure. The mice lacking Sirt2 also demonstrated an enhanced whole body pro-inflammatory phenotype that was most obvious with increasing age. Importantly, an accumulation of a cell population with spontaneous cancerous KrasG12D mutations was observed in the Sirt2-/- mice that is enhanced in the recovering pancreas after exposure to caerulein. Finally, transcriptome analysis of the pancreas of the Sirt2-/- mice exhibited a pro-inflammatory genomic signature. These results suggest that loss of Sirt2, as well as increased age, enhanced the immune response to pancreatic injury and induced an inflammatory phenotype permissive for the accumulation of cells carrying oncogenic Kras mutations.


Conflict of interest statement

The authors declare no competing interests.

Figures

Figure 1
Figure 1
Mice lacking Sirt2 exposed to caerulein exhibit impaired pancreatic regeneration. (a) Wild-type (WT) and Sirt2−/− (KO) mice had 8 hourly intraperitoneal (i.p.) injections with PBS or caerulein (100 μg/ml), and the pancreas was harvested on day 2 (D2) or day 7 (D7) post-injection. H&E staining was done for all mice, and representative images are shown. n = 5–10 mice per group. Bars indicate 100 µm. (b) Individual scoring of pancreatic tissue integrity, acinar necrosis, and inflammation parameters from wild-type and Sirt2−/− mice used in Fig. 1a. (c) Combined scoring of pancreatic tissue integrity for the mice treated without or with caerulein and harvested at D2 and D7. The scoring system used is shown in the Supplemental Section, Table 1. (n = 5–10, *p < 0.05, **p < 0.01).
Figure 2
Figure 2
Deletion of Sirt2 increases the macrophage-predominant inflammatory response. (a) Wild-type (WT) and Sirt2−/− (KO) mice were i.p. injected with PBS or caerulein, and the pancreas was harvested on day 2 (D2) or day 7 (D7) post-injection. Panels showed representative immuno-histochemical staining of a macrophage maker F4/80. Bars indicate 100 µm. (b,c) Pancreas from wild-type and Sirt2−/− mice treated with PBS or caerulein at D7 were harvested, digested, and single cells were isolated and stained with anti-CD45, anti-CD11b, and anti-Gr-1 antibodies. (d) FACS plots characterized the expression of CD45+ cells in wild-type, and Sirt2−/− mice at D7. Wild-type and Sirt2−/− mice were i.p. injected with PBS or caerulein, and the spleen was removed at D7. Splenic cells were isolated and stained with anti-CD45, anti-CD11b, and anti-Gr-1 antibodies. Scatterplots showed the population of CD45+CD11b+Gr1+ myeloid cells in wild-type and Sirt2−/− mice at D7 (circled). (e) Graph showing the percentage of CD45+CD11b+Gr1+ myeloid cells from wild-type and Sirt2−/− at D7. (n = 5, *p < 0.05, **p < 0.01). Bar graphs indicated mean ± standard error of the mean (s.e.m).
Figure 3
Figure 3
Characterization of wild-type and Sirt2 knockout mice pancreas at 6 weeks after caerulein-induced chronic pancreatitis. (a) Wild-type (WT) and Sirt2−/− (KO) mice had 6 hourly intraperitoneal (i.p.) injections with caerulein (50 μg/ml) once a week for 6 weeks. H&E staining was done for all mice, and representative images are shown. n = 5 mice per group. Bars indicate 100 µm. (b) Wild-type (WT) and Sirt2−/− (KO) mice pancreas with caerulein-induced chronic pancreatitis at 6 weeks were analyzed by Masson’s Trichrome staining. Representative images are shown. Bars indicate 100 µm. (c) Wild-type (WT) and Sirt2−/− (KO) mice were i.p. injected with caerulein, and the pancreas was harvested at 6 weeks post-injection. Panels showed representative immuno-histochemical staining of a macrophage maker F4/80. Bars indicate 100 µm. (d) Measurement of pancreas infiltrated macrophages in wild type and Sirt2−/− mice at 6 weeks after caerulein-induced chronic pancreatitis. (e) Body weight of mice at 6 weeks after caerulein-induced chronic pancreatitis.
Figure 4
Figure 4
Mice lacking Sirt2 exhibit age-dependent difference in T cell activity, as well as macrophage infiltration. (a) The spleens from 12-month old wild-type (WT) and Sirt2−/− (KO) mice were harvested, and splenocytes were stained with anti-CD3, anti-CD8, and anti-CD4 antibodies. FACS plots showed the populations of CD3+CD8+ T cells and CD3+CD4+ T cells from wild-type or Sirt2−/− mice. (b) Quantitative analysis of the cytotoxic (CD3+CD8+) and helper (CD3+CD4+) T cells from wild-type and Sirt2−/− mice from Fig. 3a. (c) The spleens from age-matched (4 and 12 month) wild-type (WT) and Sirt2−/− (KO) mice were harvested, and splenocytes were stained with anti-CD3, anti-CD4, and anti-CD69 antibodies. The graph shows the percentage of CD3+CD4+CD69+ active T cells from wild-type or Sirt2−/− mice at 4 and 12 months of age. (d) The spleens from age-matched wild-type (WT) and Sirt2−/− (KO) mice were harvested, and splenocytes were stained with anti-CD4, anti-CD25, and anti-Foxp3 antibodies. The graph indicates the percentage of CD4+CD25+Foxp3+ regulatory T cells from wild-type or Sirt2−/− mice at 4 and 12 months of age. (e) The spleens from 12-month old wild-type (WT) and Sirt2−/− (KO) mice were harvested, and splenocytes were stained with anti-CD45, anti-CD11b, and anti-Gr-1 antibodies. Scatterplots showed the population of CD45+CD11b+Gr-1+ cells. (f) Quantitative analysis of the CD45+CD11b+Gr-1+ cells from wild-type and Sirt2−/− mice at 12-month old from Fig. 3e (n = 4, *p < 0.05, **p < 0.01).
Figure 5
Figure 5
Sirt2-deficiency leads to the progression of acute pancreatitis to pre-invasive neoplasms. (a) Wild-type and Sirt2−/− mice were i.p. injected with caerulein, and pancreatic tissue was harvested at D7. Immuno-fluorescent staining was performed with anti-CK19 (green), and pancreatic anti-amylase (red). Colocalization of CK19 and pancreatic amylase is shown. Bars indicate 100 µm. (b) Wild-type and Sirt2−/− mice were i.p. injected with PBS or caerulein, and serum was collected prior to injection and on days 1, 2, and 7 post injection. Serum amylase was measured with an amylase assay kit purchased from Abcam. (n = 5–10, p < 0.05, **p < 0.01). (c) Wild-type and Sirt2−/− mice pancreas with caerulein-induced pancreatitis on day 2 (D2) and day 7 (D7) were analyzed by Masson’s Trichrome staining. Blue staining indicates collagen fibers. Note that the pancreas from the Sirt2−/− mouse still shows histological damage at day 7, whereas the wild type mouse pancreas shows remarkable recovery. Representative images are shown. (d) Quantitative analysis of stromal fibrosis in wild-type and Sirt2−/− mice pancreas from Fig. 4a was performed by scoring the intensity of stromal fibrosis, as determined by the percentage of blue stained areas. (n = 5, *p < 0.05, **p < 0.01).
Figure 6
Figure 6
Accumulation of spontaneous tumorigenic Kras mutations in Sirt2-deficient mice. (a) Accumulation of tumorigenic Kras mutations during inflammation-coupled neoplasm. Mouse pancreas genomic DNA from wild-type and Sirt2 KO, with and without caerulein-treatment, were analyzed for KrasG12D or KrasG12V mutations by competitive allele-specific TaqMan PCR. The table shows the summary of analysis for percentage of mice positive for mutations (46 wild-type mice, 56 Sirt2 KO mice) after pancreatitis. (b) Detail description of wild-type and Sirt2 KO mice with KrasG12D and KrasG12V mutations. (c) Bar graph representation of (b). (d) Immunostaining detection of KRAS-G12D mutant protein in mouse pancreas. Mice pancreas tissues were fixed, embedded in paraffin, and immuno-histochemical staining with anti- KRAS-G12D antibody was performed. Representative images are shown. Bars indicate 100 µm.
Figure 7
Figure 7
Gene expression profiling of caerulein-induced pancreatitis in wild-type and Sirt2-deficient mice. (a) The heat map illustrates the expression level of statistically significant 529 differentially expressed genes in pancreas between wild-type and Sirt2−/− mice. Each column is a sample, and each row is a gene. The red color represents gene expression greater than the overall mean, and the blue color represents gene expression less than the overall mean. Hierarchical clustering of genes and samples are represented by the dendrograms on the left and across the top of the heat map. (b) The list of top 20 genes for the up- and down-regulated differentially expressed genes in Sirt2−/− mice pancreas compared with wild-type mice on day 2 post caerulein-induced acute pancreatitis. There are 322 up-regulated and 207 down-regulated statistically significant expressed genes detected. (c) KEGG pathway enrichment analysis identified biological pathways associated with the differentially expressed genes detected between wild-type and Sirt2−/− mice at 2 days post caerulein-induced pancreatitis. The top 6 enriched up-regulated and down-regulated pathways are listed based on corrected hypergeometric p-value.
Figure 8
Figure 8
Validation of differentially expressed genes from RNA-seq analysis by RT-qPCR. (a) Relative expression levels of Ncoa4, Zbtb16, Igf1r, and Fgfr3 by RT-qPCR. These genes belong to “Pathways in Cancer”. (b) Expression level of Extl1 that belongs to a pathway “Glycosaminoglycan biosynthesis – heparin sulfate”. (c) Expression of Ncor2, which belongs to “Notch signaling pathway”. (d) Expression of Cldn18, which belongs to a pathway of “Cell adhesion molecules (CAMs), Tight junction, Leukocyte transendothelial migration”. Error bars represent ± SEM. Overall, the trend of gene expression by RT-qPCR mirrors that of the RNA-seq analysis. *p < 0.05, **p < 0.01.

Similar articles

Cited by

References

    1. Tissenbaum HA, Guarente L. Increased dosage of a sir-2 gene extends lifespan in Caenorhabditis elegans. Nature. 2001;410:227–230. doi: 10.1038/35065638. - DOI - PubMed
    1. Guerra C, et al. Chronic pancreatitis is essential for induction of pancreatic ductal adenocarcinoma by K-Ras oncogenes in adult mice. Cancer Cell. 2007;11:291–302. doi: 10.1016/j.ccr.2007.01.012. - DOI - PubMed
    1. Dryden SC, Nahhas FA, Nowak JE, Goustin AS, Tainsky MA. Role for human SIRT2 NAD-dependent deacetylase activity in control of mitotic exit in the cell cycle. Mol Cell Biol. 2003;23:3173–3185. doi: 10.1128/MCB.23.9.3173-3185.2003. - DOI - PMC - PubMed
    1. Serrano L, et al. The tumor suppressor SirT2 regulates cell cycle progression and genome stability by modulating the mitotic deposition of H4K20 methylation. Genes Dev. 2013;27:639–653. doi: 10.1101/gad.211342.112. - DOI - PMC - PubMed
    1. Wang F, Tong Q. SIRT2 suppresses adipocyte differentiation by deacetylating FOXO1 and enhancing FOXO1′s repressive interaction with PPARgamma. Mol Biol Cell. 2009;20:801–808. doi: 10.1091/mbc.E08-06-0647. - DOI - PMC - PubMed

Publication types