. 2018 Nov;563(7731):421-425.
doi: 10.1038/s41586-018-0681-2. Epub 2018 Nov 7.

Structures of the intermediates of Kok's photosynthetic water oxidation clock

Affiliations

Structures of the intermediates of Kok's photosynthetic water oxidation clock

Jan Kern et al. Nature. 2018 Nov.

Abstract

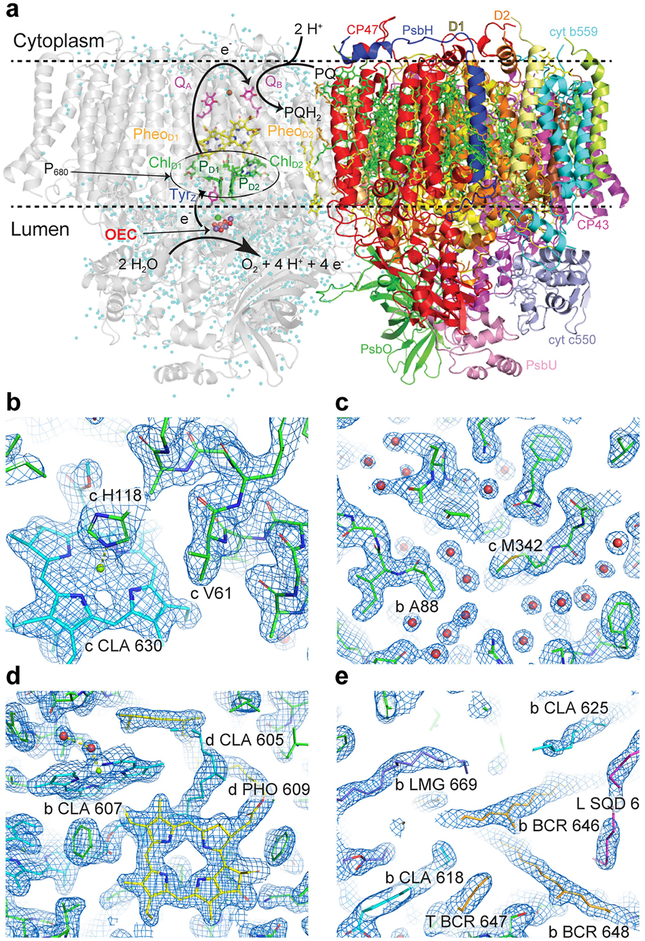
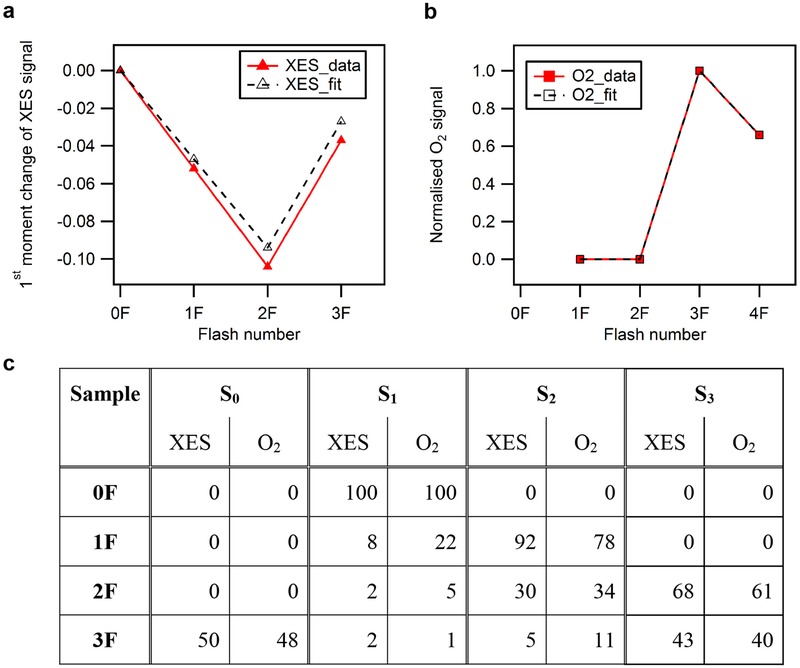
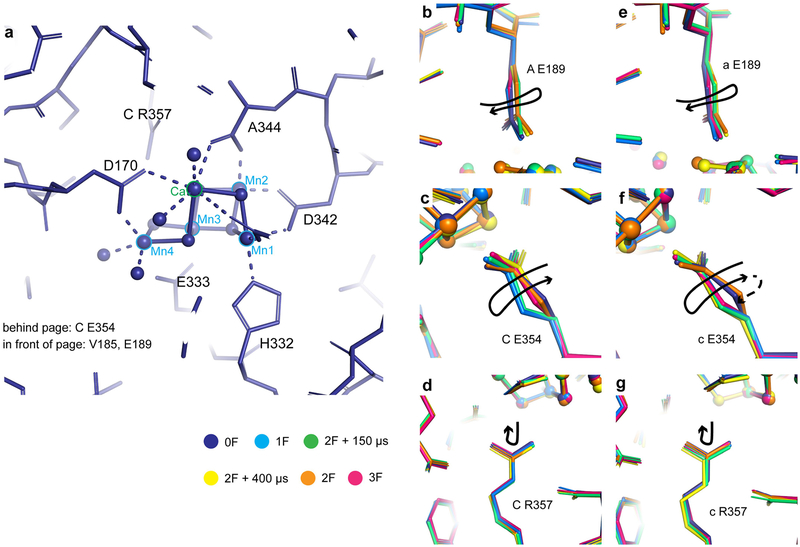
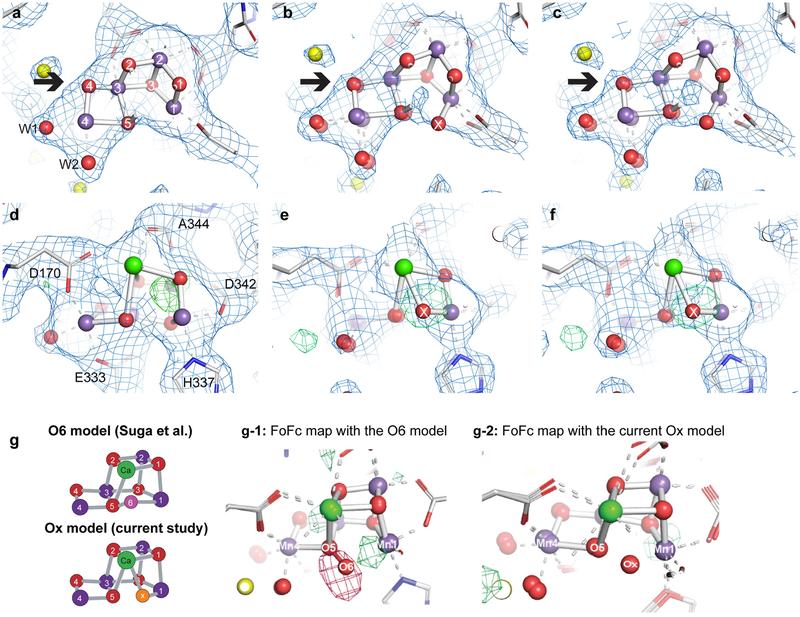
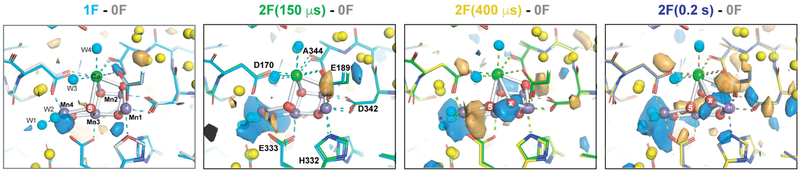
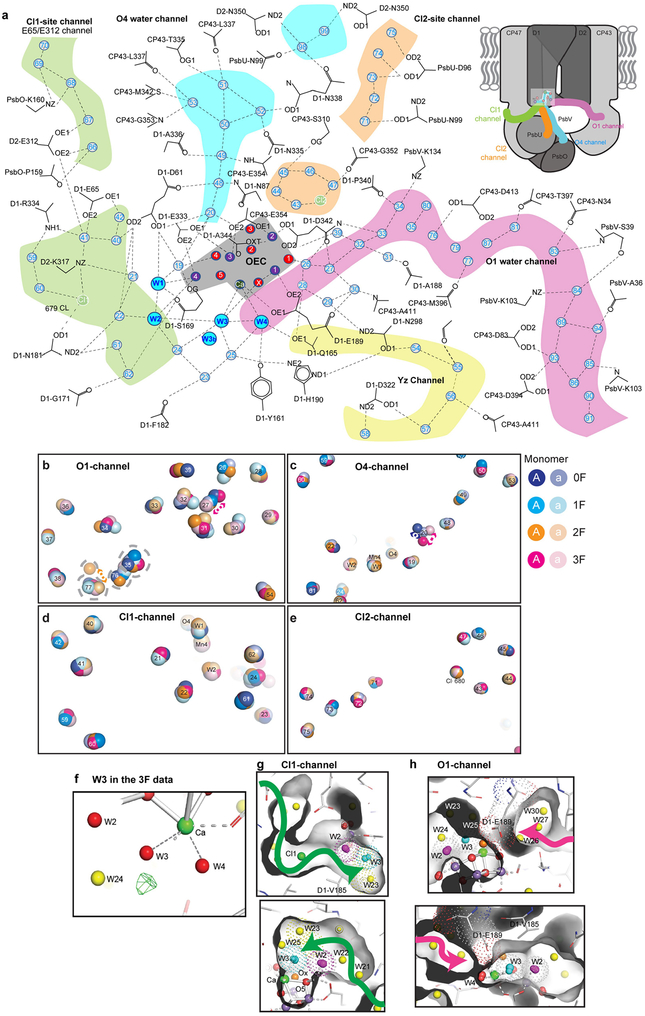
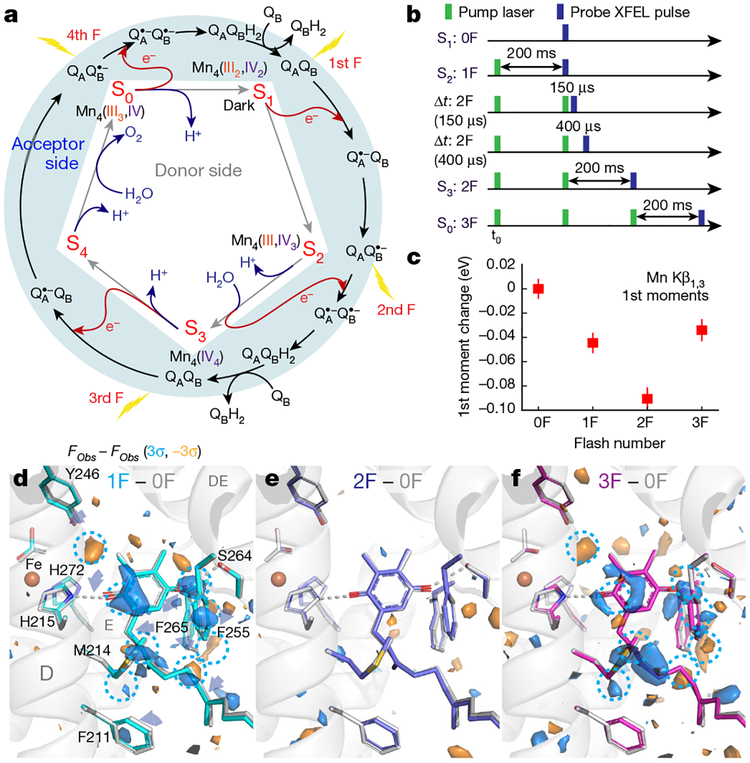
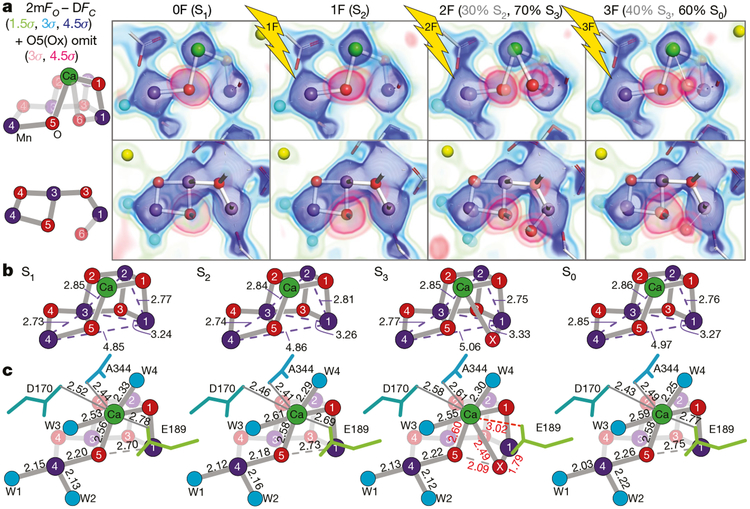
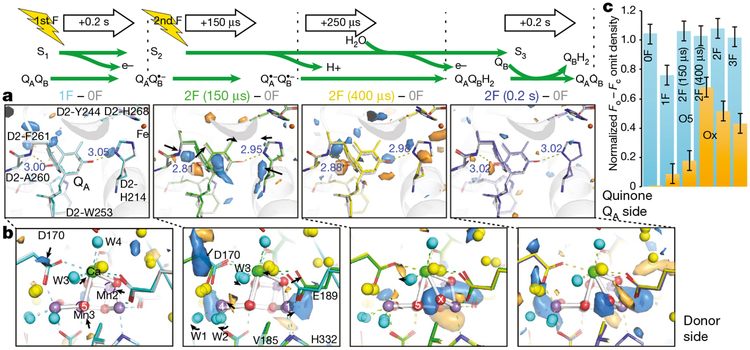
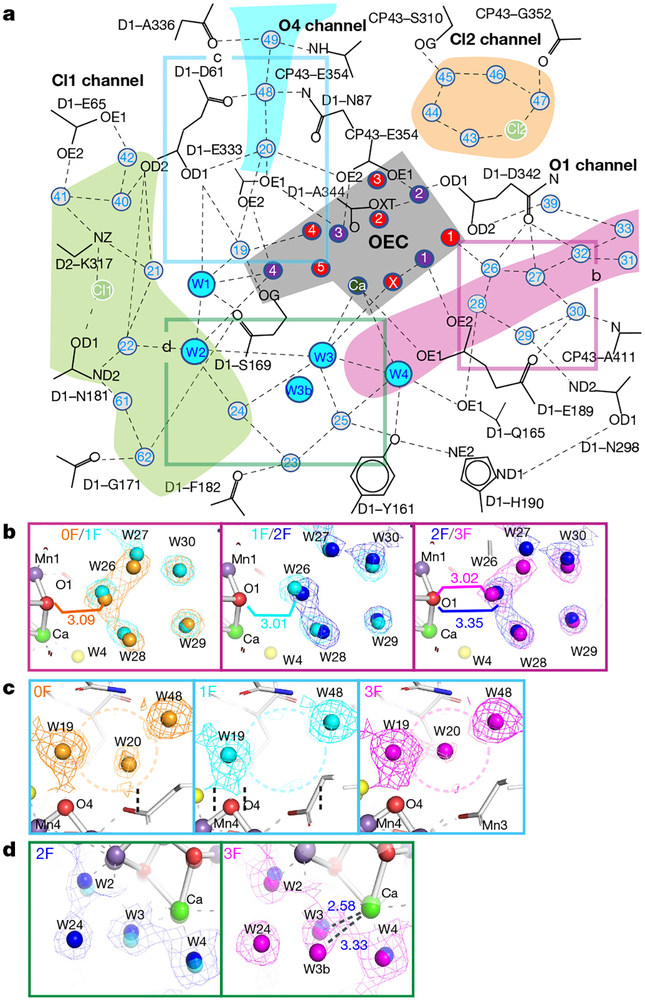
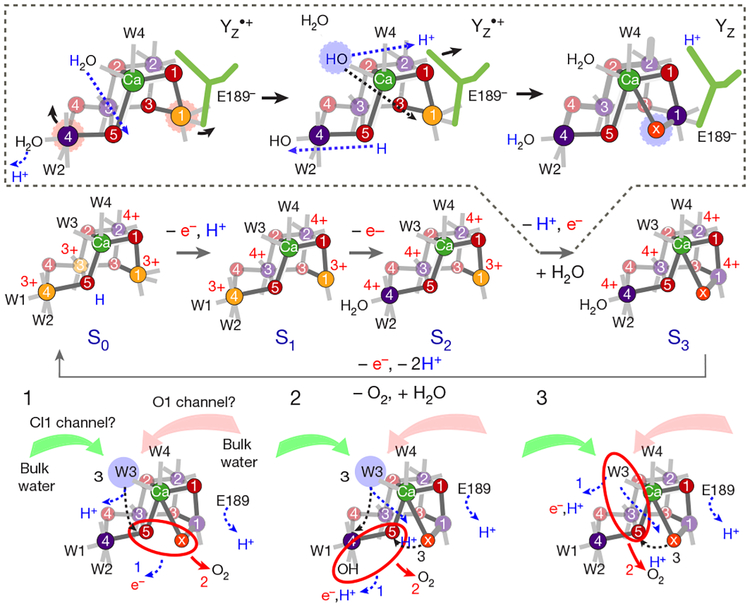
Inspired by the period-four oscillation in flash-induced oxygen evolution of photosystem II discovered by Joliot in 1969, Kok performed additional experiments and proposed a five-state kinetic model for photosynthetic oxygen evolution, known as Kok's S-state clock or cycle1,2. The model comprises four (meta)stable intermediates (S0, S1, S2 and S3) and one transient S4 state, which precedes dioxygen formation occurring in a concerted reaction from two water-derived oxygens bound at an oxo-bridged tetra manganese calcium (Mn4CaO5) cluster in the oxygen-evolving complex3-7. This reaction is coupled to the two-step reduction and protonation of the mobile plastoquinone QB at the acceptor side of PSII. Here, using serial femtosecond X-ray crystallography and simultaneous X-ray emission spectroscopy with multi-flash visible laser excitation at room temperature, we visualize all (meta)stable states of Kok's cycle as high-resolution structures (2.04-2.08 Å). In addition, we report structures of two transient states at 150 and 400 µs, revealing notable structural changes including the binding of one additional 'water', Ox, during the S2→S3 state transition. Our results suggest that one water ligand to calcium (W3) is directly involved in substrate delivery. The binding of the additional oxygen Ox in the S3 state between Ca and Mn1 supports O-O bond formation mechanisms involving O5 as one substrate, where Ox is either the other substrate oxygen or is perfectly positioned to refill the O5 position during O2 release. Thus, our results exclude peroxo-bond formation in the S3 state, and the nucleophilic attack of W3 onto W2 is unlikely.


Conflict of interest statement

Competing interests The authors declare no competing interests.

Figures

Extended Data Fig. 1 |
Extended Data Fig. 1 |. Overview of the PSII structure and electron density maps of the 3F state.
a, Structure of the native PSII homodimer. In the left monomer the location of cofactors for the initial charge separation (P680, PheoD1), and for the electron transfer leading to the reduction of the plastoquinone (QA, QB) at the acceptor side and to the oxidation of the OEC at the donor side by P680+ are indicated. In the right monomer, the locations of the protein subunits are displayed. b–d, 2mFobs − DFcalc map (blue, 1.5σ contour) obtained from the room temperature 3F data set.b, Density around the main chain and a chlorophyll. c, Well-resolved ordered water molecules. d, Chlorophyll and pheophytin molecules with well-resolved tails. e, Clear density in hydrophobic regions and along cofactor hydrocarbon tails.
Extended Data Fig. 2 |
Extended Data Fig. 2 |. Flash-induced S-state turnover of PSII micro crystals.
a, Change of the first moment of the in situ-measured Mn Kβ XES as a function of flashes and fit to the data. b, Flash-induced O2 yield as measured by MIMS as a function of flash number and fit to the data. c, The estimated S-state population (%) for each of the flash states from fitting of the XES data and of the flash-induced O2 evolution pattern of a suspension of PSII crystals at pH 6.5. Two different fits were performed: a global fit of both O2 and XES data using an equal miss parameter of 22% and 100% Si population in the 0F sample (black traces in a, b; S-state distribution listed in the columns headed O2), and a direct fit of the XES data using a 8% miss parameter in the S1→S2 and a 27% miss parameter for the S2→S3 and S3→S0 transitions (XES in c). For the XES fit, shifts of −0.06 eV per oxidation state increase for all S states were assumed. The XES raw spectra are published elsewhere.
Extended Data Fig. 3 |
Extended Data Fig. 3 |. Isomorphous difference maps in the second monomer at the QB site.
a–c, FobsFobs maps contoured at 3σ at plastoquinone QB in monomer a. a, 1F − 0F difference map matching reduction of the plastoquinone to a semiquinone and concomitant slight geometry change. b, 2F − 0F difference map matching replacement of the fully reduced quinol with another quinone at the original position. c, 3F − 0F difference map, showing again structural changes similar to the 1F − 0F map, indicating formation of the semiquinone. Similar views are shown for monomer A in Fig. 1d–f and comparison of both monomers indicates similar flash-induced changes in both monomers.
Extended Data Fig. 4 |
Extended Data Fig. 4 |. Movement of ligands around the OEC in the different S states.
a, Overview of the ligand environment of the OEC, showing the dark state (0F) structure. Coordination of the OEC by nearby side chains and water molecules is indicated by dashed lines. b–g, Trends for selected individual side chains in both monomers (b–d, monomer A; e–g, monomer a). Overlays of the refined models at the OEC following least-squares fitting of subunit D1 residues 55–65, 160–190 and 328, subunit CP43 residues 328 and 354–358, and chain D residue 352 of each other model to the 0F model. The largest and most consistent motions of side chains near the OEC through the sequence of illuminated state models are annotated with arrows indicating the trend. A motion observed in only one monomer is indicated by a dashed line.
Extended Data Fig. 5 |
Extended Data Fig. 5 |. Impact of the data quality on the resolving power of the maps.
a–f, The data quality evidenced by 2F state models and 2mFobs − DFcalc maps contoured at 1.5σ. a, 5TIS (2F, 2.25 Å) model and map. Overlays indicate atom numbering in the OEC and the identities of selected coordinating sidechains. b, Current 2F model and map cutto 2.25 Å. c, Current 2F model and map at the full 2.07 Å resolution. Emergence of locations of O4 with improved data quality is indicatedby bold arrow. d, As in a from a different angle and with mFobs − DFcalc density at 3σ indicating the lack of sufficient evidence for inserting an additional O atom at a chemically reasonable position. e, f, As in b, c from the same direction as d and with mFobs − DFcalc density at 3σ shown to 2.25 and 2.05 Å, respectively, after omitting the inserted Ox atom. Centring of the refined Ox position within the omit density gives a clear indication of the position of the inserted water in the S3 state with the current, higher-quality data, even when artificially cut to the same resolution as the previous data set. g, mFobs − DFcalc maps of the 2F data that compare the O6 model from Suga et al.9 and the Ox model from the current study. Map shows the mFobs − DFcalc density calculated with our current 2F data and our model adding the O6 position of Suga et al.9 (with the occupancy of 0.7 and B-factor of 30) (g-1), and with our Ox model (g-2). We see clearly a positive density for the missing Ox and a negative density at the O6 position in g-1. Schematics of the O6 and Ox S3 models are shown on the left.
Extended Data Fig. 6 |
Extended Data Fig. 6 |. Isomorphous difference maps in the second monomer at the OEC.
Isomorphous difference density OEC sites in monomer a. Fobs − Fobs difference densities between the various illuminated states and the 0F data are contoured at +3σ (blue) and −3σ (orange). The model for the 0F data is shown in light grey whereas carbons are coloured as follows: 1F (cyan), 2F (150 μs) (green), 2F (400 μs) (yellow) and 2F (0.2 s) (blue).
Extended Data Fig. 7 |
Extended Data Fig. 7 |. Water environment of the OEC.
a, Extended schematic of the hydrogen bonding network connecting the OEC to the solvent-exposed surface of PSII and identification of several channels for either possible water movement or proton transfer. Top right, locations of four selected channels in the PSII monomer. be, Movements within the water networks across monomers. Coloured spheres are shown for each ordered water or chloride ion across the four metastable states, 0F through 3F, and for both monomers, with the stronger colour matching the first (A) monomer and the lighter colour matching the second (a) monomer. For ordered solvent, residue number is shown; for OEC atoms, the atom identifier is shown; and for the Cl2 site, the Cl− 680 label is shown. b, The O1 water chain. Positional disagreement between monomers is visible especially near waters 77 (2F) and 27 (3F) and is on the same scale as changes between illuminated states, both of which may indicate a more dynamic water channel. c, The O4 water chain. With the notable exception of water 20, most water positions are stable across monomers and illuminated states. Water 20 is highly unstable in position in the two states (0F, 3F) in which it is modelled, and there is not sufficient density in the remaining states to model a water 20 position. d, The Cl1 site water channel with no notable movements. e, The Cl2 site water channel with no notable movements. f, Indication of a split position of W3 in the S0 state. mFobs − DFcalc difference density (green mesh) in the 3F state suggests an alternate position near W3 (W3b in Fig. 4d). g, h, Possible access to W3/Ox side from the Cl1 or the O1 channel. The surface of the protein is shown in grey to visualize the extent of the cavities around the OEC, and Van der Waals radii are indicated for selected residues or atoms by dotted spheres. Shown are two different views for each channel. The direction of the Cl1 channel is indicated by a green arrow and the O1 channel by a pink arrow. Water W2 is shown in purple, W3 in cyan and Ox in orange. Yellow spheres indicate other waters. Mn are shown in magenta, other bridging oxygens as red spheres.
Fig. 1 |
Fig. 1 |. The oxygen-evolving cycle in photosystem II.
a, Relationship between the redox chemistry at the donor (Kok’s clock) and acceptor sides throughout the oxygen-evolving cycle. b, Relative timing of the visible laser (527 nm) pump and X-ray laser for the different illuminated states. c, First moment change of the Mn Kβ1,3 XES spectra from PSII crystals obtained in situ simultaneously with XRD. Data shown as mean ± s.d. (see Methods). Df, FobsFobs isomorphous difference maps around plastoquinone QB contoured at +3σ (blue) and −3σ (orange) for the 1F, 2Fand 3F states relative to 0F. The 0F stick model is shown in light grey; other models have carbons coloured cyan (1F), blue (2F) and magenta (3F).
Fig. 2 |
Fig. 2 |. Stepwise changes at the OEC during the oxygen-evolving Kok cycle.
a, Left, labelled diagrams of the OEC atoms in two views. Right, 2mFobs − DFcalc density (green to blue) and O5/Ox omit map density (pink) shown as the overlay of several contour levels for the two views of the OEC in the 0F-3F states. The contributions of the S states to each data set for the two-component analysis are indicated in parentheses. b, c, Atomic distances in the OEC in each S state in ångström, averaged across both monomers. Standard deviations for metal-metal, metal-bridging oxygen and metal-ligand distances are 0.1, 0.15 and 0.17 Å, respectively (see Methods). Ca remains 8-coordinate upon insertion of Ox by detaching D1-Glu189.
Fig. 3 |
Fig. 3 |. The S2→S3 transition in PSII.
a, b, Isomorphous difference density at quinone QA (a) and donor side (b) with the expected reduced state of QA at 2F (150 μs) and less pronounced at 2F (400 μs), and the oxidation of the OEC and insertion of Ox by 400 μs after the second flash. FobsFobs difference densities between the various illuminated states and the 0F data are contoured at +3σ (blue) and −3σ (orange). The model for the 0F data is shown in light grey whereas carbons are coloured in the models as follows: 1F (cyan), 2F (150 μs) (green), 2F (400 μs) (yellow) and 2F (0.2 s) (blue). c, Estimates of occupancies of O5 and Ox based on omit map peak heights normalized against the average electron density maximum at the O2 position in the omit maps. These match full occupancy of O5 throughout and Ox insertion by 400 μs after the second flash. Data shown as mean ± s.d. based on the electron density value at the O2 position (n = 12 observations, see Methods).
Fig. 4 |
Fig. 4 |. Water network around the OEC.
a, Schematic of the H-bonding network surrounding the OEC indicating starting points of channels connecting the OEC to the solvent-exposed surface of PSII for possible water movement and proton transfer. b–d, Changes in selected water positions between the 0F and 3F states overlaid with 2mFobs − DFcalc maps in those states contoured at 1.5σ. Positions in the schematic view are indicated by boxes of the same colour. Selected distances are given in ångström. b, Oscillation of the cluster of five waters next to O1 with the O1-O26 distance alternating long-short-long-short from 0F – 3F. c, W20 and its direct surroundings, indicating disappearance of W20 in the 1F (S2) data and reappearance in 3F (S0). d, Environment of Ca-bound W3, indicating the presence of a second water position for W3 in the S0 state (3F).
Fig. 5 |
Fig. 5 |. Schematic structures of the S states in the Kok cycle of PSII and proposed reaction sequences for O–O bond formation in the S4 state.
The likely position of Mn oxidation states (Mn3+ is depicted in orange, Mn4+ in purple) as well as protonation and deprotonation reactions are indicated for each S state; the proposed steps in the S2→S3 transition, including Ox insertion, are indicated in the dashed box with blue dashed arrows signifying atom movements. Three likely options (1, 2 and 3) for the final S3→S0 transition are given in the bottom part, including possible order of 1) electron and proton release; 2) O–O bond formation and O2 release; and 3) refilling of the empty substrate site.

Similar articles

Cited by

References

    1. Kok B, Forbush B & McGloin M Cooperation of charges in photosynthetic O2 evolution—I. A linear four step mechanism. Photochem. Photobiol 11, 457–475 (1970). - PubMed
    1. Joliot P, Barbieri G & Chabaud R A new model of photochemical centers in system-2. Photochem. Photobiol 10, 309–329 (1969).
    1. Hillier W & Wydrzynski T 18O-water exchange in photosystem II: substrate binding and intermediates of the water splitting cycle. Coord. Chem. Rev 252, 306–317 (2008).
    1. Yano J & Yachandra V Mn4Ca cluster in photosynthesis: where and how water is oxidized to dioxygen. Chem. Rev 114, 4175–4205 (2014). - PMC - PubMed
    1. Cox N & Messinger J Reflections on substrate water and dioxygen formation. Biochim. Biophys. Acta 1827, 1020–1030 (2013). - PubMed

Publication types