. 2018 Oct 15:9:1332.
doi: 10.3389/fphys.2018.01332. eCollection 2018.

Modeling Skeletal Muscle Laminopathies Using Human Induced Pluripotent Stem Cells Carrying Pathogenic LMNA Mutations

Affiliations

Modeling Skeletal Muscle Laminopathies Using Human Induced Pluripotent Stem Cells Carrying Pathogenic LMNA Mutations

Heather B Steele-Stallard et al. Front Physiol. .

Abstract

Laminopathies are a clinically heterogeneous group of disorders caused by mutations in LMNA. The main proteins encoded by LMNA are Lamin A and C, which together with Lamin B1 and B2, form the nuclear lamina: a mesh-like structure located underneath the inner nuclear membrane. Laminopathies show striking tissue specificity, with subtypes affecting striated muscle, peripheral nerve, and adipose tissue, while others cause multisystem disease with accelerated aging. Although several pathogenic mechanisms have been proposed, the exact pathophysiology of laminopathies remains unclear, compounded by the rarity of these disorders and lack of easily accessible cell types to study. To overcome this limitation, we used induced pluripotent stem cells (iPSCs) from patients with skeletal muscle laminopathies such as LMNA-related congenital muscular dystrophy and limb-girdle muscular dystrophy 1B, to model disease phenotypes in vitro. iPSCs can be derived from readily accessible cell types, have unlimited proliferation potential and can be differentiated into cell types that would otherwise be difficult and invasive to obtain. iPSC lines from three skeletal muscle laminopathy patients were differentiated into inducible myogenic cells and myotubes. Disease-associated phenotypes were observed in these cells, including abnormal nuclear shape and mislocalization of nuclear lamina proteins. Nuclear abnormalities were less pronounced in monolayer cultures of terminally differentiated skeletal myotubes than in proliferating myogenic cells. Notably, skeletal myogenic differentiation of LMNA-mutant iPSCs in artificial muscle constructs improved detection of myonuclear abnormalities compared to conventional monolayer cultures across multiple pathogenic genotypes, providing a high-fidelity modeling platform for skeletal muscle laminopathies. Our results lay the foundation for future iPSC-based therapy development and screening platforms for skeletal muscle laminopathies.

Keywords: 3D modeling; LMNA; disease modeling; iPSCs; lamin A/C; laminopathies; muscular dystrophy; skeletal muscle.


Figures

Figure 1
Figure 1
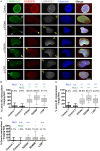
Differentiated LMNA-mutant human iPSCs express Lamin A/C and Lamin B1 and many have an abnormal nuclear shape. (A) Phase contrast images of the three LMNA mutant inducible myogenic cell lines K32del, R249W and L35P next to their respective electropherograms confirming the expected heterozygous, dominant, pathogenic LMNA mutations. (B) Representative immunofluorescence panel for Lamin A/C and Lamin B1 proteins showing abnormally-shaped nuclei and mislocalized Lamin B1 in all LMNA mutant lines (examples highlighted by arrowheads). Nuclei were counterstained with Hoechst. Scale bar: 50 μm.
Figure 2
Figure 2
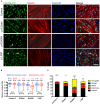
LMNA-mutant human iPSC-derived inducible myogenic cells have nuclei with abnormal morphology. (A) Representative examples of immunofluorescence showing nuclear morphology of LMNA-mutant HIDEMs K32del, R249W, and L35P (high magnification pictures from Figure 1B). Abnormal nuclear morphologies were classified into five categories: jelly bean, severely deformed, blebs, string or elongated, and examples of each are shown for each cell line, with their corresponding nuclear contour ratio values. Cells with normally-shaped circular/oval nuclei typically have a nuclear circularity of 1–0.79, whereas nuclear deformity reduces this ratio (indicated on each panel). Some mislocalization of Lamin A/C is also evident (white arrowheads). Scale bar: 20 μm. (B) Nuclear deformity in LMNA-mutant HIDEMs quantified using the nuclear contour ratio. One-way analysis of co-variance (ANOVA) with Tukey's post-hoc comparisons performed on the average values of the three repeats compared to each control line (n = 3, 152–334 nuclei assessed per repeat passage for each cell line); *p < 0.05, **p < 0.01, ***p < 0.001, ****p < 0.0001. Data are box plots generated from all circularity values across three repeats combined (a total of 663–755 nuclei were analyzed per cell line); whiskers: minimum and maximum values, +: average (specified also at the bottom of each column). (C) Quantification of prevalence of nuclear shape abnormalities, as well as normal shaped nuclei (circular or oval). Nuclei were considered elongated if they were >25 μm along their major axis. When present, nuclei with more than one type of abnormality were counted twice (e.g., blebs and elongated), so totals can exceed 100%. Number of normal shaped nuclei was compared between LMNA-mutant HIDEMs and control 1 (ref.1) and control 2 (ref.2). Between 81 and 167 nuclei were analyzed per cell line per repeat, apart from one repeat of control 1 where only 51 nuclei were assessed (a total of 248–355 nuclei were assessed per cell line). Statistics were performed on the average values of the three repeats (n = 3) compared to each control line, using one-way analysis of co-variance (ANOVA) with Tukey's post-hoc comparisons; *p < 0.05, **p < 0.01, ***p < 0.001, ****p < 0.0001.
Figure 3
Figure 3
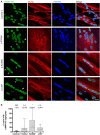
Confocal microscopy analysis in LMNA-mutant human iPSC-derived inducible myogenic cells shows mislocalization of Lamin A/C and Lamin B1. (A) Immunofluorescence for Lamin A/C, Emerin and Lamin B1 with Hoechst nuclear counterstain, showing aggregates of Lamin A/C protein in K32del, R249W, and L35P LMNA-mutant lines using analysis by confocal microscopy. Aggregates were either honeycomb-like in appearance (white closed arrow) or bright foci (white open arrow). Areas with Lamin A/C honeycombs/foci display a corresponding lack of Lamin B1 (yellow open arrows). Emerin-containing foci were also detected in some areas containing Lamin A/C foci (yellow closed arrow), however areas with honeycombs of Lamin A/C did not have observable corresponding honeycombs of Emerin, however Emerin immunolabeling was weak and so may be unable to detect honeycombing. Scale bar represents 10 μm. (B) Quantification of the proportion of LMNA-mutant HIDEMs with mislocalization of Lamin A/C. All LMNA-mutant HIDEMs had significantly more aggregates of Lamin A/C than each control cell line (ref.1 and 2) (C) LMNA-mutant HIDEMs had a significantly higher proportion of nuclei with Lamin B1 capping (absence at poles of nuclei) compared to control (ref.1 and 2). (D) Emerin mislocalization was significant for K32del or L35P in comparison to control 2 (ref.2) but not to control 1 (ref.1). In R249W it was significant compared to both control 1 and 2 (ref.1 and 2). We therefore judged overall this phenotype was only robust in R249W. Lamin A/C, Lamin B1 and Emerin data were statistically analyzed together using one-way analysis of co-variance (ANOVA), with Tukey's post-hoc comparisons. This analysis was performed on the average proportion of mislocalized from three passages per cell line (n = 3, between 82–178 cells analyzed per passage per cell line); *p < 0.05, ***p < 0.001, ****p < 0.0001 compared to each control. Data are box plots generated from the proportion of nuclei with mislocalized Lamin A/C per imaging field (24–33 imaging fields per cell line combined from three repeats, together containing 290–429 nuclei); whiskers: minimum and maximum values, +: average of all imaging fields.
Figure 4
Figure 4
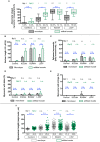
Terminal skeletal myogenic differentiation of LMNA-mutant iPSC-derived myotubes in monolayer culture and analysis of nuclear circularity and shape abnormalities. (A) Representative immunofluorescence for Lamin A/C and Myosin Heavy Chain (MyHC) on K32del, R249W, and L35P iPSCs HIDEMs induced to terminal myogenic differentiation by transient expression of a lentivirally-delivered, tamoxifen-inducible MyoD-ER transgene. Elongated nuclei and nuclear blebbing were visible (arrowheads). Scale bar: 100 μm. (B) Quantification of the average nuclear circularity of terminally differentiated LMNA-mutant iPSCs by measuring the contour ratio of nuclei within myotubes and those outside of myotubes. Refs = control. Data analyzed with two-way repeat measures ANOVA, with Tukey's post-hoc test for comparisons to control, and Sidak's post-hoc comparison for comparisons within each line. n = 3 independent experimental replicates, with 100–270 nuclei analyzed per cell line per repeat, except for one repeat in K32del where only 57 nuclei were found outside of myotubes. *p < 0.05, ****p < 0.0001. Data are box plots with the individual circularity values from all three repeats combined (275–715 nuclei per cell line in total). Whiskers: min and max values; +: average of all values. (C) Quantification of the prevalence of myonuclear shape abnormalities based on criteria established in HIDEMs (Figure 2). When present, nuclei with more than one type of abnormality were scored twice (e.g., blebs and elongated), so totals exceed 100%. The number of normally shaped nuclei was compared between LMNA-mutant HIDEMs and control 2 (ref). Between 78 and 348 nuclei were analyzed per cell line per repeat (a total of 260–710 nuclei were assessed per cell line). Statistics were performed on the average values of the three repeats (n = 3) compared to each control line, using one-way analysis of co-variance (ANOVA) with Tukey's post-hoc comparisons; *p < 0.05, ***p < 0.001.
Figure 5
Figure 5
LMNA-R249W produces Lamin A/C aggregates upon terminal skeletal myogenic differentiation of LMNA-mutant iPSCs in monolayer cultures. (A) Immunofluorescence for Lamin A/C and MyHC, with a Hoechst nuclear counterstain, showing aggregates of Lamin A/C protein in K32del, R249W, and L35P LMNA-mutant myotubes upon confocal microscopy analysis. Aggregates were either honeycomb-like in appearance (white open arrow) or bright foci (white closed arrow). (B) Although aggregates of Lamin A/C were seen in all LMNA-mutant myonuclei, only R249W was significant compared to control (ref.). One-way analysis of co-variance (ANOVA) with Tukey's post-hoc comparisons, on the average of three passages (n = 3, between 74 and 156 myonuclei analyzed per passage per cell line); *p < 0.05 compared to control myotubes. Data are plotted as box plots generated from the proportion of nuclei with mislocalized Lamin A/C per imaging field (21–56 imaging fields per cell line combined from three repeats, together containing 381 myonuclei); whiskers: minimum and maximum values, +: average of all imaging fields. Scale bar: 30 μm.
Figure 6
Figure 6
Abnormally elongated nuclei characterize LMNA-mutant iPSC-derived myotubes differentiated in either monolayer culture or as 3D artificial muscles. LMNA-mutant HIDEMs K32del, R249W, and L35P were either terminally differentiated into multinucleated myotubes in (A) monolayer cultures or (B) within 3D artificial muscles. Three dimensional computer-generated reconstructions from confocally-imaged cells immunolabeled for Lamin A/C and the myogenic markers embryonic myosin (eMyHC) or Titin. Arrows head: abnormally elongated nuclei. Scale bar: 20 μM.
Figure 7
Figure 7
Disease-associated nuclear abnormalities are more prevalent upon terminal myogenic differentiation of LMNA-mutant iPSCs in three-dimensional cultures. (A) Abnormal K32del, R249W, and L35P myotube nuclei were assessed from the three dimensional computer-generated reconstructions shown in Figure 6, based on shape abnormality criteria established in 2D image analysis in LMNA-mutant HIDEMs (Figure 2). Three statistical comparisons of the myonuclei are shown: LMNA-mutant to control within monolayer culture (ref.1, black), within artificial muscles LMNA-mutant to control (ref.2, green), within each line comparisons between 2D and 3D artificial muscle (blue). Data analyzed together using two-way ANOVA with Tukey's post-hoc comparisons for comparisons to control, and Sidak's for comparisons within lines on the average of three passages (n = 3, for monolayer cultures 82–154 myonuclei were analyzed per passage per cell line with a total of 272–410 per cell line, for artificial muscle 37–70 nuclei were analyzed, totaling 124–171 per cell line). Data are shown as box plots of proportion of abnormal nuclei per imaging field from all three repeats (22–44 total imaging fields per cell line combined from three repeats); whiskers: minimum and maximum values, +: average of all imaging fields. Values shown on graph: average of three repeats used for statistical analysis. (B–E) Quantification of the different types of shape abnormality shown in (A), based on criteria established in LMNA-mutant HIDEMs (Figure 2). As in (A), three types of comparisons are shown. Nuclei with more than one type of shape abnormality (e.g., blebs and elongation) were counted twice, therefore totals can exceed 100%. Data analyzed together using two-way ANOVA with Tukey's post-hoc test for comparisons to control, and Sidak's post-hoc test for comparisons within lines (n = 3). (F) Myonuclear length along the major nuclear axis. As in (A), three types of comparisons were performed. Data analyzed using two-way ANOVA with Tukey's post-hoc test for comparisons to control, and Sidak's post-hoc test for comparisons within lines (n = 3). Data are shown as a scatter plot comprised of all values from three repeats combined. Bars: mean and standard deviation. Nuclei were assessed to be part of a myotube based on location within a multinucleated myosin/titin-positives structure, and nuclear exclusion of myosin/titin. Data for non-myotube nuclei within the culture are not shown. *p < 0.05, **p < 0.01, ***p < 0.001, ****p < 0.0001.

Similar articles

Cited by

References

    1. Arimura T., Helbling-Leclerc A., Massart C., Varnous S., Niel F., Lacène E., et al. . (2005). Mouse model carrying H222P-Lmna mutation develops muscular dystrophy and dilated cardiomyopathy similar to human striated muscle laminopathies. Hum. Mol. Genet. 14, 155–169. 10.1093/hmg/ddi017 - DOI - PubMed
    1. Azibani F., Muchir A., Vignier N., Bonne G., Bertrand A. T. (2014). Striated muscle laminopathies. Semin. Cell Dev. Biol. 29, 107–115. 10.1016/j.semcdb.2014.01.001 - DOI - PubMed
    1. Bank E. M., Ben-Harush K., Feinstein N., Medalia O., Gruenbaum Y. (2012). Structural and physiological phenotypes of disease-linked lamin mutations in C. elegans. J. Struct. Biol. 177, 106–112. 10.1016/j.jsb.2011.10.009 - DOI - PubMed
    1. Bank E. M., Ben-Harush K., Wiesel-Motiuk N., Barkan R., Feinstein N., Lotan O., et al. . (2011). A laminopathic mutation disrupting lamin filament assembly causes disease-like phenotypes in Caenorhabditis elegans. Mol. Biol. Cell 22, 2716–2728. 10.1091/mbc.e11-01-0064 - DOI - PMC - PubMed
    1. Barateau A., Vadrot N., Vicart P., Ferreiro A., Mayer M., Héron D., et al. . (2017). A novel lamin a mutant responsible for congenital muscular dystrophy causes distinct abnormalities of the cell nucleus. PLoS ONE 12, 1–18. 10.1371/journal.pone.0169189 - DOI - PMC - PubMed