. 2018 Oct 22:9:1469.
doi: 10.3389/fphys.2018.01469. eCollection 2018.

Influence of Magnitude and Duration of Altered Gravity and Readaptation to 1 g on the Structure and Function of the Utricle in Toadfish, Opsanus tau

Affiliations

Influence of Magnitude and Duration of Altered Gravity and Readaptation to 1 g on the Structure and Function of the Utricle in Toadfish, Opsanus tau

Richard Boyle et al. Front Physiol. .

Abstract

Gravity has remained constant during animal evolution and the neural sensory systems detecting acceleration forces have remained remarkably conserved among vertebrates. The utricular organ senses the sum of inertial force due to head translation and head tilt relative to gravitational vertical. Change in gravitational force would be expected to have profound effects on how an organism maintains equilibrium. We characterize the physiology of utricular afferents to applied accelerations in the oyster toadfish, Opsanus tau, in normal 1 g to establish benchmarks, after 1-32-day exposures to 2.24 g (resultant) via centrifugation (hypergravity, HG), after 4- and 16-day exposures to 1.12 g (resultant), and following 1-8 days recovery to HG exposures to study re-adaptation to 1 g. Afferents were also examined during activation of efferent vestibular pathway. Centrifugation at 2.24 g included 228°/s constant angular velocity component, and thus horizontal canal afferent responses to yaw rotation were recorded as an internal control in each fish. Afferents studied after 228°/s rotation for 4 and 16 days without centripetal acceleration, called On-Center-Control, were indistinguishable from their control counterparts. Principal response to HG was an adjustment of afferent sensitivity as a function of magnitude and duration of exposure: an initial robust increase at 3-4 days followed by a significant decrease from 16 to 32 days. Initial increase observed after 4 days of HG took >4 days in 1 g to recover, and the decrease observed after 16 days of HG took >2 days to readapt to 1 g. Hair cells in striola and medial extrastriola macula regions were serially reconstructed in 3D from thin sections using transmission electron microscopy in control fish and fish exposed to 4 and 16 days of HG. Despite the highly significant differences in afferent physiology, synaptic body counts quantified in the same fish were equivalent in their inter-animal variability and averages. No clear role of the efferent pathway as a feedback mechanism regulating afferent behavior to HG was found. Transfer from 1 g to HG imparts profound effects on gravitational sensitivity of utricular afferents and the accompanying transfer from the HG back to the 1 g resembles in part (as an analog) the transfer from 1 g to the micrograms.

Keywords: acceleration; afferents; centrifugation; electrophysiology; gravity; hair cells; serial electron microscopy reconstruction; spaceflight.


Figures

FIGURE 1
FIGURE 1
Experimental and testing devices. (A) Ground-based centrifuge was used to apply centripetal force by constant velocity rotation within a concomitant 1 g environment. Centrifuge had four gondolas (labeled A1) positioned at a radial distance of 1.22 m from center of axis of rotation. Each gondola was gimbaled with one-degree of freedom to deliver a constant gravity vector onto fish at any given rotational rate. Self-contained aquarium systems (labeled A2) were developed to permit life support for one fish in each gondola consisting of mechanical and biological filtrations, cooling, and oxygenation within a 12:12 light:dark cycle. Fish were unrestrained during centrifugation and their behavior was captured in light using video. (B) Acceleration testing device was designed and fabricated to study afferent responses to controlled translational motions delivered along the tandem rails labeled B6 and B7 at any head orientation via yaw rotation controlled by motor labeled B3. The motor labeled B4 delivered tilt stimulation from pitch to roll. See text for more details.
FIGURE 2
FIGURE 2
Method to identify and count synaptic bodies (ribbons) in utricular hair cells. (A, B) Two consecutive transmission electron microscopic images (12,500× magnification) reveal the same SB (arrow in each panel) in the hair cell. Scale bar, 1 μm. (C) Two-dimensional cartoon of method used to tabulate and characterize the unique synaptic bodies in each hair cell reconstructed in 3D from 150 serial sections of 180 nm thickness. Two 100 μm width patches separated by 150 μm in striola (shown with the reversal line) and medial extrastriola regions of macula were examined in same fish in which afferent recordings were collected. Sections were viewed at 500–20,000× to verify synaptic bodies within the section and carried over into adjacent sections. Synapse characterization is based on following criteria. Single body: most common and do not share synaptic vesicles with nearby bodies if present. Pair: less common with two synaptic bodies sharing vesicles on one section, or adjacent sections. Group: least common with ≥3 bodies sharing vesicles on one section, or across multiple serial sections.
FIGURE 3
FIGURE 3
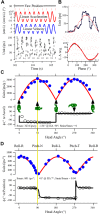
Uricular afferent response properties. (A) Recorded data of afferent response in control fish show IR modulation to sinusoidal linear acceleration at 2 Hz collected over time from 301 to 305.5 s. Traces from top to bottom: (1) yaw position of fish (set at 90°). (2) Linear acceleration of sled in ±cm/s2. (3) Linear velocity of sled in ±cm/s. (4) Instantaneous IR in impulses per second (ips). (B) Data in A were averaged and displayed as phase histogram; upper trace is unit IR (ips) and lower trace is stimulus acceleration (LA) in g (dotted curves represent the 1st harmonic fit to the stimulus and response). (C) Directional selectivity of utricular afferents. Responses were analyzed at 21 separate orientations of fish in space shown in the abscissa from 0° (positive linear acceleration directed in horizontal plane out fish’s snout) to accelerations directed in horizontal plane out fish’s right (90°) or left (270°) ear and at orientations in between. Cartoons give at five positions of fish to help visualize the stimulus. Maximum response (in ips/g) was calculated at each orientation and plotted as a function of head angle (in °). A cosine function (red curve) was applied to data to determine degree of spatial tuning, directional selectivity, and response maximum (Smax) and its minimum (Smin). In this example Smax was 3234 ips/g at 90° (comparable at 270°) and afferent was highly spatially tuned (Smin/Smax = 0). (D) Responses of same afferent to sinusoidal tilt simulation at 2 Hz, ±0.11° displacement. Format is same as in C. Upper trace gives a broad description of stimulus, from Roll with Right ear down at 0°, Pitch with Nose down at 90°, Roll with Left ear down at 180°, and Pitch with Tail down at 270°. Yellow vertical line between C and D is given to provide the 90° offset of the two stimuli by the lab-defined coordinate scheme, and how closely the responses match. Smax for tilt was 801 ips/° at 7° head angle, and the spatial tuning was tight (Smin/Smax = 0.04).
FIGURE 4
FIGURE 4
Sampling bias consideration. (A) Low magnitude scanning electron micrograph of the left utricular macula was flipped 180° to correspond to the right utricle for comparison with data in B. View from above rostral is up and medial is left (see key in upper left corner). Utricular macula is outlined in yellow, the reversal line in striola region is in red; more details of the utricle morphology can be found in Boyle et al. (2018). From left to right (medial to lateral): large medial extrastriola (asterisk), a striola zone on either side of the reversal line (red line), and a relatively narrow lateral extrastriola region approaching the ampullae of the anterior (AC) and horizontal (HC) semicircular canals. Hair bundle on each hair cell is morphological polarized and broadly depicted as blue arrows pointing from the shortest stereocilia to the kinocilium, and the polarization flips at the reversal line (red line). (B) Afferent responses (ips/g) are plotted in a polar graph as a function of head angle (°) at Smax for control fish and for fish exposed to 2.24 g for 4 or 16 days. Head angle at Smax of recorded responses was consistent for all fish, indicating no evidence of sampling bias from one region to another or between experimental groups. Right-hand rule was used, and 0° is + acceleration out the fish’s snout, 90° out the ipsilateral (right) ear, 180° out the fish’s tail, and 270° out the contralateral (left) ear (depicted in upper right corner in A). Also note that the majority of afferents recorded in these three separate conditions showed responses aligned to innervating hair cells in the medial extrastriola.
FIGURE 5
FIGURE 5
Correlation of response sensitivity and discharge properties in fish exposed to different levels of HG. A positive and significant (p < 0.001) correlation persisted between Smax (ips/g) and average IR at Smax (ips/cycle) for the 162 control afferents (A), the 153 afferents tested after 4 days at 2.24 g (B), and the 177 afferents tested after 16 days at 2.24 g (C).
FIGURE 6
FIGURE 6
Different afferent behaviors to tilt in control fish. (A) Robust responses to both dynamic and static tilt displacements in control afferent. Upper trace is tilt displacement (in °) and lower trace is instantaneous IR (ips) over a continuous recording of ∼750 s. Insert shows an expanded portion early in the record during 2Hz, ±0.16°, sinusoidal tilt. Tilt stimulus was delivered at a head angle of 345°, or nearly a pure roll stimulus, with right side (positive values) down and ipsilateral to recorded afferent. Static displacements were delivered at the same head angle starting with right side down and hold, a tilt in the opposite direction to normal horizontal position and hold, a left side down and hold, and a return tilt in the opposite direction to normal horizontal position and hold. Fast (red curve) and slow (yellow curve) time constants of return to baseline IR were seen in the excitatory direction of tilt. Tilt stimuli in the opposite direction, contralateral to recording site, silenced the afferent in both instances. (B1) Different control afferent has a response to dynamic, but not static, tilt displacements. Same format as A. Sinusoidal 2 Hz tilts (±0.14°) were delivered before and after ±3° static displacements and are marked B2 and B3. Phase histograms in panels B2 and B3 show the corresponding averaged modulation of 332 and 260 ips/°, and peak modulation lead position by 9.4 and 17.4°, respectively, respectively. During static displacements at the afferent Smax of 135°, midway between left side down roll and tail down pitch, afferent maintained a near constant IR of 41–45 ips (labeled on tilt trace).
FIGURE 7
FIGURE 7
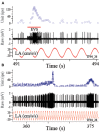
Electrically evoked (A) or self-generated (B) efferent vestibular system (EVS) activation elevates afferent rate and reduces or even blocks its response to linear acceleration. In the absence of EVS activation afferent showed an averaged response of 2 Hz linear acceleration. During a brief pulse train of EVS stimulation (A), afferent IR was elevated and its response to applied acceleration disrupted. This result is also seen when the fish activated the EVS on its own as seen in the two epochs in B. Self-generated epochs of EVS activation excite the afferent with differing patterns and alter its response to an applied perturbation. Traces in A and B are from top to bottom instantaneous firing rate (Unit, ips), EVS pulse train, raw voltage of afferent (mV), and the applied linear acceleration (LA, in cm/s2).
FIGURE 8
FIGURE 8
EVS activation elevates IR and partially shunts afferent response to linear acceleration. (A) Afferent response to 2 Hz (±0.24°) sinusoidal pure nose-down pitch in absence and presence of electrical EVS stimulation. Segment of record without EVS stimulation (time ∼350 s) is highlighted in blue box in A and the corresponding averaged response histogram is given in B; a similar portion of record in A is captured during EVS stimulation and highlighted in yellow box and its corresponding averaged response histogram is given in C. (B) During control cycles, afferent responded with a ±15.5 ips modulation about a discharge rate of 11.6 ips, and averaged ±63.6 ips/° and a phase lag re: position of –39°. (C) During cycles with combined EVS stimulation, modulation dropped by ∼50% to ±7.4 ips, now centered about an elevated discharge rate of 51.9 ips, and averaged sensitivity was reduced by about one-half to 31.4 ips/° and the phase lag (–34°) remained unaffected in the selected portion of the record. Traces in A from top to bottom: position of yaw axis at 90° during tilt stimulus corresponding to roll tilt, instantaneous firing rate (in ips), EVS epochs, and raw voltage of afferent (in mV). (B, C) Averaged responses from selected portions of the record in A. Ordinates in B and C are equivalent to show the elevation in discharge rate and reduction of response modulation (see text for further explanation).
FIGURE 9
FIGURE 9
Effect of reduced and enhanced gravity on maximum response sensitivity (Smax) of utricular afferents. (A) Data were collected after microgram exposure on STS-90 and -95 orbital shuttle missions (modified Figure 3 of Boyle et al., 2001). Percent plot shows the afferent Smax as a function of time after landing in hours from first (10–16 h) to last (112–117 h) recording session. Within the first day after landing, Smax (red circles) to an applied linear acceleration was significantly (p < 0.01; ) greater than for controls (solid black line). Sensitivity returned to near normal values after ∼30 h following landing, as revealed by the data collected in the same fish at varying hours of delay after landing and indicated by separate symbols. (B, insert) OCCs at 4 and 16 days of exposure to 228°/s (38 rpm) constant angular velocity to mimic the rotation during 2.24 g centrifugation are plotted in four fish each together with non-rotated control afferents. Smax was indistinguishable in the three control groups and revealed no influence of rotation alone on response behavior of utricular afferents (insert). (B) Mean Smax of control afferents to a standard translation is 2103 ± 1314 (SD; n = 162) ips/g, and their responses lie on the solid black trace in percent plot. Afferent responses within each group for designated days of 2.24 g (1 day, 2 days, …) exposures are given with separate symbols and traces as indicated in the key. A significant elevation of Smax at 3-day (n = 228 afferents) and 4-day (n = 153 afferents) was observed (p < 0.0001; ∗∗∗); 90–100% of the afferents in these groups had a markedly greater Smax than the 162 control afferents. The elevation was followed by several days (5 to ≥8 days) of normal afferent sensitivity and then by a significant decrease at 16-day (n = 245 afferents; p < 0.0001; ∗∗∗), 24-day (n = 177 afferents; p < 0.005; ∗∗), and 32-day (n = 192 afferents; p < 0.005; ∗∗). Number of afferents recorded in each group is given in parentheses.
FIGURE 10
FIGURE 10
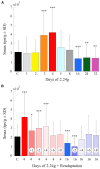
Afferent Smax as a function of days of exposure to 2.24 g and readaptation after return to normal 1 g environment. (A) Histogram plots the mean afferent Smax (ips/g ± SD) (same data as shown in Figure 9B) against time of exposure to centrifugation (in days). (B) Histogram plots afferent Smax as a function of number of days (indicated by number inside of each column) in normal 1 g after 4- and 16-day exposures to centrifugation to the return to baseline levels. Initial hypersensitivity recorded immediately after 4-day exposures (solid red unlabeled column) required >4 days to recover to control levels. The later hyposensitivity observed after 16-day exposures (solid blue unlabeled column) required at least 2 days to recover. In each panel error bars are ±SD, the left column labeled C is the control response values, and asterisks designate the level of significance of p < 0.05 (), p < 0.005 (∗∗), and p < 0.0001 (∗∗∗) to control measures.
FIGURE 11
FIGURE 11
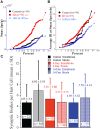
Direct comparison of physiology of afferents as a function of duration of exposure to 2.24 g to synaptic organization of hair cells in the same fish. (A) Percent plot of Smax shows significantly higher Smax in 4-day (4945 ± 2823 SD imp/s/g; n = 93) and significantly lower Smax (p < 0.002) in 16-day (1245 ± 1097 SD imp/s/g; n = 89) fish from controls (2045 ± 1314 SD imp/s/g; n = 39). (B) The average IR (in ips/cycle) during acceleration at Smax also differed between afferents in these groups: rate was significantly lower in the 16-day (28 ± 15 SD ips/cycle), and higher, but not significantly so, in 4-day (46 ± 21 SD ips/cycle) fish from the control afferents (39 ± 24 SD ips/cycle). Level of significance (ANOVA): p < 0.0001 (∗∗∗), p < 0.002 (∗∗), and p > 0.01 (). (C) Number of synaptic bodies per hair cell was determined using 3D computerized serial reconstruction techniques at transmission electron microscopy level from 150 sections of 180 nm thickness from two macular regions, one straddling the reversal line (shaded columns) and the other 150 μm away in the medial extrastriola (solid columns), in control fish (black) and fish exposed to 2.24 g for 4 (red) and 16 (blue) days. Average (±SD) number of synaptic bodies is given above each column. Number (n =) of completely reconstructed hair cells used in this analysis was large and ranged from 223 to 575 hair cells as indicated. Variability within each group was very large and thus, despite the high number of reconstructed hair cells, SB densities in the two macular regions were NOT significantly different between control and centrifuged fish despite the highly significant differences in their responses to acceleration.

Similar articles

Cited by

References

    1. Aceto J., Nourizadeh-Lillabadi R., Marée R., Dardenne N., Jeanray N., Wehenkel L., et al. (2105). Zebrafish bone and general physiology are differently affected by hormones or changes in gravity. PLoS One 10:e0126928. 10.1371/journal.pone.0126928 - DOI - PMC - PubMed
    1. Angelaki D. E. (1991). Dynamic polarization vector of spatially tuned neurons. IEEE Trans. Biomed. Eng. 38 1053–1060. 10.1109/10.99068 - DOI - PubMed
    1. Angelaki D. E., Bush G. A., Perachio A. A. (1993). Two-dimensional spatiotemporal coding of linear acceleration in vestibular nuclei neurons. J. Neurosci. 13 1403–1417. - PMC - PubMed
    1. Anderson J. H., Blanks R. H., Precht W. (1978). Response characteristics of semicircular canal and otolith systems in cat. I. Dynamic responses of primary vestibular fibers. Exp. Brain Res. 32 491–507. 10.1007/BF00239549 - DOI - PubMed
    1. Angelaki D. E., Dickman J. D. (2000). Spatiotemporal processing of linear acceleration: primary afferent and central vestibular neuron responses. J. Neurophysiol. 84 2113–2132. 10.1152/jn.2000.84.4.2113 - DOI - PubMed

LinkOut - more resources