Review
. 2018 Oct 22:9:1472.
doi: 10.3389/fphys.2018.01472. eCollection 2018.

Shining New Light on the Structural Determinants of Cardiac Couplon Function: Insights From Ten Years of Nanoscale Microscopy

Affiliations
Review

Shining New Light on the Structural Determinants of Cardiac Couplon Function: Insights From Ten Years of Nanoscale Microscopy

Izzy Jayasinghe et al. Front Physiol. .

Abstract

Remodelling of the membranes and protein clustering patterns during the pathogenesis of cardiomyopathies has renewed the interest in spatial visualisation of these structures in cardiomyocytes. Coincidental emergence of single molecule (super-resolution) imaging and tomographic electron microscopy tools in the last decade have led to a number of new observations on the structural features of the couplons, the primary sites of excitation-contraction coupling in the heart. In particular, super-resolution and tomographic electron micrographs have revised and refined the classical views of the nanoscale geometries of couplons, t-tubules and the organisation of the principal calcium handling proteins in both healthy and failing hearts. These methods have also allowed the visualisation of some features which were too small to be detected with conventional microscopy tools. With new analytical capabilities such as single-protein mapping, in situ protein quantification, correlative and live cell imaging we are now observing an unprecedented interest in adapting these research tools across the cardiac biophysical research discipline. In this article, we review the depth of the new insights that have been enabled by these tools toward understanding the structure and function of the cardiac couplon. We outline the major challenges that remain in these experiments and emerging avenues of research which will be enabled by these technologies.

Keywords: cardiac muscle; couplons; localization microscopy; ryanodine receptors; super-resolution.


Figures

FIGURE 1
FIGURE 1
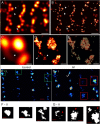
View of the t-system and couplons of rat ventricular myocytes. (A) An isosurface reconstruction of the t-tubular network in a myocyte imaged with confocal microscopy in transverse orientation. The regions coloured in red and green respectively are tubules at two adjacent Z-discs; tubules extending between the Z-discs are coloured in purple. (B) A transverse view of punctate RyR staining in a myocyte visualised with high resolution confocal imaging; (C) Magnified view of the RyR clusters (red hot) of the region demarcated in (B), overlaid with the corresponding t-tubule staining (grey). The typical distance between neighbouring clusters detected with this method was ∼650 nm. Examples of ‘non-junctional’ clusters which did not align with the t-tubules are noted with arrowheads. Scale bars, (A,B): 2 μm, (C): 500 nm. All data re-rendered from Jayasinghe et al. (2009).
FIGURE 2
FIGURE 2
Improved visualisation and analysis of clustered RyR organisation in peripheral couplons of rat ventricular myocytes with dSTORM super-resolution. (A) RyR labelling near the surface of a myocyte in diffraction-limited view of RyR clusters, many of which are oblong or elongated in shape. (B) The dSTORM image corresponding to the region shown in (A). (C,D) Magnified views of matching diffraction-limited and dSTORM images from a few peripheral couplons. Note the small clusters and likely unitary RyRs [indicated in (A–D) by arrowheads] are undetectable in the diffraction-limited data. (E) To quantify cluster sizes (in RyRs/cluster), quasi-crystalline 30 × 30 nm assembly of RyRs in the regions of labelling was assumed. (F-i) Macquaide et al. (2015) compared deconvolved STED images of RyR labelling of healthy sheep atrial myocytes (control) with (G-i) RyR labelling in atrial myocytes of a sheep model of atrial fibrillation (AF). Compared to control (F-ii), the AF myocytes (G-ii) consisted of a higher frequency of smaller RyR cluster (arrows) and a smaller inter-cluster spacings, as illustrated by the magnified views of the clusters outlined in (F,G-i). Scale bars, (A,B): 1 μm, (C–E): 150 nm, (F,G-i): 500 nm, (F,G-ii): 200 nm. (F,G) Adapted with permission from Macquaide et al. (2015).
FIGURE 3
FIGURE 3
Dilatation of t-tubules in disease and ageing. (A) Dilated sheet-like tubules (red) were observed in x-y (upper) and x-z view (lower) by Seidel et al. (2017) in ventricular tissues of patients with chronic heart failure. (B) Magnified views illustrate how a subset of RyR clusters (green) appeared to align with these sheet-like tubules (red). (C) Similar sheet-like tubules were observed by us in confocal micrographs of ventricular muscle tissue from a human patient with end-stage idiopathic dilated cardiomyopathy (IDCM). (D) Magnified view illustrates how a majority of local RyR clusters (grey) are re-arranged along the sheet-like tubules (extending longitudinally, shown in red) instead of maintaining the sarcomeric pattern (transverse). (E,F) Compared, are dSTORM images from transverse tissue sections of ventricular cells of young adult (9-weeks old) and aged (100 weeks) stained for t-tubule marker Caveolin-3, respectively. Whilst local dilatations or pockets were observed in the t-tubules in both age groups (arrowheads), macro-tubules (typically > 300 nm in diameter; asterisk in D) were observable. (G,H-i) Super resolution of both normal and IDCM t-tubules revealed Collagen-VI (red) encased within the tubule lumina whilst dystrophin (green) lined the tubules (magnified view shown in G,H-ii). (G,H-iii) Illustrate how the limited resolution in the equivalent confocal data fail to reveal this spatial feature in non-dilated t-tubules (in the non failing myocardium). Scale bars: (A): 10 μm, (B): 2 μm, (C): 15 μm, (D): 2 μm, (E,F): 2 μm. (G-i,Hi): 1 μm, (G-ii,iii,H-ii,iii): 250 nm. (A,B) Adapted from Seidel et al. (2017) with permission; (E,F) from Crossman et al. (2017) with permission.
FIGURE 4
FIGURE 4
Adaptation of DNA-PAINT to mapping RyR in peripheral couplons of rat cardiomyocytes. (A) DNA-PAINT relies on the thermally driven stochastic and reversible binding between a fluorescently labelled ‘imager’ DNA oligo and a ‘docking’ DNA oligo which in this scenario is linked to the anti-RyR antibody. Markers near the cell surface are illuminated with a TIRF excitation field. Shown, is a comparison of (B) conventional TIRF, (C) dSTORM and (D) DNA-PAINT images of an RyR cluster, highlighting the detection of finer punctate labelling densities which are unique to the latter (arrowheads). (E) Example of an approximate reconstruction of individual RyR arrangement (red) and hypothesised accessory proteins such as JPH2 (green) based on the RyR positions reported by an experimental DNA-PAINT image of a peripheral couplon (inset). (F) Histogram illustrating the distribution of JPH2 to RyR ratios [mean 1.38, mode at 1.25 and a width of 0.5 (standard deviation), n = 250 clusters (containing ≥ 15 RyRs)]. Inset illustrates examples of three adjacent couplons exhibiting JPH2/RyR ratios ranging between 0.53 and 1.35 (RyR shown in red and JPH2 in green). Scale bars: (B–D): 50 nm, (E): 100 nm, (F): 250 nm. All panels adapted from Jayasinghe et al. (2018).
FIGURE 5
FIGURE 5
Evolving view of RyR arrangement within couplons. (A) The classic model of quasi-crystalline arrangement of RyR and near-uniform co-clustering with JPH2 within well-filled couplon sections. (B) Revised model based on tomographic EM and DNA-PAINT data proposing looser arrangement of RyRs and variable co-clustering with JPH. Inset illustrates the scenario where a diagonal (‘checkerboard’) arrangement of RyRs could be achieved even in the loosely arranged clusters. Adapted from Jayasinghe et al. (2018).

References

    1. Abbe E. (1873). Beiträge zur theorie des mikroskops und der mikroskopischen wahrnehmung. Arch. Mikrosk. Anat. 9 413–418. 10.1007/BF02956173 - DOI
    1. Asghari P., Schulson M., Scriven D. R., Martens G., Moore E. D. (2009). Axial tubules of rat ventricular myocytes form multiple junctions with the sarcoplasmic reticulum. Biophys. J. 96 4651–4660. 10.1016/j.bpj.2009.02.058 - DOI - PMC - PubMed
    1. Asghari P., Scriven D. R., Sanatani S., Gandhi S. K., Campbell A. I., Moore E. D. (2014). Nonuniform and variable arrangements of ryanodine receptors within mammalian ventricular couplons. Circ. Res. 115 252–262. 10.1161/CIRCRESAHA.115.303897 - DOI - PubMed
    1. Auer A., Strauss M. T., Schlichthaerle T., Jungmann R. (2017). Fast, background-free DNA-PAINT imaging using FRET-based probes. Nano Lett. 17 6428–6434. 10.1021/acs.nanolett.7b03425 - DOI - PubMed
    1. Baddeley D., Jayasinghe I. D., Lam L., Rossberger S., Cannell M. B., Soeller C. (2009). Optical single-channel resolution imaging of the ryanodine receptor distribution in rat cardiac myocytes. Proc. Natl. Acad. Sci. U.S.A. 106 22275–22280. 10.1073/pnas.0908971106 - DOI - PMC - PubMed