

Multimodal Neuroimaging Approach to Variability of Functional Connectivity in Disorders of Consciousness: A PET/MRI Pilot Study
- PMID: 30405513
- PMCID: PMC6200912
- DOI: 10.3389/fneur.2018.00861
Multimodal Neuroimaging Approach to Variability of Functional Connectivity in Disorders of Consciousness: A PET/MRI Pilot Study
Abstract
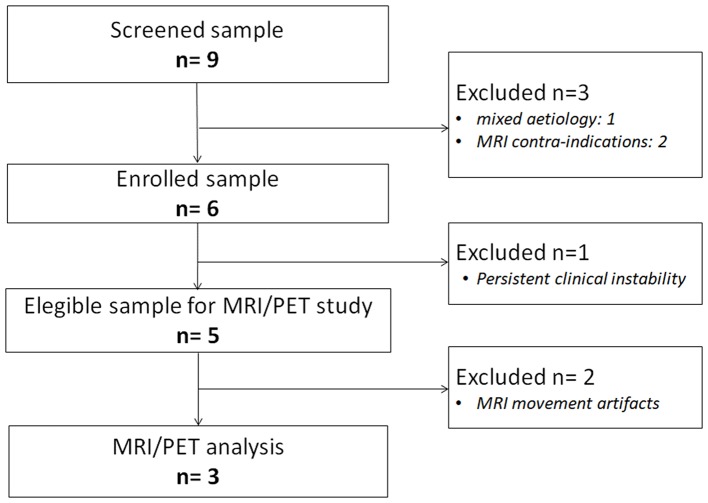
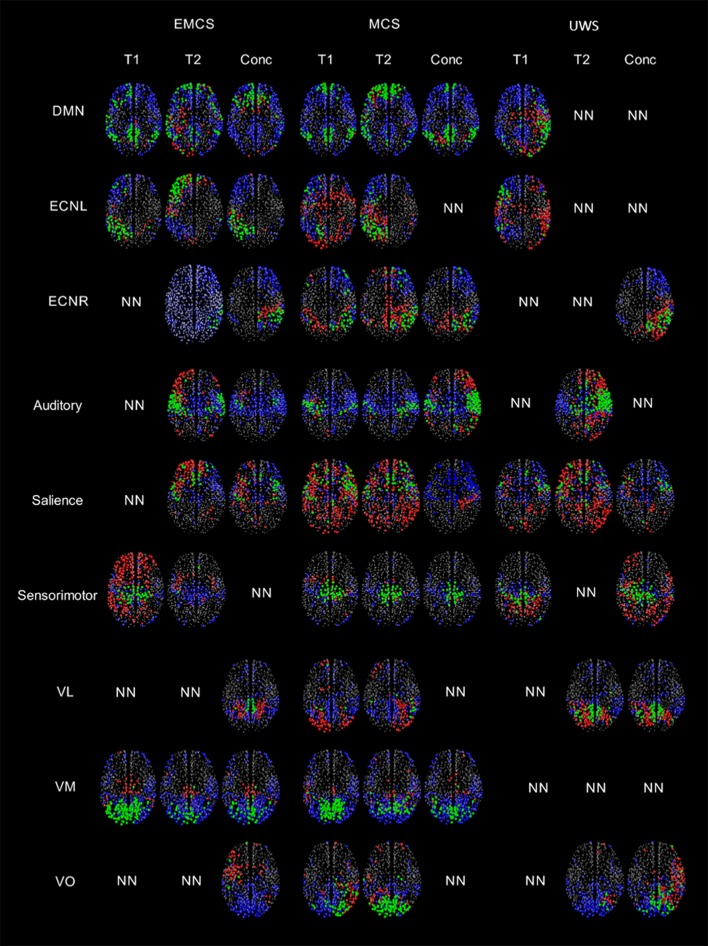
Behavioral assessments could not suffice to provide accurate diagnostic information in individuals with disorders of consciousness (DoC). Multimodal neuroimaging markers have been developed to support clinical assessments of these patients. Here we present findings obtained by hybrid fludeoxyglucose (FDG-)PET/MR imaging in three severely brain-injured patients, one in an unresponsive wakefulness syndrome (UWS), one in a minimally conscious state (MCS), and one patient emerged from MCS (EMCS). Repeated behavioral assessment by means of Coma Recovery Scale-Revised and neurophysiological evaluation were performed in the two weeks before and after neuroimaging acquisition, to ascertain that clinical diagnosis was stable. The three patients underwent one imaging session, during which two resting-state fMRI (rs-fMRI) blocks were run with a temporal gap of about 30 min. rs-fMRI data were analyzed with a graph theory approach applied to nine independent networks. We also analyzed the benefits of concatenating the two acquisitions for each patient or to select for each network the graph strength map with a higher ratio of fitness. Finally, as for clinical assessment, we considered the best functional connectivity pattern for each network and correlated graph strength maps to FDG uptake. Functional connectivity analysis showed several differences between the two rs-fMRI acquisitions, affecting in a different way each network and with a different variability for the three patients, as assessed by ratio of fitness. Moreover, combined PET/fMRI analysis demonstrated a higher functional/metabolic correlation for patients in EMCS and MCS compared to UWS. In conclusion, we observed for the first time, through a test-retest approach, a variability in the appearance and temporal/spatial patterns of resting-state networks in severely brain-injured patients, proposing a new method to select the most informative connectivity pattern.
Keywords: PET/MRI; brain connectivity; diagnosis; glucose metabolism; graph theory; minimally conscious state; resting-state fMRI; unresponsive wakefulness syndrome.
Figures

Similar articles
-
Neural correlates of consciousness in patients who have emerged from a minimally conscious state: a cross-sectional multimodal imaging study.Lancet Neurol. 2016 Jul;15(8):830-842. doi: 10.1016/S1474-4422(16)00111-3. Epub 2016 Apr 27. Lancet Neurol. 2016. PMID: 27131917
-
A Heartbeat Away From Consciousness: Heart Rate Variability Entropy Can Discriminate Disorders of Consciousness and Is Correlated With Resting-State fMRI Brain Connectivity of the Central Autonomic Network.Front Neurol. 2018 Sep 12;9:769. doi: 10.3389/fneur.2018.00769. eCollection 2018. Front Neurol. 2018. PMID: 30258400 Free PMC article.
-
Regional Homogeneity Alterations in Patients with Impaired Consciousness. An Observational Resting-State fMRI Study.Neuroradiology. 2022 Jul;64(7):1391-1399. doi: 10.1007/s00234-022-02911-2. Epub 2022 Feb 2. Neuroradiology. 2022. PMID: 35107592
-
Functional neuroanatomy of disorders of consciousness.Epilepsy Behav. 2014 Jan;30:28-32. doi: 10.1016/j.yebeh.2013.09.014. Epub 2013 Oct 5. Epilepsy Behav. 2014. PMID: 24100252 Review.
-
Disorders of Consciousness: Painless or Painful Conditions?-Evidence from Neuroimaging Studies.Brain Sci. 2016 Oct 8;6(4):47. doi: 10.3390/brainsci6040047. Brain Sci. 2016. PMID: 27740600 Free PMC article. Review.
Cited by
-
Evaluation of consciousness rehabilitation via neuroimaging methods.Front Hum Neurosci. 2023 Sep 14;17:1233499. doi: 10.3389/fnhum.2023.1233499. eCollection 2023. Front Hum Neurosci. 2023. PMID: 37780959 Free PMC article. Review.
-
Validation of a pharmacological imaging challenge using 11C-buprenorphine and 18F-2-fluoro-2-deoxy-D-glucose positron emission tomography to study the effects of buprenorphine to the rat brain.Front Neurosci. 2023 May 10;17:1181786. doi: 10.3389/fnins.2023.1181786. eCollection 2023. Front Neurosci. 2023. PMID: 37234261 Free PMC article.
-
The Constrained Disorder Principle May Account for Consciousness.Brain Sci. 2024 Feb 23;14(3):209. doi: 10.3390/brainsci14030209. Brain Sci. 2024. PMID: 38539598 Free PMC article. Review.
-
Relationships between serotonin availability and frontolimbic response to fearful and threatening faces.Sci Rep. 2023 Jan 27;13(1):1558. doi: 10.1038/s41598-023-28667-0. Sci Rep. 2023. PMID: 36707612 Free PMC article.
-
Simultaneous EEG-fMRI for Functional Neurological Assessment.Front Neurol. 2019 Aug 13;10:848. doi: 10.3389/fneur.2019.00848. eCollection 2019. Front Neurol. 2019. PMID: 31456735 Free PMC article. Review.
References
LinkOut - more resources
Full Text Sources
Medical
Miscellaneous