. 2018 Oct 24:9:2345.
doi: 10.3389/fmicb.2018.02345. eCollection 2018.

The Endophytic Mycobiome of European Ash and Sycamore Maple Leaves - Geographic Patterns, Host Specificity and Influence of Ash Dieback

Affiliations

The Endophytic Mycobiome of European Ash and Sycamore Maple Leaves - Geographic Patterns, Host Specificity and Influence of Ash Dieback

Markus Schlegel et al. Front Microbiol. .

Abstract

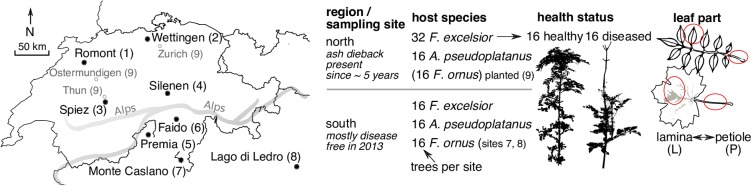
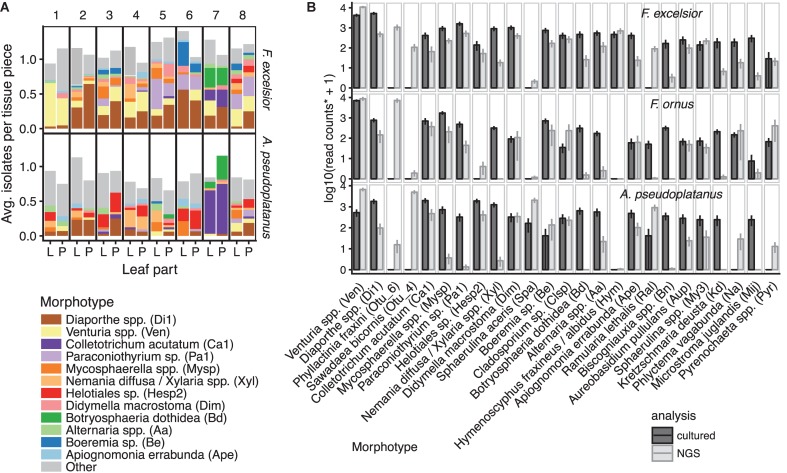
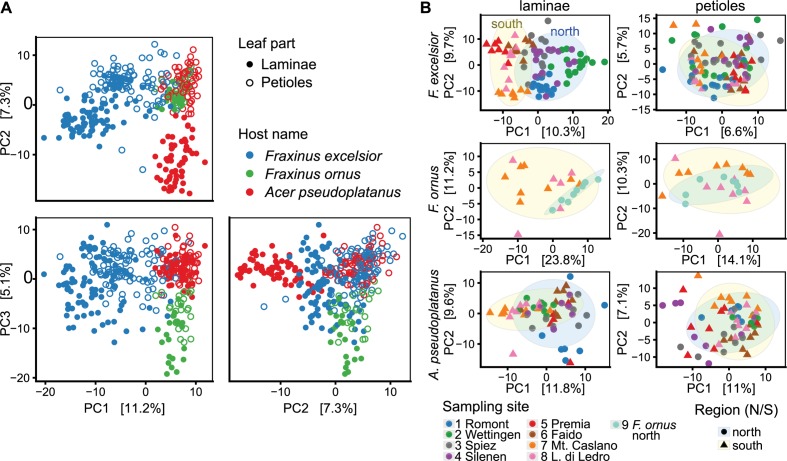
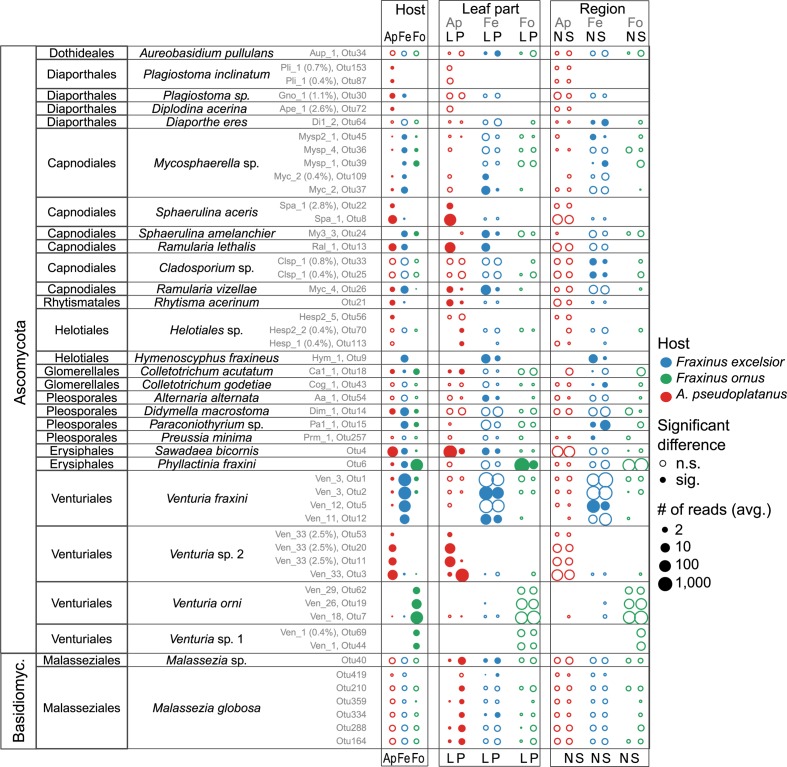
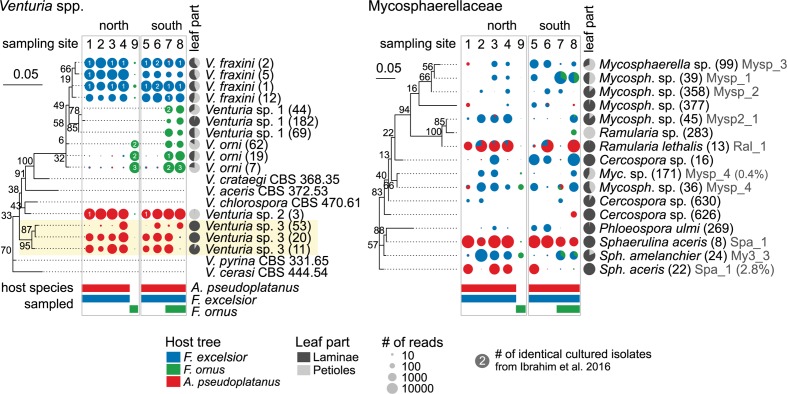
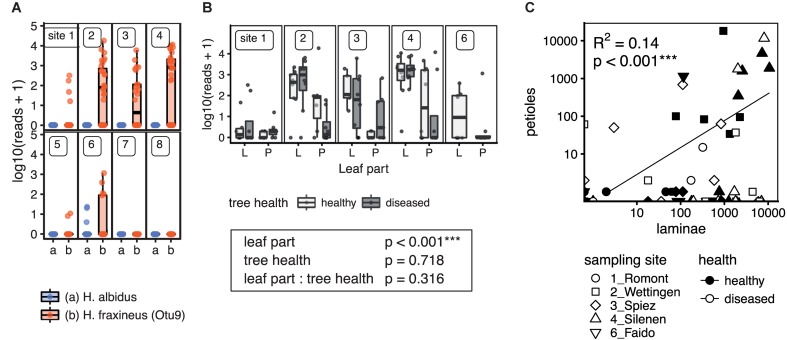
The European ash (Fraxinus excelsior) is threatened by the introduced ascomycete Hymenoscyphus fraxineus, the causal agent of ash dieback. Endophytic fungi are known to modulate their host's resistance against pathogens. To understand possible consequences of ash dieback on the endophytic mycobiome, F. excelsior leaves were collected in naturally regenerated forests and the fungal communities analyzed by classic culture and Illumina amplicon sequencing using a newly developed and validated fungal-specific primer. Collections were done in the area infested by ash dieback north of the Alps, and in the disease free area on the south side. Sycamore maple (Acer pseudoplatanus) was additionally collected, as well as the flowering ash (F. ornus), which occurs naturally in the south and shows tolerance to ash dieback. Both cultivation and amplicon sequencing revealed characteristic endophytic fungal communities dominated by several strictly host specific Venturia species. On A. pseudoplatanus, a hitherto undescribed Venturia species was identified. Due to its dominance on F. excelsior, V. fraxini is unlikely to go extinct in case of reduced host densities. A majority of species was not strictly host specific and is therefore likely less affected by ash dieback in the future. Still, shifts in community structure and loss of genetic diversity cannot be excluded. The potentially endangered endophyte Hymenoscyphus albidus was rarely found. In addition to host specificity, species with preferences for leaf laminae or petioles were found. We also detected considerable geographical variation between sampling sites and clear differences between the two sides of the Alps for endophytes of F. excelsior, but not A. pseudoplatanus. Since sycamore maple is not affected by an epidemic, this could point toward an influence of ash dieback on ash communities, although firm conclusions are not possible because of host preferences and climatic differences. Furthermore, the mycobiota of F. excelsior trees with or without dieback symptoms were compared, but no clear differences were detected. Besides methodical refinement, our study provides comprehensive data on the ash mycobiome that we expect to be subject to changes caused by an emerging disease of the host tree.

Keywords: ash dieback; cryptic extinction; emerging disease; endophytic fungi; fungal-specific primers; invasive pathogen; mock community.


Figures

FIGURE 1
FIGURE 1
Map of sampling sites (left) and overview of variables examined in this study (right). The names and site numbers in the map are shown according to Supplementary Table S1 in Data Sheet 1 (filled circles). The empty circles with a gray font denote the locations of planted F. ornus trees north of the Alps sampled by Ibrahim et al. (2017). They were collectively assigned to number 9. The thick gray line illustrates the rough course of the main chain of the Alps.
FIGURE 2
FIGURE 2
Validation of the new fungal-specific primers ITS4f/ITS4f2. (A) Overview of the taxonomic coverage of the two primers in comparison with ITS4 (White et al., 1990), determined using LSU sequences from GenBank. The bars indicate the number of species (GenBank classification) in thousands (k) and are colored according to the median number of primer mismatches per species. (B) OTU diversity in the pond sediment test sample, determined by NGS amplicon sequencing. The number of OTUs amplified by different reverse primers is shown for different taxonomic groups. The leftmost bars of each panel indicate the total OTU diversity retrieved by any of the primers (selected to be present in ≥3 samples with ≥10 normalized reads). For individual primer combinations, OTUs from this pool were considered ‘present’ if represented by ≥5 reads (±SEM from three replicates). The bars are colored according to the sequence variant found at the 3′ end of the ITS4f/ITS4f2 annealing site. Some OTUs did not have enough reads to unambiguously determine the sequence variant (‘uncertain’). (C) Expected vs. observed read numbers for each species in the uneven mock communities, amplified with the primers ITS3-KYO2 and ITS4f. The expected frequencies are corrected by qPCR quantification of rDNA content. The vertical error bars denote the SEM of three replicates, which were mixed and amplified independently.
FIGURE 3
FIGURE 3
Variability of the Shannon alpha diversity measure, summarized per sampling site for all host species and both leaf parts (green, laminae; orange, petioles). The overlaid points represent individual tree samples. The sites are grouped into the north (N) and south (S) side of the Alps. “Site” 9 collectively refers to all planted trees sampled on the north side of the Alps.
FIGURE 4
FIGURE 4
Relative abundances of the most frequently encountered fungal taxonomic groups, summarized at the order level. If >75% of all reads in an order belonged to a specific genus, then this genus was used as group instead and the remaining OTUs were classified as “Other.” The frequencies are shown for each host species and leaf part (vertical panels) for different sampling sites (1–9) and health status (h, healthy; d, diseased).
FIGURE 5
FIGURE 5
Overview of morphotype abundances. (A) Mean isolation frequencies of the most abundant morphotypes on F. excelsior and A. pseudoplatanus from lamina (L) and petioles (P) per sampling site (number 1–8). Frequencies above one indicate that more than one fungus emerged from one lamina/petiole piece on average. (B) Mean abundances of the most frequent taxa obtained by the culturing method or NGS sequencing. OTUs were considered belonging to a cultured morphotype if they had at least 97% similarity to a sequenced isolate from that morphotype. Additionally, the two most abundant OTUs not found by culture are shown. The morphotype codes are written in brackets. Potentially misassigned sequences (crosstalk) were removed from the NGS dataset. In order to be comparable with the NGS read counts, the mean relative isolation frequencies from all samples (laminae + petioles) scaled to the average read depth of the scaled NGS samples (20,000). Error bars represent the standard error of the mean (SEM). For isolates from F. ornus, data from Ibrahim et al. (2017) are shown.
FIGURE 6
FIGURE 6
Unconstrained ordination using principle component analysis (PCA) of CLR-transformed OTU counts. The percentages explained by each axis are shown in square brackets. H. fraxineus was excluded from this analysis. (A) Ordination including all samples, colored according to the host species. Filled circles indicate lamina (L) and open circles petiole samples (P). Combinations of the first three axes (PC1-3) are shown. (B) Ordination done separately for each host species and leaf part (PC1 and 2 shown). Tree communities north of the Alps are outlined with a blue elliptic background and samples from the south have a yellow background (confidence level: 0.9).
FIGURE 7
FIGURE 7
Overview of species for which significant differences between the host species (Ap, A. pseudoplatanus; Fe, F. excelsior; Fo, F. ornus), leaf parts (L, laminae; P, petioles) and/or between the north (N) and south (S) side of the Alps exist. The dots are colored according to the host species, and their size varies depending on the mean read abundances (average of sampling site averages). Potential artifacts (crosstalk) were removed before computing the averages. Filled circles indicate a significant difference for the given factor while empty circles indicate non-significant differences. Note that for the region (north/south), the significance was determined from un-adjusted p-values due to reasons described in the text. The OTU numbers are shown in gray together with the code of the cultured isolate (Supplementary Data Sheet 2) if present (and % deviation of OTU from isolate sequence). For more details see also Supplementary Figures S13–S18.
FIGURE 8
FIGURE 8
Host specificity of dominant leaf endophyte groups. Phylogenetic trees of Venturia spp. and Mycosphaerellaceae OTUs (numbers in brackets) and published sequences are shown along pie charts illustrating the abundance distribution of NGS reads between different host species. The OTU occurrence is shown for each sampling site on both sides of the Alps, scaled according to the average number of normalized reads. The host species that were actually sampled at these locations are indicated below with colored bars. The gray pie charts indicate the abundance distribution between laminae and petioles, averaged over all samples. The numbers on the pie charts indicate the number of Venturia isolates from Ibrahim et al. (2016). The isolate codes (Supplementary Data Sheet 2) are shown in gray (with % deviation of OTU from isolate sequence). OTUs from two new Venturia species on A. pseudoplatanus are highlighted by a yellow background. V. fraxini OTUs 1 and 2 matched the same isolate sequences because their sequences differed only near the 3′ end, which did not overlap with the isolate sequences. The trees include ML bootstrap percentages next to branches. The scale bars represent the number of substitutions per site.
FIGURE 9
FIGURE 9
Detection of the ash dieback pathogen H. fraxineus and the closely related native H. albidus in European-ash leaves by NGS sequencing. (A) Distribution of H. fraxineus and H. albidus across the different sampling sites. Scaled and log transformed read counts are shown as boxplots overlaid with individual sample points. Potentially misassigned rare H. fraxineus sequences (crosstalk) were removed. (B) Amount of H. fraxineus reads in lamina and petiole samples depending on the tree health. Only sampling sites where the pathogen was present are included. In addition, the p-values (Wald Chi-square test) of a linear mixed model for the effect of leaf part and tree health are shown. Three stars (∗∗∗) indicate a significant effect. (C) H. fraxineus content in laminae vs. petioles. The regression line is shown along with the adjusted R-squared and p-value of the linear model. ∗∗∗Significant effect.

Similar articles

Cited by

References

    1. Abegg M., Brändli U. B., Cioldi F., Fischer C., Herold-Bonardi A., Huber M., et al. (2014). Viertes Schweizerisches Landesforstinventar–Ergebnistabellen und Karten im Internet zum LFI 2009-2013 (LFI4b). Available at: http://www.lfi.ch/resultate/
    1. Bakys R., Vasaitis R., Barklund P., Ihrmark K., Stenlid J. (2009a). Investigations concerning the role of Chalara fraxinea in declining Fraxinus excelsior. Plant Pathol. 58 284–292. 10.1111/j.1365-3059.2008.01977.x - DOI
    1. Bakys R., Vasaitis R., Barklund P., Thomsen I. M., Stenlid J. (2009b). Occurrence and pathogenicity of fungi in necrotic and non-symptomatic shoots of declining common ash (Fraxinus excelsior) in Sweden. Eur. J. For. Res. 128 51–60. 10.1007/s10342-008-0238-2 - DOI
    1. Baral H.-O., Bemmann M. (2014). Hymenoscyphus fraxineus vs. Hymenoscyphus albidus – a comparative light microscopic study on the causal agent of European ash dieback and related foliicolous, stroma-forming species. Mycology 5 228–290. 10.1080/21501203.2014.963720 - DOI - PMC - PubMed
    1. Baral H.-O., Queloz V., Hosoya T. (2014). Hymenoscyphus fraxineus, the correct scientific name for the fungus causing ash dieback in Europe. IMA Fungus 5 79–80. 10.5598/imafungus.2014.05.01.09 - DOI - PMC - PubMed