

Dietary Exposure to the Environmental Chemical, PFOS on the Diversity of Gut Microbiota, Associated With the Development of Metabolic Syndrome
- PMID: 30405595
- PMCID: PMC6207688
- DOI: 10.3389/fmicb.2018.02552
Dietary Exposure to the Environmental Chemical, PFOS on the Diversity of Gut Microbiota, Associated With the Development of Metabolic Syndrome
Abstract
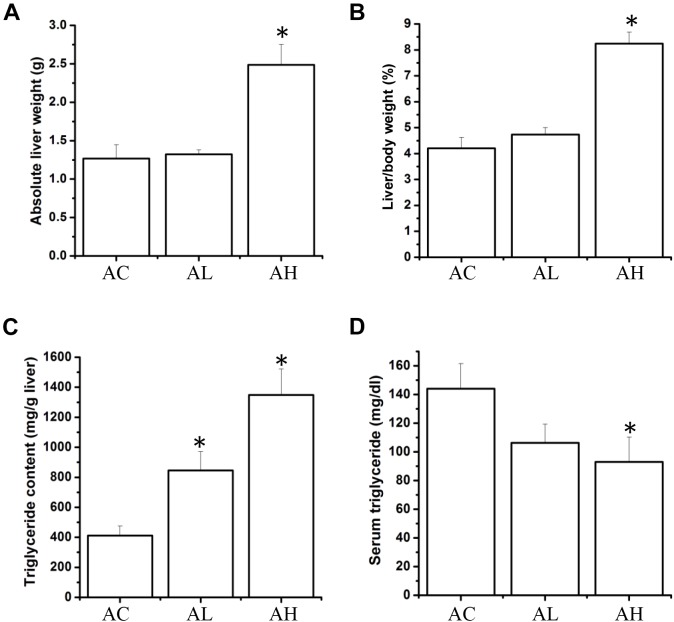
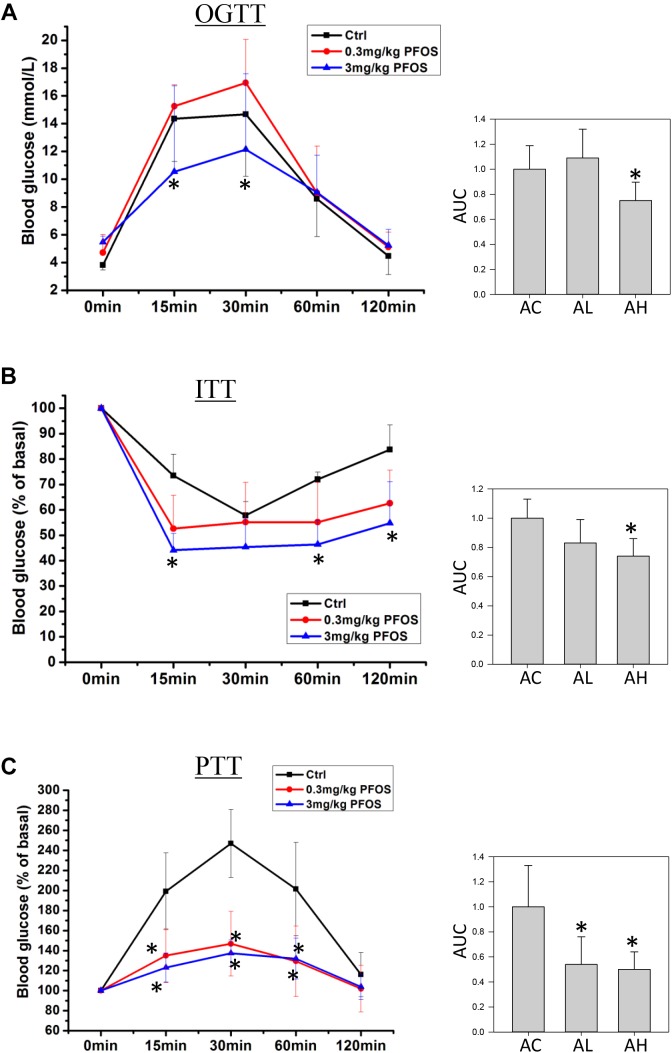
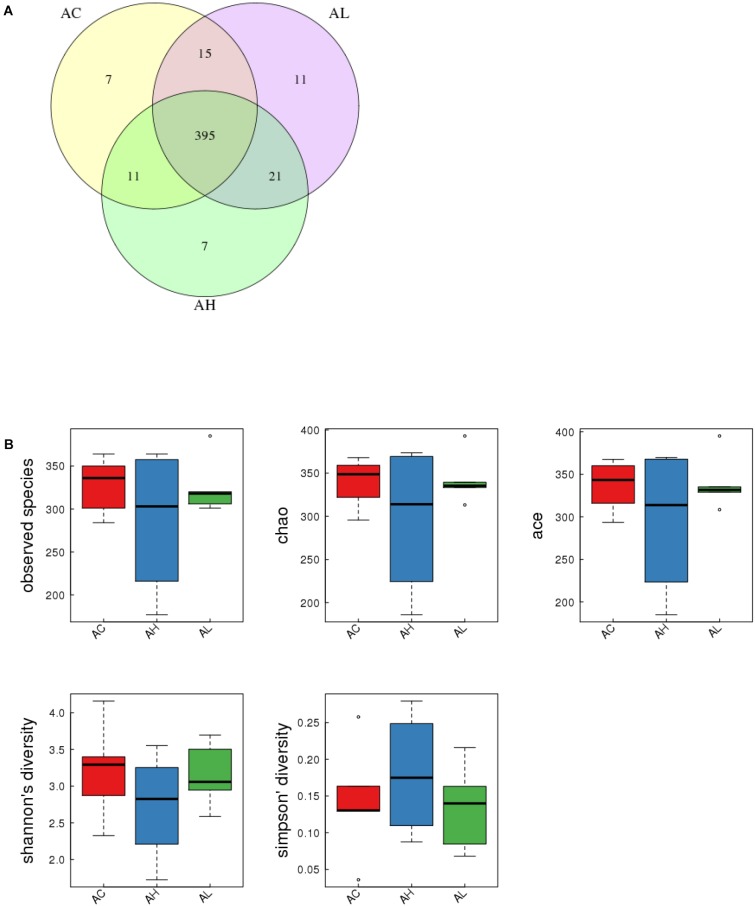
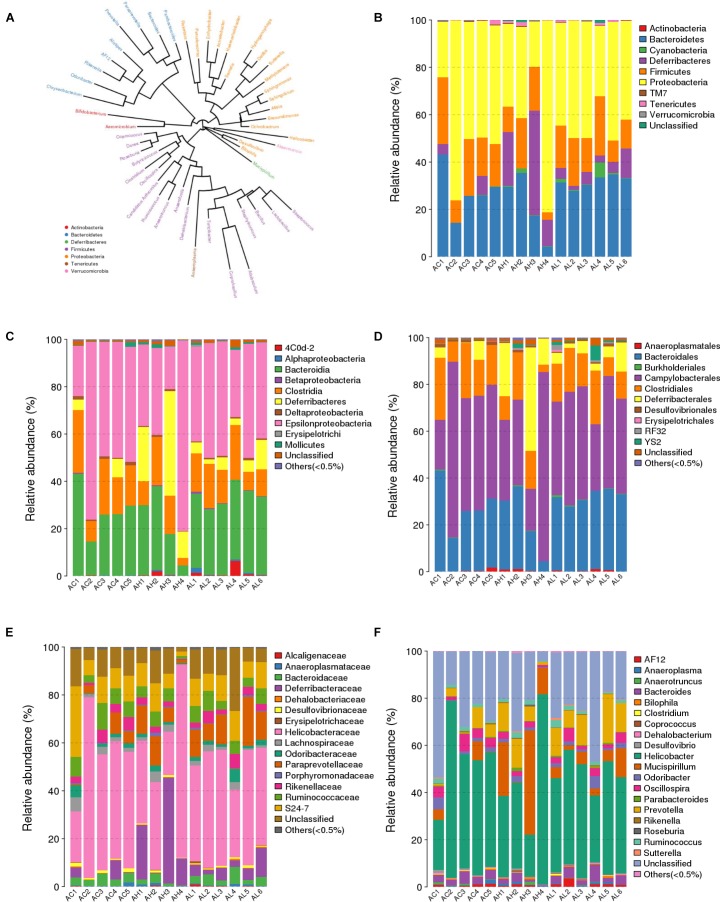
The gut microbiome is a dynamic ecosystem formed by thousands of diverse bacterial species. This bacterial diversity is acquired early in life and shaped over time by a combination of multiple factors, including dietary exposure to distinct nutrients and xenobiotics. Alterations of the gut microbiota composition and associated metabolic activities in the gut are linked to various immune and metabolic diseases. The microbiota could potentially interact with xenobiotics in the gut environment as a result of their board enzymatic capacities and thereby affect the bioavailability and toxicity of the xenobiotics in enterohepatic circulation. Consequently, microbiome-xenobiotic interactions might affect host health. Here, we aimed to investigate the effects of dietary perfluorooctane sulfonic acid (PFOS) exposure on gut microbiota in adult mice and examine the induced changes in animal metabolic functions. In mice exposed to dietary PFOS for 7 weeks, body PFOS and lipid contents were measured, and to elucidate the effects of PFOS exposure, the metabolic functions of the animals were assessed using oral glucose-tolerance test and intraperitoneal insulin-tolerance and pyruvate-tolerance tests; moreover, on Day 50, cecal bacterial DNA was isolated and subject to 16S rDNA sequencing. Our results demonstrated that PFOS exposure caused metabolic disturbances in the animals, particularly in lipid and glucose metabolism, but did not substantially affect the diversity of gut bacterial species. However, marked modulations were detected in the abundance of metabolism-associated bacteria belonging to the phyla Firmicutes, Bacteroidetes, Proteobacteria, and Cyanobacteria, including, at different taxonomic levels, Turicibacteraceae, Turicibacterales, Turicibacter, Dehalobacteriaceae, Dehalobacterium, Allobaculum, Bacteroides acidifaciens, Alphaproteobacteria, and 4Cod-2/YS2. The results of PICRUSt analysis further indicated that PFOS exposure perturbed gut metabolism, inducing notable changes in the metabolism of amino acids (arginine, proline, lysine), methane, and a short-chain fatty acid (butanoate), all of which are metabolites widely recognized to be associated with inflammation and metabolic functions. Collectively, our study findings provide key information regarding the biological relevance of microbiome-xenobiotic interactions associated with the ecology of gut microbiota and animal energy metabolism.
Keywords: PFOs; bacterial diversity; energy metabolism; gut microbiome; microbiome-xenobiotic interaction.
Figures
Similar articles
-
Perfluorooctane sulfonate alters gut microbiota-host metabolic homeostasis in mice.Toxicology. 2020 Feb 15;431:152365. doi: 10.1016/j.tox.2020.152365. Epub 2020 Jan 8. Toxicology. 2020. PMID: 31926186 Free PMC article.
-
Intestinal environmental disorders associate with the tissue damages induced by perfluorooctane sulfonate exposure.Ecotoxicol Environ Saf. 2020 Jul 1;197:110590. doi: 10.1016/j.ecoenv.2020.110590. Epub 2020 Apr 10. Ecotoxicol Environ Saf. 2020. PMID: 32283409
-
Antibiotic induced restructuring of the gut microbiota does not affect oral uptake and accumulation of perfluorooctane sulfonic acid (PFOS) in rats.Environ Pollut. 2023 Oct 1;334:122179. doi: 10.1016/j.envpol.2023.122179. Epub 2023 Jul 14. Environ Pollut. 2023. PMID: 37454717
-
Structural diversity, functional aspects and future therapeutic applications of human gut microbiome.Arch Microbiol. 2021 Nov;203(9):5281-5308. doi: 10.1007/s00203-021-02516-y. Epub 2021 Aug 17. Arch Microbiol. 2021. PMID: 34405262 Free PMC article. Review.
-
Studies of xenobiotic-induced gut microbiota dysbiosis: from correlation to mechanisms.Gut Microbes. 2021 Jan-Dec;13(1):1921912. doi: 10.1080/19490976.2021.1921912. Gut Microbes. 2021. PMID: 34313531 Free PMC article. Review.
Cited by
-
Perfluorooctanesulfonic Acid-Induced Toxicity on Zebrafish Embryos in the Presence or Absence of the Chorion.Environ Toxicol Chem. 2021 Mar;40(3):780-791. doi: 10.1002/etc.4899. Epub 2020 Dec 14. Environ Toxicol Chem. 2021. PMID: 33044770 Free PMC article.
-
Risk to human health related to the presence of perfluoroalkyl substances in food.EFSA J. 2020 Sep 17;18(9):e06223. doi: 10.2903/j.efsa.2020.6223. eCollection 2020 Sep. EFSA J. 2020. PMID: 32994824 Free PMC article.
-
The Microbiome and the Gut-Liver-Brain Axis for Central Nervous System Clinical Pharmacology: Challenges in Specifying and Integrating In Vitro and In Silico Models.Clin Pharmacol Ther. 2020 Nov;108(5):929-948. doi: 10.1002/cpt.1870. Epub 2020 May 29. Clin Pharmacol Ther. 2020. PMID: 32347548 Free PMC article. Review.
-
Invited Perspective: PFOS-Pick Fiber, Oust Sulfonate.Environ Health Perspect. 2022 Nov;130(11):111301. doi: 10.1289/EHP12012. Epub 2022 Nov 4. Environ Health Perspect. 2022. PMID: 36331817 Free PMC article. No abstract available.
-
The effects of per- and polyfluoroalkyl substances on environmental and human microorganisms and their potential for bioremediation.Arh Hig Rada Toksikol. 2023 Sep 30;74(3):167-178. doi: 10.2478/aiht-2023-74-3708. eCollection 2023 Sep 1. Arh Hig Rada Toksikol. 2023. PMID: 37791672 Free PMC article. Review.
References
-
- Antinozzi P. A., Segall L., Prentki M., McGarry J. D., Newgard C. B. (1998). Molecular or pharmacologic perturbation of the link between glucose and lipid metabolism is without effect on glucose-stimulated insulin secretion. A re-evaluation of the long-chain acyl-CoA hypothesis. J. Biol. Chem. 273 16146–16154. 10.1074/jbc.273.26.16146 - DOI - PubMed
-
- Blasco-Baque V., Coupe B., Fabre A., Handgraaf S., Gourdy P., Arnal J. F., et al. (2017). Associations between hepatic miRNA expression, liver triacylglycerols and gut microbiota during metabolic adaptation to high-fat diet in mice. Diabetologia 60 690–700. 10.1007/s00125-017-4209-3 - DOI - PMC - PubMed
LinkOut - more resources
Full Text Sources