Review
. 2018 Oct 24:9:2237.
doi: 10.3389/fimmu.2018.02237. eCollection 2018.

Interpretation of Serological Complement Biomarkers in Disease

Affiliations
Review

Interpretation of Serological Complement Biomarkers in Disease

Kristina N Ekdahl et al. Front Immunol. .

Abstract

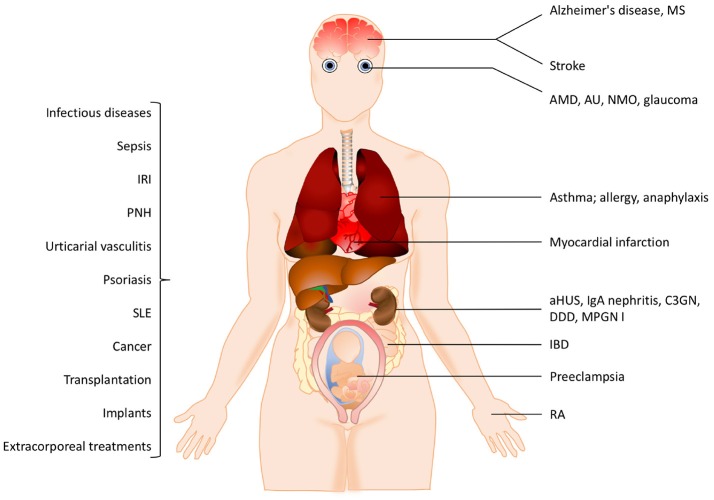
Complement system aberrations have been identified as pathophysiological mechanisms in a number of diseases and pathological conditions either directly or indirectly. Examples of such conditions include infections, inflammation, autoimmune disease, as well as allogeneic and xenogenic transplantation. Both prospective and retrospective studies have demonstrated significant complement-related differences between patient groups and controls. However, due to the low degree of specificity and sensitivity of some of the assays used, it is not always possible to make predictions regarding the complement status of individual patients. Today, there are three main indications for determination of a patient's complement status: (1) complement deficiencies (acquired or inherited); (2) disorders with aberrant complement activation; and (3) C1 inhibitor deficiencies (acquired or inherited). An additional indication is to monitor patients on complement-regulating drugs, an indication which may be expected to increase in the near future since there is now a number of such drugs either under development, already in clinical trials or in clinical use. Available techniques to study complement include quantification of: (1) individual components; (2) activation products, (3) function, and (4) autoantibodies to complement proteins. In this review, we summarize the appropriate indications, techniques, and interpretations of basic serological complement analyses, exemplified by a number of clinical disorders.

Keywords: activation products; complement; complement regulatory drugs; deficiency; functional test.


Figures

Figure 1
Figure 1
Overview of the complement system. (A) Activation and regulation of the complement system. The complement system can be activated by three different pathways: the classical (CP), lectin (LP), and alternative pathways (AP). Recognition molecules within the three pathways bind to structures present on pathogens, and then activate the serine proteases C1r and C1s of the CP and MASP-1, MASP-2 of the LP, respectively. These proteases initiate the assembly of the CP/LP C3 convertase (C4bC2a) while formation of the AP C3 convertase (C3bBbP) is initiated either by hydrolysis of C3 to C3(H2O) or by other mechanisms. The convertases cleave C3 to the opsonin C3b and the anaphylatoxin C3a. Subsequent action of the C5 convertases generates the anaphylatoxin C5a and initiates the assembly of the C5b-9 complex. Complement activation is under strict control of a number of membrane-bound and fluid phase inhibitors, the majority of which control the activity of the convertases. These include (but are not restricted to) C4b-binding protein (C4BP), decay acceleration factor (DAF), membrane cofactor protein (MCP), and complement receptor 1 (CR1), factor H (FH), and factor I (FI). In addition, formation of the C5b-9 complex is under control of CD59 and clusterin, while the CP and LP serine proteases are inhibited by C1- inhibitor (C1-INH). Color coding: recognition molecules: gray triangles; initiators serine proteases and C3(H2O): orange symbols; convertases: green ovals; inhibitors: bright yellow ovals; anaphylatoxins: dim yellow triangles. (B) Selected analytes commonly used clinically to assess complement function and activation. C1q, C1-INH, C4, C3 factor B (B) and their activation fragments, as well as C5a and sC5b-9.
Figure 2
Figure 2
Examples of pathological conditions involving the complement system. The pathogenesis of many inflammatory diseases includes excessive or uncontrolled complement activation. Some of these pathological conditions are organ-specific while others are systemic. In addition, different treatment modalities such as transplantation, implants or extracorporeal treatments also trigger complement activation. See the text for details. IRI, ischemia reperfusion injury, PNH, paroxysmal nocturnal hemoglobinuria; SLE, systemic lupus erythematosus; MS, multiple sclerosis, AMD, age-related macular degeneration; AU, autoimmune uveitis; NMO, neuromyelitis optica; aHUS, atypical haemolytic uremic syndrome; C3GN, C3 glomerulonephritis; DDD, dense deposit disease; MPGN, membranoproliferative glomerulonephritis; IBD, irritable bowel disease; RA, rheumatoid arthritis.
Figure 3
Figure 3
Activation and consumption of complement in vivo and in vitro. Activation of C3 yields the activation products C3a, C3b/iC3b, C3d,g, and C3c (indicated by arrows). In vivo, a portion of the C3 fragments get eliminated by complement receptor-bearing cells (A). The complement system can also be activated in vitro in serum (D) or in maltreated samples (B), but in these cases the activation products remain in the fluid phase. In order to avoid complement activation in vitro, blood can be drawn in the presence of EDTA which inhibits all further activation is (C). In each panel, the degree of C3 cleavage is indicated by the length of the arrows.
Figure 4
Figure 4
Haemolytic assay for detection of complement classical pathway (CP) function. (A) CP haemolytic assay. Sheep erythrocytes coated with IgM antibodies are incubated with patient serum. The C1 complex binds and initiates formation of the CP convertase, leading to activation of C3, assembly of the C5b-9 complex, and subsequent erythrocyte lysis. (B) CH50 assay. Titration of the amount of serum needed to lyse 50% of a specified limited and fixed quantity of cells in the CH50 assay. The curves show three individuals with different levels of complement function. (C) One tube CP assay. Since the activity of complement is proportional to the quantity of cells that are lysed, this assay is performed in an excess of erythrocytes. The curves show three individuals with different levels of complement function. Assays for alternative pathway (AP) activation function similarly except that uncoated rabbit or guinea pig erythrocytes which spontaneously activate the AP, are used.
Figure 5
Figure 5
Examples of specialized functional assays. (A) Time course alternative pathway (AP) haemolysis test. The left curve was obtained using serum form a complement sufficient individual and the right curve using serum form a properdin deficient patient. Since the curves merge at the same level after 20 min in the one tube assay it is necessary to also incubate for shorter time to locate this deficiency. (B) Correlation between functional test and individual analytes. Combination of haemolytic function via the classical pathway (CP) and an individual analyte (C1q) show a correlation in this material of systemic lupus erythematosus (SLE) patients. The exception, marked with (*) is a patient with total C2 deficiency. (B) reproduced from (15) with permission from the publisher.
Figure 6
Figure 6
Mechanism of action of microtitre plate based complement activation assays. Schematic representation of the mechanisms for commercially available enzyme immune assays (EIA) to monitor complement activation via the three different pathways. Wells of microtiter plates are coated with ligands for the recognition molecules within each pathway. For each assay, serum supplemented with inhibitors for the other two pathways is incubated. After complement activation, the readout for all assays is formation of the terminal complement complex C5b-9.
Figure 7
Figure 7
Complement activation during an SLE (systemic lupus erythematosus) excacerbation. Clinically, the magnitude of an excacerbation of (SLE) is quantified as SLE disease index (SLEDAI; black line). During excacerbation, intact complement components C3, C4, factor B (FB), and other components are consumed, which results in a decline in haemolytic function by the classical pathway (CP) (red line). Complement activation markers e.g., C3d,g, C3a, and sC5b-9 (orange line), peak concomitantly with the SLEDAI. Figure adapted from (13).

Similar articles

Cited by

References

    1. Kemper C, Hourcade DE. Properdin: New roles in pattern recognition and target clearance. Mol Immunol. (2008) 45:4048–56. 10.1016/j.molimm.2008.06.034 - DOI - PMC - PubMed
    1. Nguyen HX, Galvan MD, Anderson AJ. Characterization of early and terminal complement proteins associated with polymorphonuclear leukocytes in vitro and in vivo after spinal cord injury. J Neuroinflammation (2008) 5:26. 10.1186/1742-2094-5-26 - DOI - PMC - PubMed
    1. Triantafilou K, Hughes TR, Triantafilou M, Morgan BP. The complement membrane attack complex triggers intracellular Ca2+ fluxes leading to NLRP3 inflammasome activation. J Cell Sci. (2013) 126:2903–13. 10.1242/jcs.124388 - DOI - PubMed
    1. Carroll MV, Sim RB. Complement in health and disease. Adv Drug Delivery Rev. (2011) 63:965–75. 10.1016/j.addr.2011.06.005 - DOI - PubMed
    1. Liszewski MK, Java A, Schramm EC, Atkinson JP. Complement dysregulation and disease: insights from contemporary genetics. Annu Rev Pathol Mech Dis. (2017) 12:25–52. 10.1146/annurev-pathol-012615-044145 - DOI - PMC - PubMed

Publication types

MeSH terms

LinkOut - more resources