. 2018 Oct 11:2018:3149495.
doi: 10.1155/2018/3149495. eCollection 2018.

Development of Regional Disparities in Alzheimer's Disease Mortality in the Slovak Republic from 1996 to 2015

Affiliations

Development of Regional Disparities in Alzheimer's Disease Mortality in the Slovak Republic from 1996 to 2015

Beáta Gavurová et al. Int J Alzheimers Dis. .

Abstract

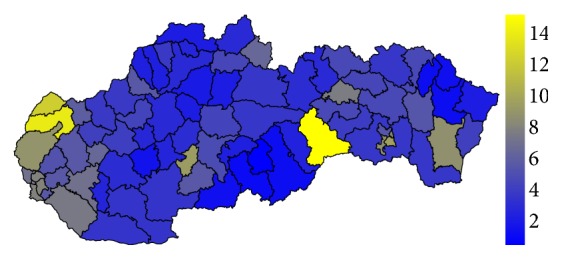
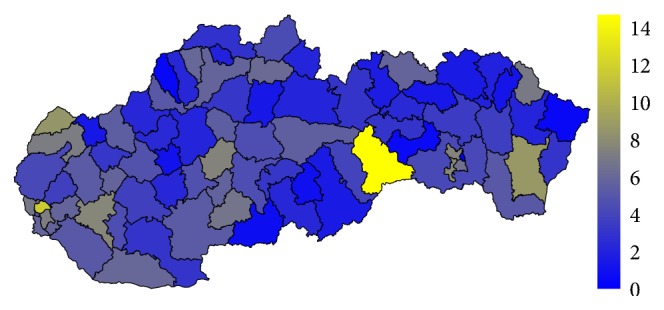
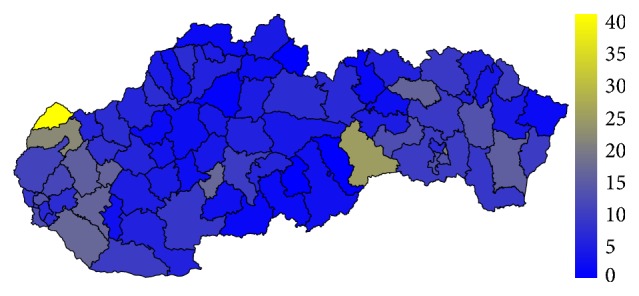
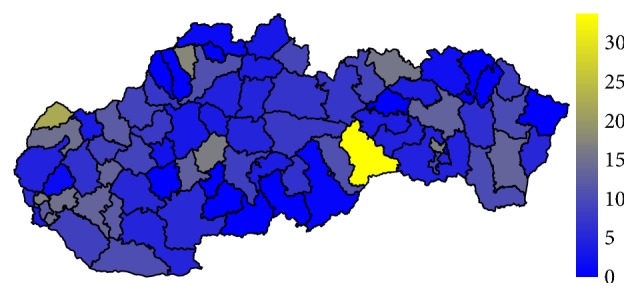
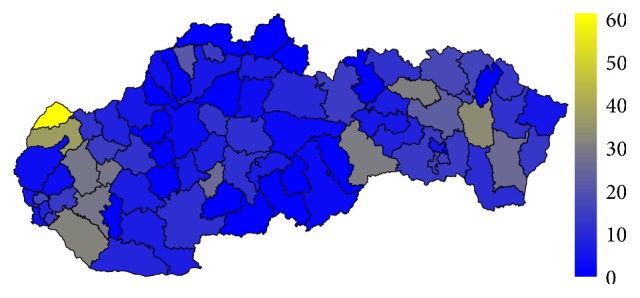
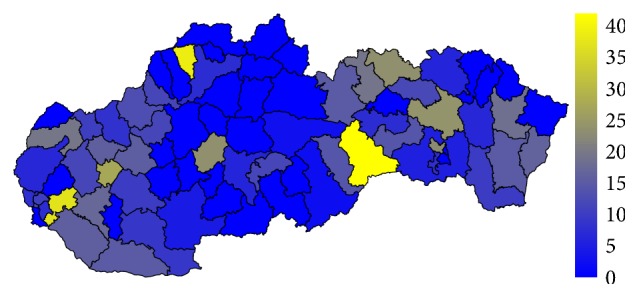
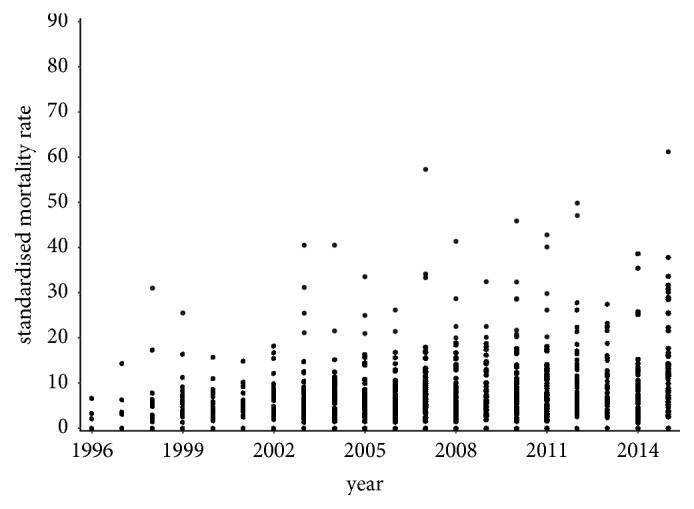
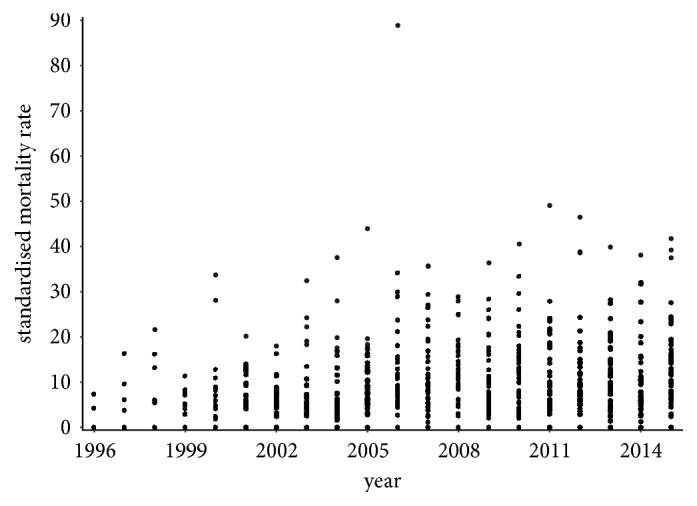
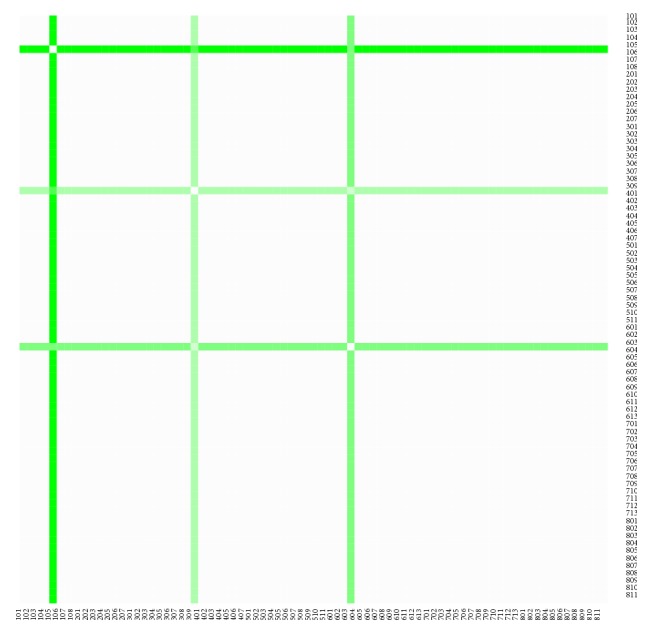
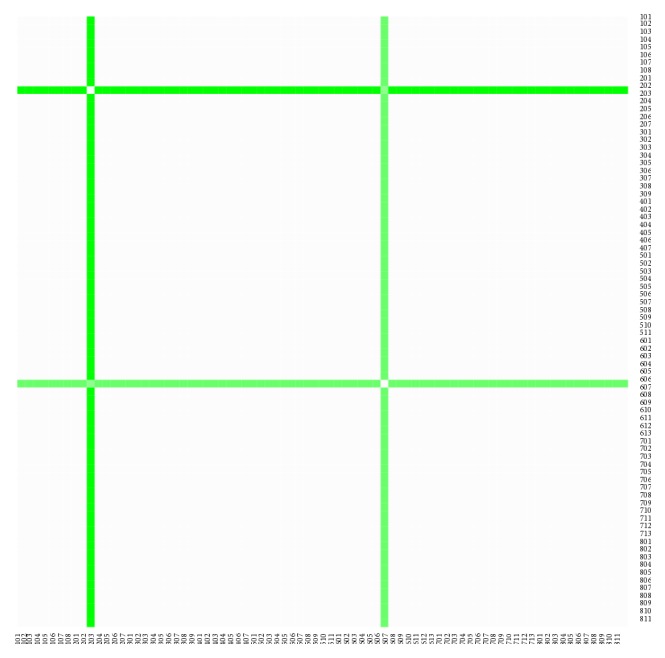
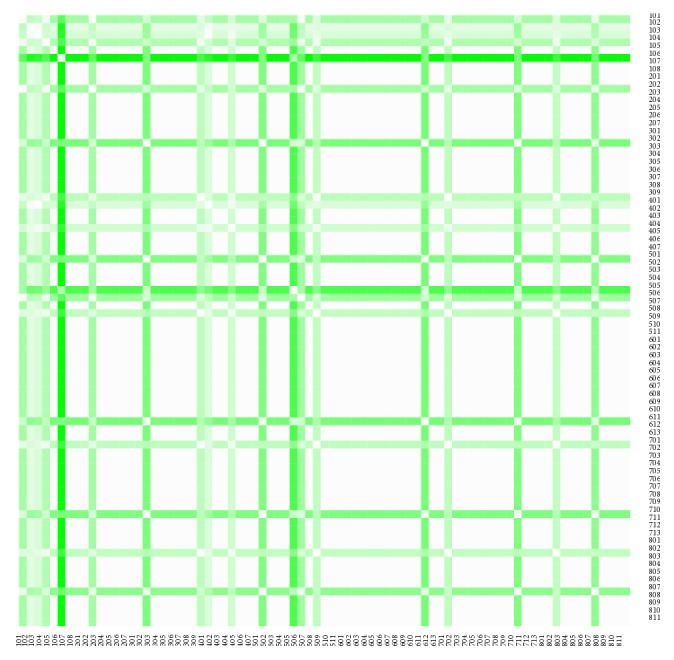
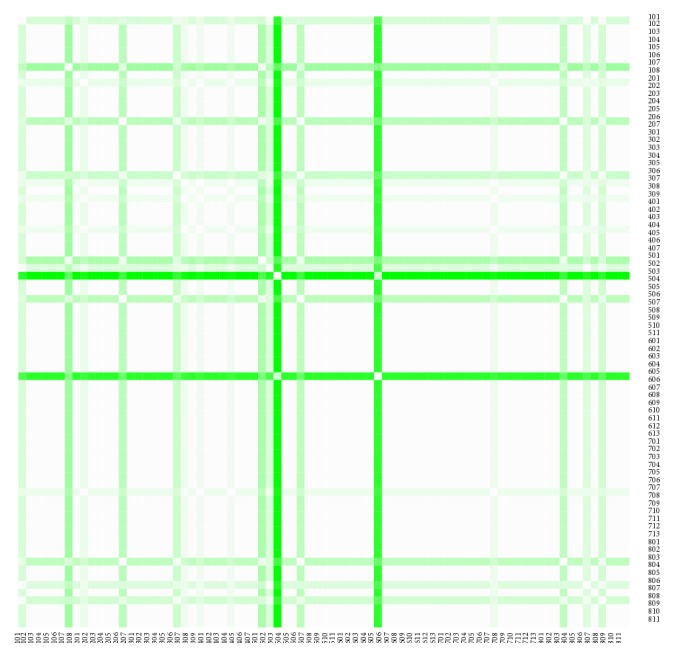
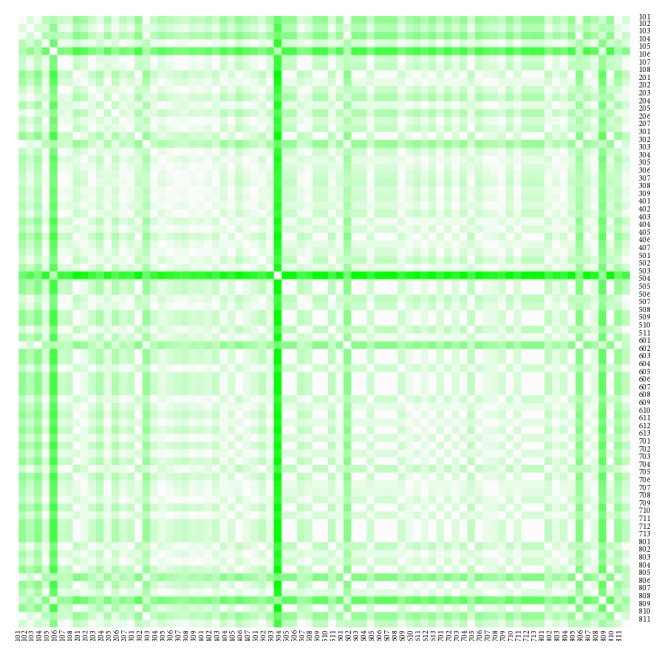
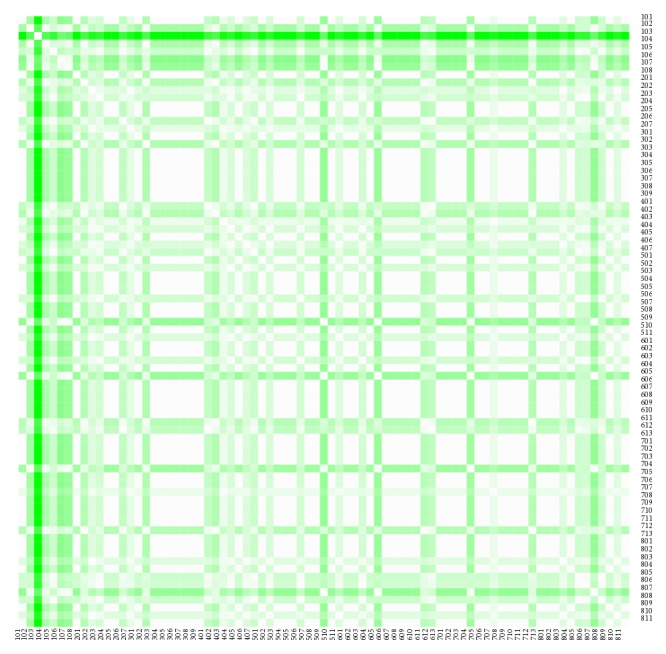
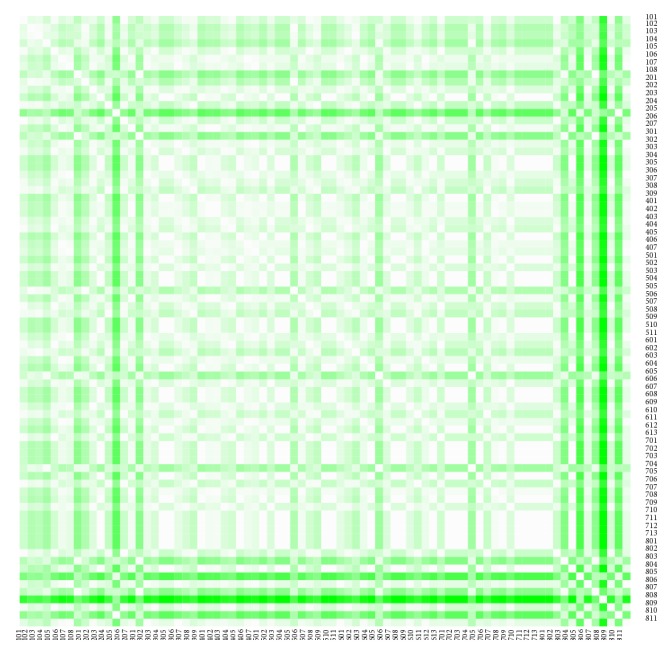
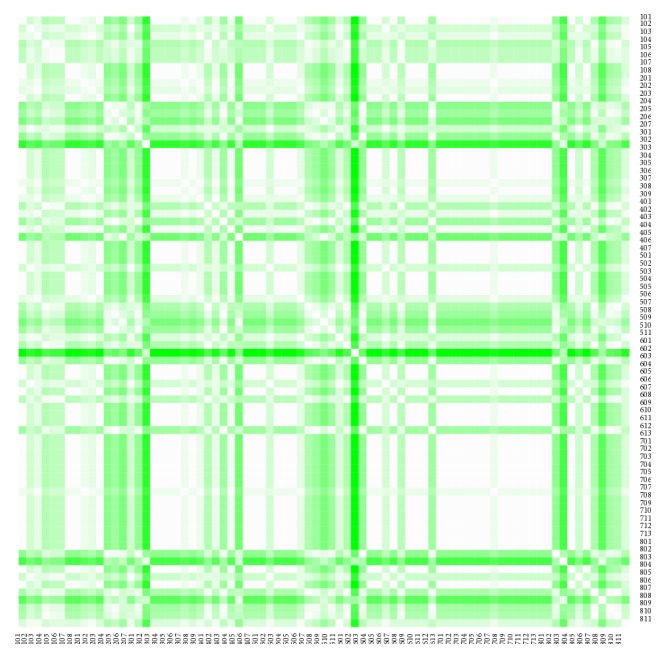
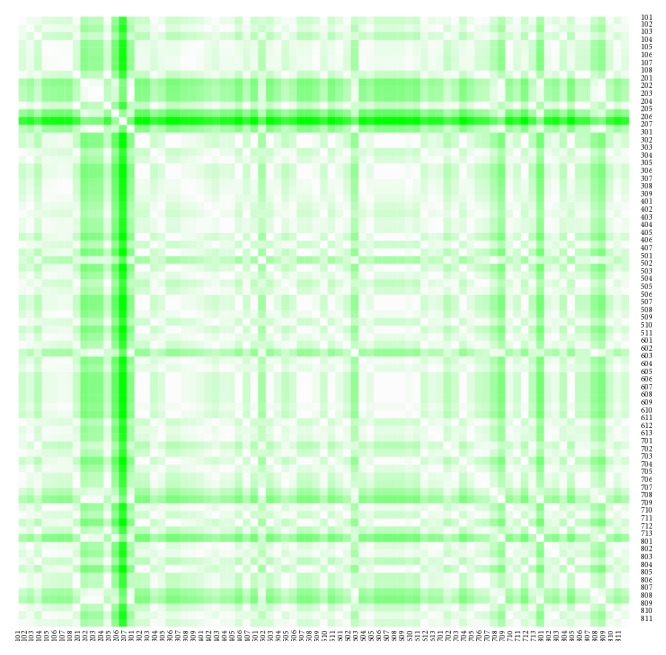
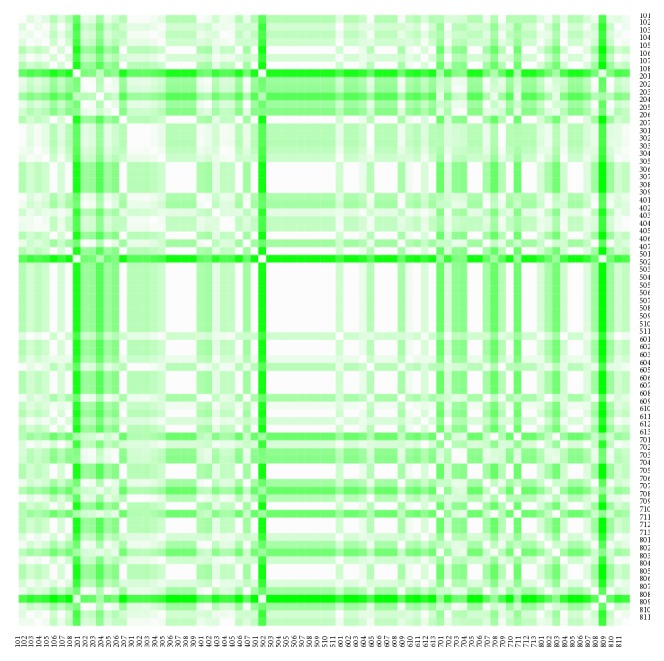
Alzheimer's disease-subsequently as AD in the text-represents a chronic neurodegenerative disease discussed very often in the recent period. It involves the G30 diagnosis expressing exactly AD and also the F00 diagnosis epitomising dementia in AD. The Slovak Republic has a very various population in terms of the disparities of the population localisation. The analysis is executed on the basement of the standardised mortality rate. It is calculated for the individual districts of the Slovak Republic to get a detailed spatial view and for each year of the explored period from 1996 to 2015 to get a time development. It has a considerably rising tendency. Therefore, the regional disparities of the standardised mortality rate of AD are analysed from an angle of view of its similarity, by its measurement in a form of a Euclidean distance approach. The results of the analysis offer the heat maps as the distance matrices in a graphic form and the maps of the individual districts too. These outputs reveal a very heterogeneous structure of the standardised mortality rate. Another graphic outcome demonstrates a distribution of its values among the districts throughout the whole Slovak Republic for the whole observed period. The results offer a comparison among the districts of the Slovak Republic too. The highest values and also the lowest values are reached in the different districts for the both sexes. Even, one district reaches the opposite result for the individual sexes. The age structure of the deceased population on the G30 diagnosis is also executed and the extreme values from an angle of a view of the districts are picked up. There are evident high differentiations between the individual districts of the Slovak Republic. The conclusion section involves the several key points and the potential suggestions for further research.


Figures

Figure 1
Figure 1
The average annual standardised mortality rate of the female sex in the individual districts of the Slovak Republic for the whole period.
Figure 2
Figure 2
The average annual standardised mortality rate of the male sex in the individual districts of the Slovak Republic for the whole period.
Figure 3
Figure 3
The average annual standardised mortality rate of the female sex in the individual districts of the Slovak Republic for the period from 2013 to 2015.
Figure 4
Figure 4
The average annual standardised mortality rate of the male sex in the individual districts of the Slovak Republic for the period from 2013 to 2015.
Figure 5
Figure 5
The standardised mortality rate of the female sex in the individual districts of the Slovak Republic in 2015.
Figure 6
Figure 6
The standardised mortality rate of the male sex in the individual districts of the Slovak Republic in 2015.
Figure 7
Figure 7
The standardised mortality rate of the individual districts of the Slovak Republic for the female sex throughout the whole period.
Figure 8
Figure 8
The standardised mortality rate of the individual districts of the Slovak Republic for the male sex throughout the whole period.
Figure 9
Figure 9
The distance matrix of the similarity of the districts for the female sex in 1996.
Figure 10
Figure 10
The distance matrix of the similarity of the districts for the male sex in 1996.
Figure 11
Figure 11
The distance matrix of the similarity of the districts for the female sex in 2000.
Figure 12
Figure 12
The distance matrix of the similarity of the districts for the male sex in 2000.
Figure 13
Figure 13
The distance matrix of the similarity of the districts for the female sex in 2005.
Figure 14
Figure 14
The distance matrix of the similarity of the districts for the male sex in 2005.
Figure 15
Figure 15
The distance matrix of the similarity of the districts for the female sex in 2010.
Figure 16
Figure 16
The distance matrix of the similarity of the districts for the male sex in 2010.
Figure 17
Figure 17
The distance matrix of the similarity of the districts for the female sex in 2015.
Figure 18
Figure 18
The distance matrix of the similarity of the districts for the male sex in 2015.

Similar articles

Cited by

References

    1. Alzheimer’s Association. Alzheimer’s disease facts and figures. Alzheimer's & Dementia. 2017;13(4):325–373. https://www.sciencedirect.com/science/article/pii/S1552526017300511.
    1. Sindi S., Mangialasche F., Kivipelto M. Advances in the prevention of Alzheimer's disease. F1000Prime Reports. 2015;7 - PMC - PubMed
    1. Raggi A., Tasca D., Panerai S., Neri W., Ferri R. The burden of distress and related coping processes in family caregivers of patients with Alzheimer's disease living in the community. Journal of the Neurological Sciences. 2015;358(1-2):77–81. doi: 10.1016/j.jns.2015.08.024. - DOI - PubMed
    1. Chiatti C., Furneri G., Rimland J. M., et al. The economic impact of moderate stage Alzheimer's disease in Italy: evidence from the UP-TECH randomized trial. International Psychogeriatrics. 2015;27(9):1563–1572. doi: 10.1017/s104161021500040x. - DOI - PubMed
    1. Nicolia V., Lucarelli M., Fuso A. Environment, epigenetics and neurodegeneration: focus on nutrition in Alzheimer's disease. Experimental Gerontology. 2015;68:8–12. doi: 10.1016/j.exger.2014.10.006. - DOI - PubMed