

Limited Correlation of Shotgun Metagenomics Following Host Depletion and Routine Diagnostics for Viruses and Bacteria in Low Concentrated Surrogate and Clinical Samples
- PMID: 30406048
- PMCID: PMC6206298
- DOI: 10.3389/fcimb.2018.00375
Limited Correlation of Shotgun Metagenomics Following Host Depletion and Routine Diagnostics for Viruses and Bacteria in Low Concentrated Surrogate and Clinical Samples
Abstract
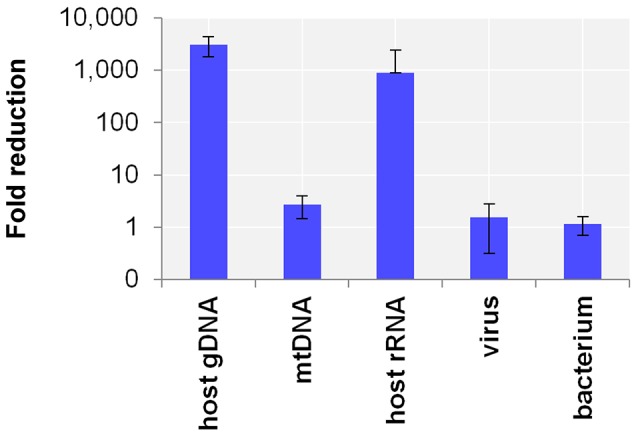
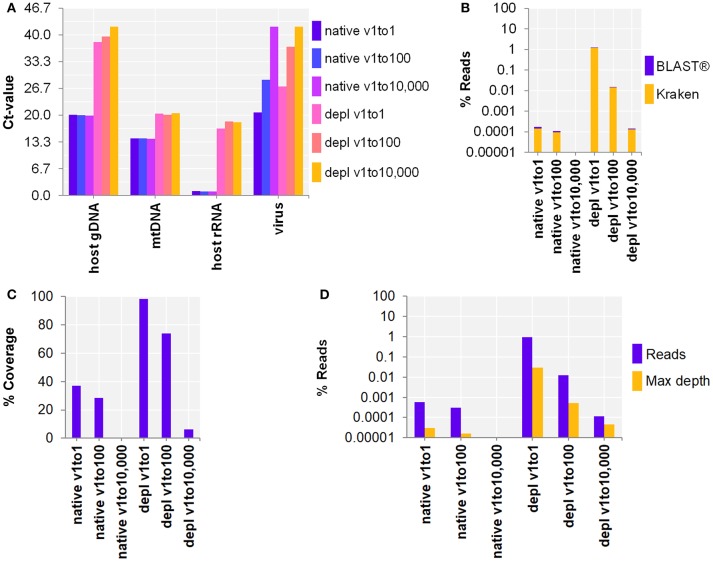
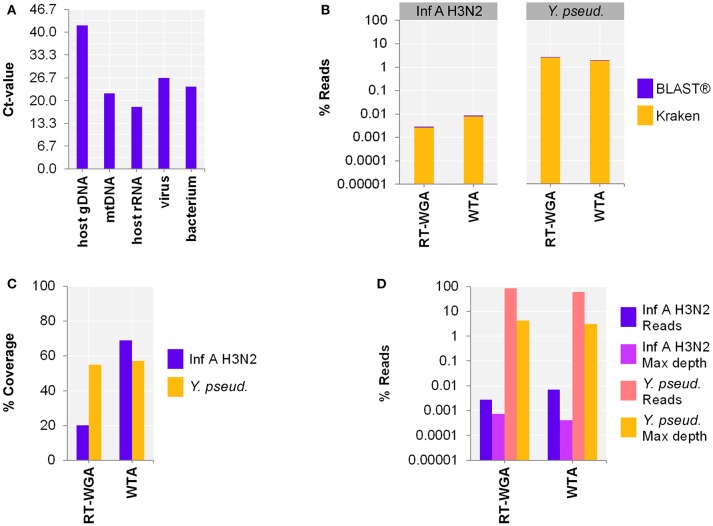
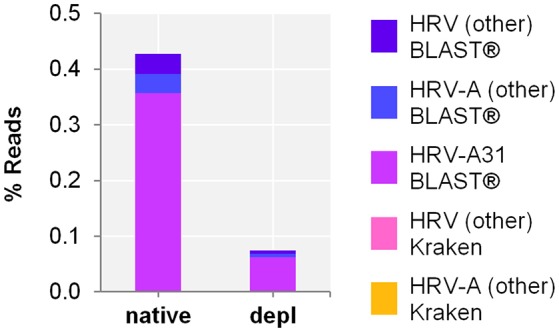
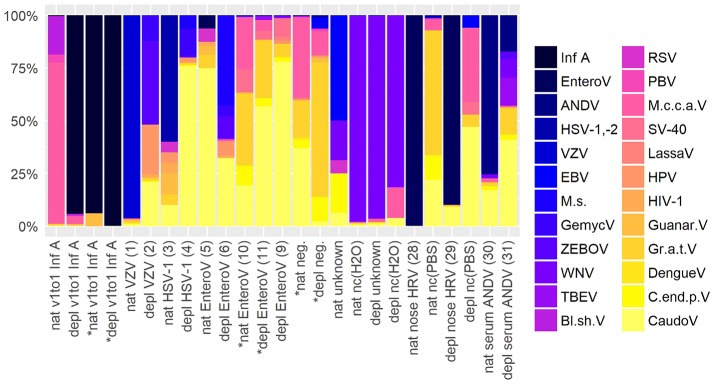
The etiologic cause of encephalitis, meningitis or meningo-encephalitis is unknown in up to 70% of cases. Clinical shotgun metagenomics combined with host depletion is a promising technique to identify infectious etiologies of central nervous system (CNS) infections. We developed a straightforward eukaryotic host nucleic acid depletion method that preserves intact viruses and bacteria for subsequent shotgun metagenomics screening of clinical samples, focusing on cerebrospinal fluid (CSF). A surrogate CSF sample for a CNS infection paradigm was used to evaluate the proposed depletion method consisting of selective host cell lysis, followed by enzymatic degradation of the liberated genomic DNA for final depletion with paramagnetic beads. Extractives were subjected to reverse transcription, followed by whole genome amplification and next generation sequencing. The effectiveness of the host depletion method was demonstrated in surrogate CSF samples spiked with three 1:100 dilutions of Influenza A H3N2 virus (qPCR Ct-values 20.7, 28.8, >42/negative). Compared to the native samples, host depletion increased the amount of the virus subtype reads by factor 7127 and 132, respectively, while in the qPCR negative sample zero vs. 31 (1.4E-4 %) virus subtype reads were detected (native vs. depleted). The workflow was applied to thirteen CSF samples of patients with meningo-/encephalitis (two bacterial, eleven viral etiologies), a serum of an Andes virus infection and a nose swab of a common cold patient. Unlike surrogate samples, host depletion of the thirteen human CSF samples and the nose swab did not result in more reads indicating presence of damaged pathogens due to, e.g., host immune response. Nevertheless, previously diagnosed pathogens in the human CSF samples (six viruses, two bacteria), the serum, and the nose swab (Human rhinovirus A31) were detected in the depleted and/or the native samples. Unbiased evaluation of the taxonomic profiles supported the diagnosed pathogen in two native CSF samples and the native and depleted serum and nose swab, while detecting various contaminations that interfered with pathogen identification at low concentration levels. In summary, damaged pathogens and contaminations complicated analysis and interpretation of clinical shotgun metagenomics data. Still, proper consideration of these issues may enable future application of metagenomics for clinical diagnostics.
Keywords: CSF; NGS; bacteria; central nervous system infection; diagnostics; host depletion; shotgun metagenomics; viruses.
Figures
Similar articles
-
Enhanced Virus Detection and Metagenomic Sequencing in Patients with Meningitis and Encephalitis.mBio. 2021 Aug 31;12(4):e0114321. doi: 10.1128/mBio.01143-21. Epub 2021 Aug 31. mBio. 2021. PMID: 34465023 Free PMC article.
-
Shotgun metagenomics to investigate unknown viral etiologies of pediatric meningoencephalitis.PLoS One. 2023 Dec 21;18(12):e0296036. doi: 10.1371/journal.pone.0296036. eCollection 2023. PLoS One. 2023. PMID: 38127927 Free PMC article.
-
Development and Optimization of Metagenomic Next-Generation Sequencing Methods for Cerebrospinal Fluid Diagnostics.J Clin Microbiol. 2018 Aug 27;56(9):e00472-18. doi: 10.1128/JCM.00472-18. Print 2018 Sep. J Clin Microbiol. 2018. PMID: 29976594 Free PMC article.
-
Application of metagenomic next-generation sequencing in the diagnosis of infectious diseases.Front Cell Infect Microbiol. 2024 Nov 15;14:1458316. doi: 10.3389/fcimb.2024.1458316. eCollection 2024. Front Cell Infect Microbiol. 2024. PMID: 39619659 Free PMC article. Review.
-
Metagenomic approaches to identifying infectious agents.Rev Sci Tech. 2016 Apr;35(1):83-93. doi: 10.20506/rst.35.1.2419. Rev Sci Tech. 2016. PMID: 27217170 Review.
Cited by
-
A Retrospective Analysis of Metagenomic Next Generation Sequencing (mNGS) of Cerebrospinal Fluid from Patients with Suspected Encephalitis or Meningitis Infections.J Healthc Eng. 2022 Apr 21;2022:5641609. doi: 10.1155/2022/5641609. eCollection 2022. J Healthc Eng. 2022. PMID: 35494515 Free PMC article.
-
Case Report: Comparison of Plasma Metagenomics to Bacterial PCR in a Case of Prosthetic Valve Endocarditis.Front Pediatr. 2021 Jan 7;8:575674. doi: 10.3389/fped.2020.575674. eCollection 2020. Front Pediatr. 2021. PMID: 33489996 Free PMC article.
-
A Collaborative Tale of Diagnosing and Treating Chronic Pulmonary Aspergillosis, from the Perspectives of Clinical Microbiologists, Surgical Pathologists, and Infectious Disease Clinicians.J Fungi (Basel). 2020 Jul 11;6(3):106. doi: 10.3390/jof6030106. J Fungi (Basel). 2020. PMID: 32664547 Free PMC article. Review.
-
The 28S rRNA RT-qPCR assay for host depletion evaluation to enhance avian virus detection in Illumina and Nanopore sequencing.Front Microbiol. 2024 Jan 31;15:1328987. doi: 10.3389/fmicb.2024.1328987. eCollection 2024. Front Microbiol. 2024. PMID: 38351914 Free PMC article.
-
Metagenomic Sequencing for Microbial DNA in Human Samples: Emerging Technological Advances.Int J Mol Sci. 2022 Feb 16;23(4):2181. doi: 10.3390/ijms23042181. Int J Mol Sci. 2022. PMID: 35216302 Free PMC article. Review.
References
-
- Adley C. C., Ryan M. P., Pembroke J. T., Saieb F. M. (2005). Ralstonia pickettii: biofilm formation in high- purity water, in Biofilms: Persistence and Ubiquity, eds McBain A., Allison D., Pratten J., Spratt D., Upton M., Verran J. (Cardiff: Biofilm Club; ), 261–271.