Effect of Pre-meal Water Consumption on Energy Intake and Satiety in Non-obese Young Adults
- PMID: 30406058
- PMCID: PMC6209729
- DOI: 10.7762/cnr.2018.7.4.291
Effect of Pre-meal Water Consumption on Energy Intake and Satiety in Non-obese Young Adults
Abstract
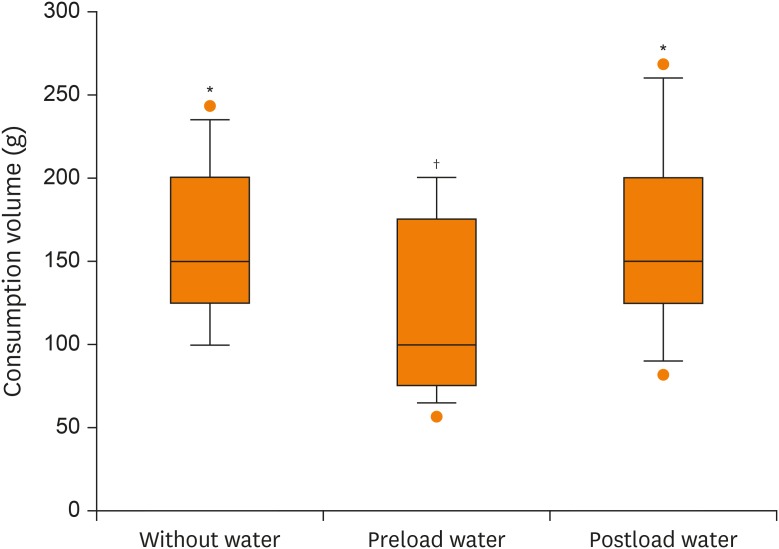
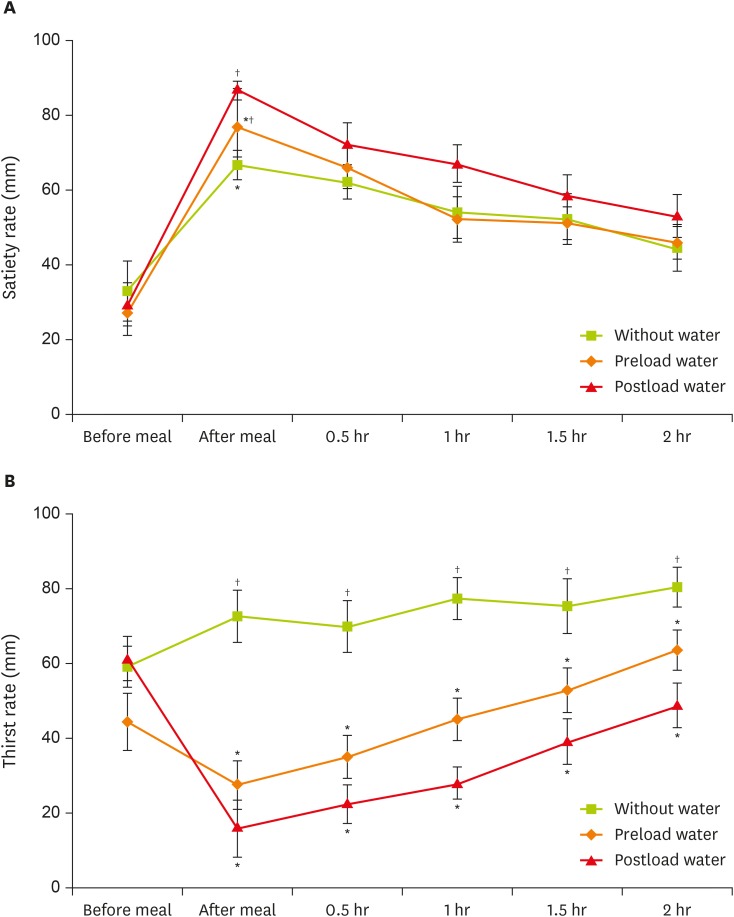
I determined whether water consumption reduces energy intake and affects satiety in non-obese young adults. The final subjects consisted of 15 individuals (8 women and 7 men) with average ages of 26.4 and 23.5 years for women and men, respectively. When subjects drank water before eating a test meal, they ate a lower amount of the test meal compared to eating test meals under waterless and postload water conditions (preload water: 123.3 g vs. waterless: 161.7 g or postload water: 163.3 g, p < 0.05). Water consumption after eating a test meal did not affect energy intake. When the subjects drank water before eating a test meal, despite consuming a lower amount, the subjects did not feel significantly less satiety than eating meals under waterless or postload water conditions. The finding that pre-meal water consumption led to a significant reduction in meal energy intake in young adults suggests that pre-meal water consumption may be an effective weight control strategy, although the mechanism of action is unknown.
Keywords: Energy intake; Obesity; Satiation; Water.
Conflict of interest statement
Conflict of Interest: The author declares that they have no competing interests.
Figures
Similar articles
-
Pre-meal water consumption reduces meal energy intake in older but not younger subjects.Obesity (Silver Spring). 2007 Jan;15(1):93-9. doi: 10.1038/oby.2007.506. Obesity (Silver Spring). 2007. PMID: 17228036
-
Immediate pre-meal water ingestion decreases voluntary food intake in lean young males.Eur J Nutr. 2016 Mar;55(2):815-819. doi: 10.1007/s00394-015-0903-4. Epub 2015 Apr 18. Eur J Nutr. 2016. PMID: 25893719 Clinical Trial.
-
Eating slowly led to decreases in energy intake within meals in healthy women.J Am Diet Assoc. 2008 Jul;108(7):1186-91. doi: 10.1016/j.jada.2008.04.026. J Am Diet Assoc. 2008. PMID: 18589027 Clinical Trial.
-
Acute appetite reduction associated with an increased frequency of eating in obese males.Int J Obes Relat Metab Disord. 1999 Nov;23(11):1151-9. doi: 10.1038/sj.ijo.0801046. Int J Obes Relat Metab Disord. 1999. PMID: 10578205
-
Dairy products, satiety and food intake: A meta-analysis of clinical trials.Clin Nutr. 2017 Apr;36(2):389-398. doi: 10.1016/j.clnu.2016.01.017. Epub 2016 Feb 13. Clin Nutr. 2017. PMID: 26923518 Review.
Cited by
-
Challenges to lifestyle modification of chronic disease patients attending primary health care centers in Riyadh.J Family Med Prim Care. 2020 Dec 31;9(12):6186-6193. doi: 10.4103/jfmpc.jfmpc_1037_20. eCollection 2020 Dec. J Family Med Prim Care. 2020. PMID: 33681062 Free PMC article.
-
The Effect of Acute Hypohydration on Indicators of Glycemic Regulation, Appetite, Metabolism and Stress: A Systematic Review and Meta-Analysis.Nutrients. 2020 Aug 20;12(9):2526. doi: 10.3390/nu12092526. Nutrients. 2020. PMID: 32825404 Free PMC article.
-
Assessment of EMA binge-eating symptoms in Adolescents: Factor analysis and associations with social context and food types.Appetite. 2025 Jun 26;214:108212. doi: 10.1016/j.appet.2025.108212. Online ahead of print. Appetite. 2025. PMID: 40581181
-
A review of pediatric fasting guidelines and strategies to help children manage preoperative fasting.Paediatr Anaesth. 2023 Dec;33(12):1012-1019. doi: 10.1111/pan.14738. Epub 2023 Aug 2. Paediatr Anaesth. 2023. PMID: 37533337 Free PMC article. Review.
-
Water intake and obesity: By amount, timing, and perceived temperature of drinking water.PLoS One. 2024 Apr 25;19(4):e0301373. doi: 10.1371/journal.pone.0301373. eCollection 2024. PLoS One. 2024. PMID: 38662725 Free PMC article.
References
-
- Strissel KJ, Stancheva Z, Miyoshi H, Perfield JW, 2nd, DeFuria J, Jick Z, Greenberg AS, Obin MS. Adipocyte death, adipose tissue remodeling, and obesity complications. Diabetes. 2007;56:2910–2918. - PubMed
-
- Ayyad C, Andersen T. Long-term efficacy of dietary treatment of obesity: a systematic review of studies published between 1931 and 1999. Obes Rev. 2000;1:113–119. - PubMed
-
- DellaValle DM, Roe LS, Rolls BJ. Does the consumption of caloric and non-caloric beverages with a meal affect energy intake? Appetite. 2005;44:187–193. - PubMed
LinkOut - more resources
Full Text Sources
Research Materials